Of Ethereum’s $174M liquidations and fading hopes of $4K
ETH's OBV has been in a downtrend since mid-March, showing intense bearish momentum.

- Ethereum saw its market structure flip bearishly on the 12-hour timeframe.
- The idea of a range formation would be invalidated upon a price drop below $2850.
Ethereum [ETH] investors could be in trouble as prices dipped below the psychological $3k support level.
The past week saw an increased whale activity and accumulation, but the recent wave of selling caught traders off guard.
AMBCrypto’s analysis of Coinglass’ data showed that $174 million of liquidation was seen in the past 24 hours for Ethereum.
Of that, 80.42% were positioned long. The drop took prices beneath a key demand zone at $3.1k.
The Fibonacci level was soundly beaten
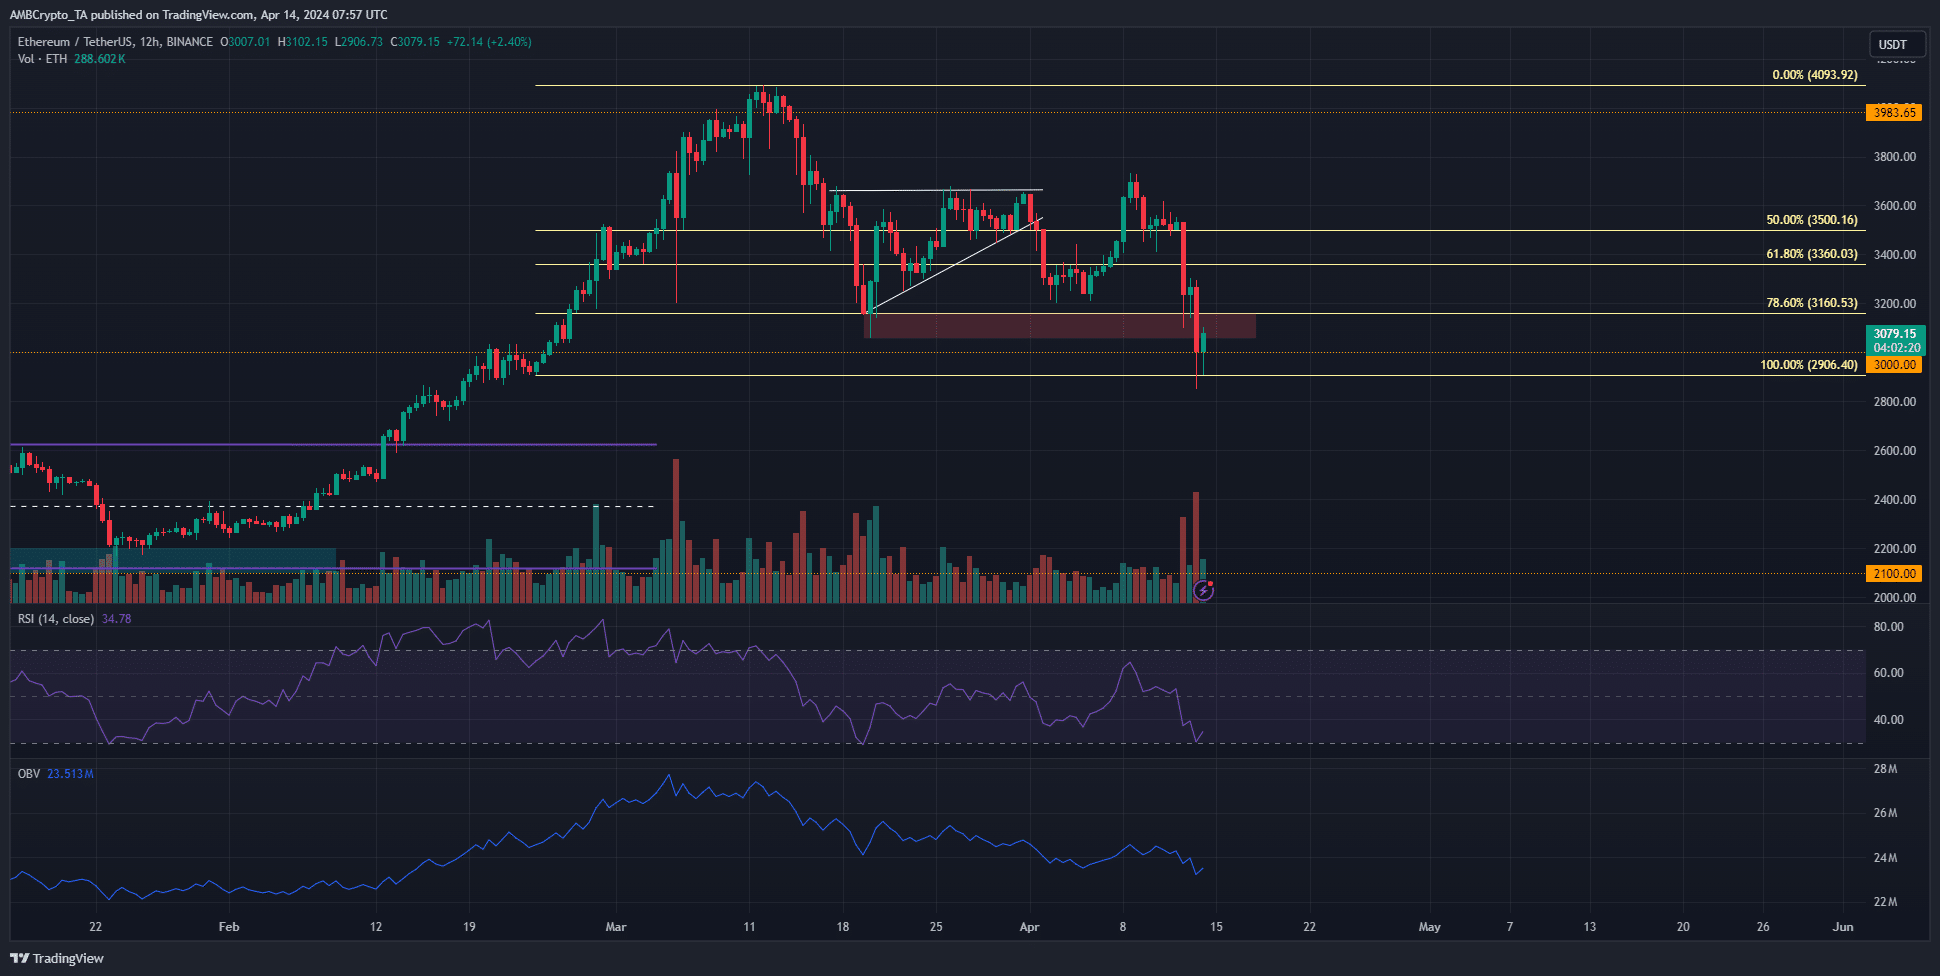
The 78.6% retracement level based on Ethereum’s rally in February was plotted at $3160. The recent losses saw a 12-hour session close at $3007. Therefore, the demand zone from $3100-$3200 has been invalidated.
On the other hand, the rally before this dump reached $3.7k before reversing. It has formed a month-long range that reached from $3160 to $3700.
This dip below the range lows suggested that the liquidity had been swept, and the path for another rally to $3.7k was clear.
The technical indicators did not favor this argument. The OBV has been in a downtrend since mid-March, showing steady selling volume. The RSI was at 34 to reflect growing downward momentum.
It remained to be seen whether Ethereum would continue its downtrend and fall below the $3k level, or reverse the recent losses and rally quickly to $3.7k.
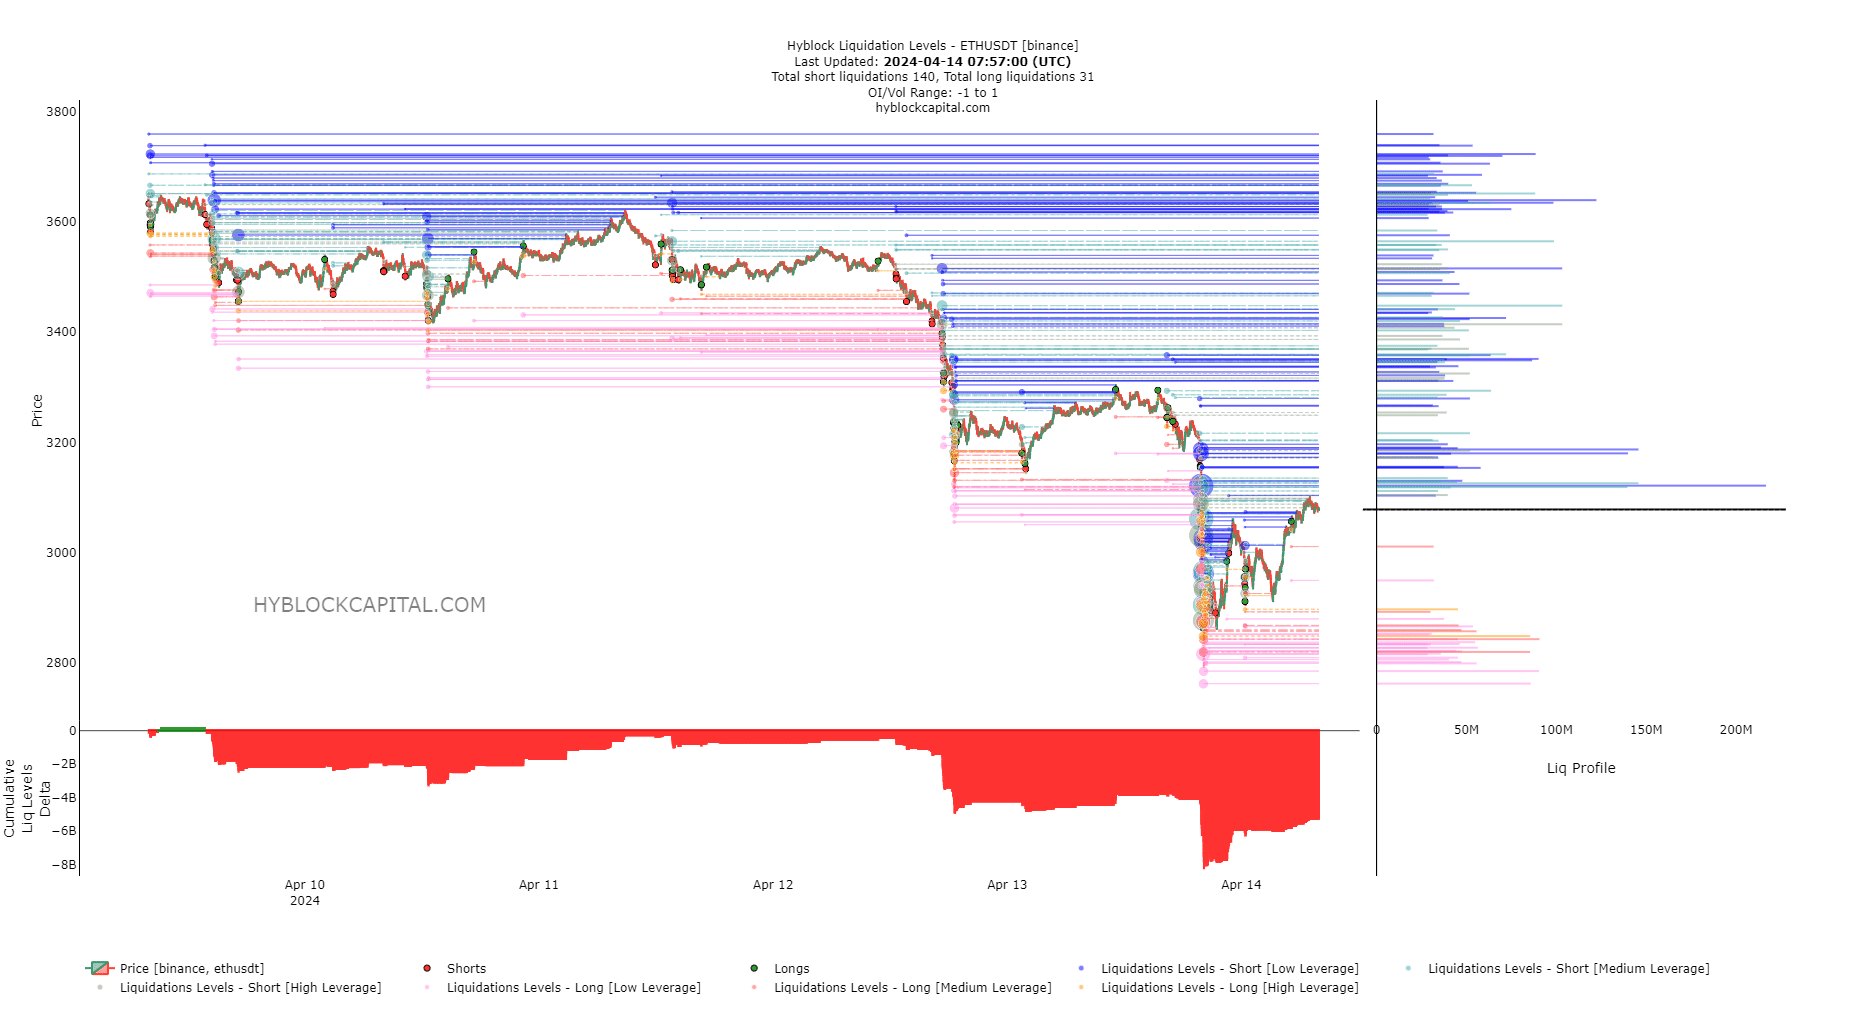
The liquidation levels hinted at the more likely outcome
Technical analysis boils down to managing risk and being prepared for the worst-case scenario, while also assessing which outcome could be more likely, and hence, profitable.
The liquidation levels showed that the market favored an upward move.
The Cumulative Liq Levels Delta was intensely negative. This showed that short liquidation orders vastly outweighed the long ones. It implied that a move higher was more likely for ETH this week.
Read Ethereum’s [ETH] Price Prediction 2024-25
To the north, the $3120, $3180, and $3650 levels had the highest concentration of liquidation levels, making them bullish targets.
With that said, Ethereum could see further losses when the traditional markets open for trading this week. Swing traders could look to buy the blood, with a stop-loss below $2850, based on the liquidation levels.
Disclaimer: The information presented does not constitute financial, investment, trading, or other types of advice and is solely the writer’s opinion.