
AAVE: Bullish momentum builds despite mixed signals: What’s next?

- Binance Coin retested a key support level at $593
- Metrics seemed to point to a potential price surge on the charts
Binance Coin’s (BNB) price was consolidating in a symmetrical triangle after 31 March, before breaking out on 24 May. The price then surged by 22.44% to hit its all-time high, before a pullback to retest the $593-support level. Owing to this pullback, it’s worth looking at when bullish momentum is likely to return to the altcoin’s market.
At the time of writing, the crypto was valued at over $608, down almost 15% from its latest ATH.
With BNB’s market cap just short of its peak at under $90 billion, the altcoin’s charts revealed that the 50-day and 100-day exponential moving averages stood around the $607.5 and $563.2 support levels, respectively.
That being said, it’s worth looking at the altcoin’s charts with caution. With BNB trading above its support levels, the altcoins’s indicators could be key. The Stochastic RSI, for instance, had a reading of 6.10 – A sign that BNB may be in an oversold zone, vulnerable to a likely price reversal before any major price hikes.
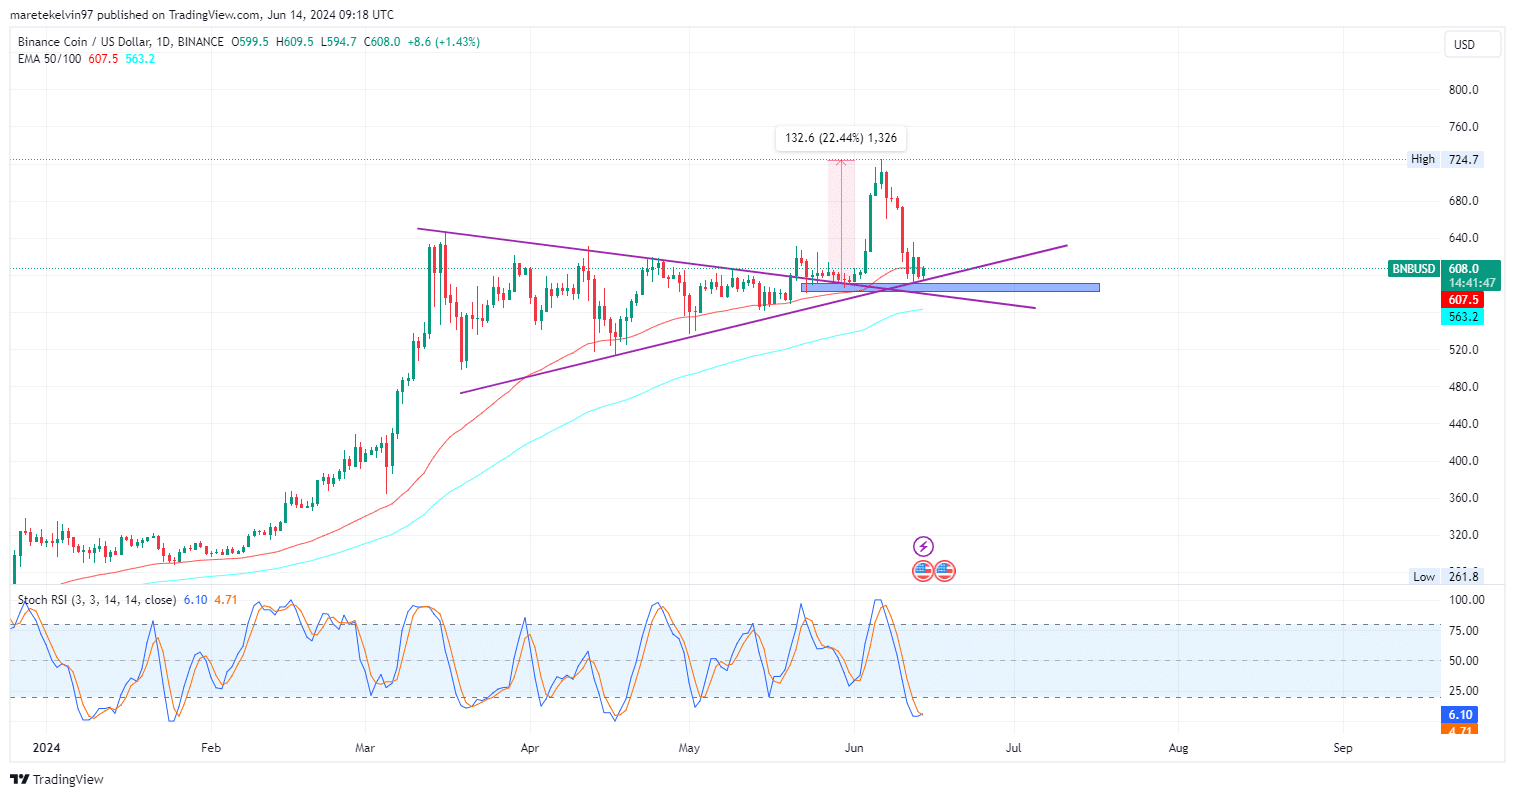
Source: BNB/USD, TradingView
Will whale activity, social volume accelerate the surge?
AMBCrypto’s analysis of whale activity on Santiment revealed a positive ascending trend on the charts. The percentage of stablecoins held by whales with more than $5 million has been increasing steadily. What this means is that large investors are positioning themselves for a potential bullish rally.
Additionally, BNB’s social volume rose significantly too, in correlation with the market’s interests.
The correlation between rising social mentions and price movements emphasized on the market its bullish bias. A greater number of mentions usually precedes significant price actions, either positive or negative.
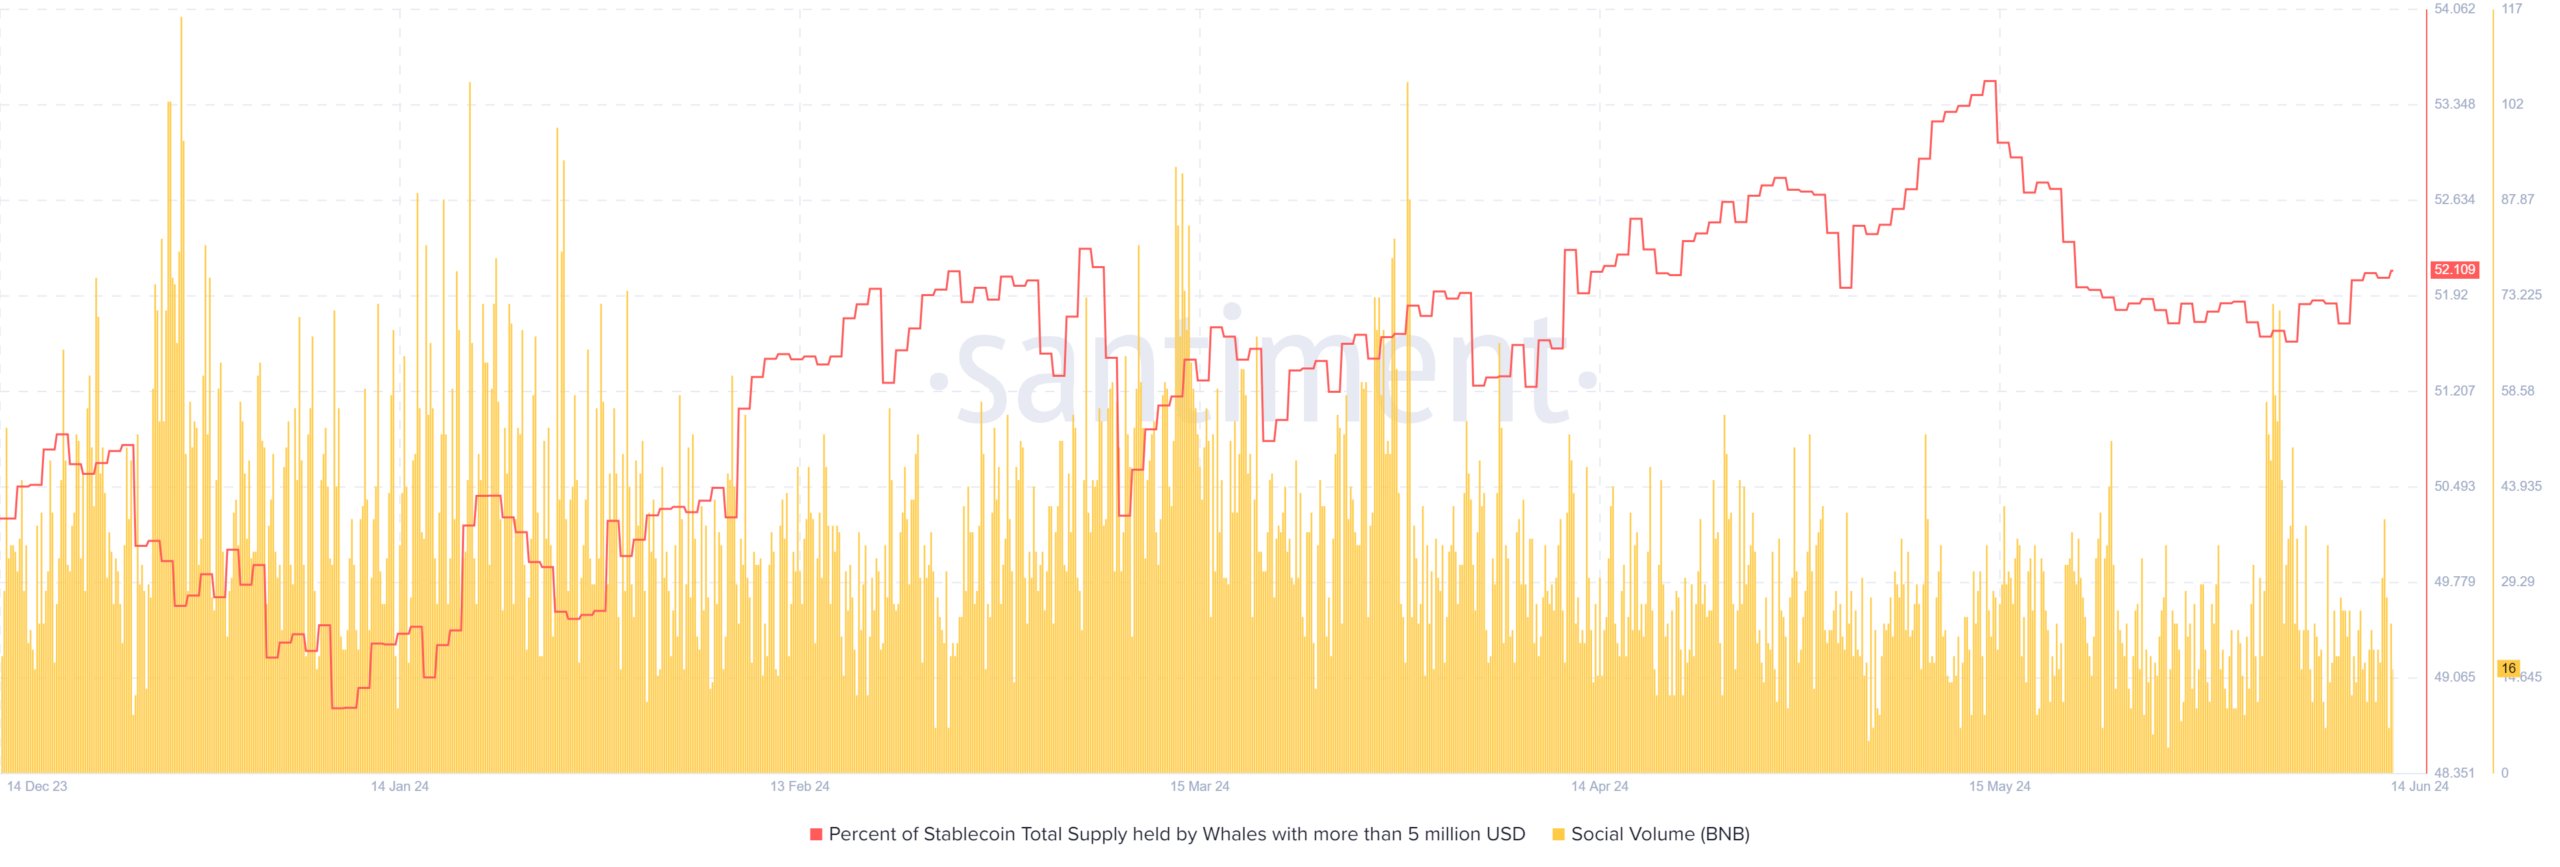
Source: Santiment
AMBCrypto further analyzed the long/short ratio data from Coinglass. It recently recorded several bullish spikes, indicating that the long positions are winning the battle against the short positions.
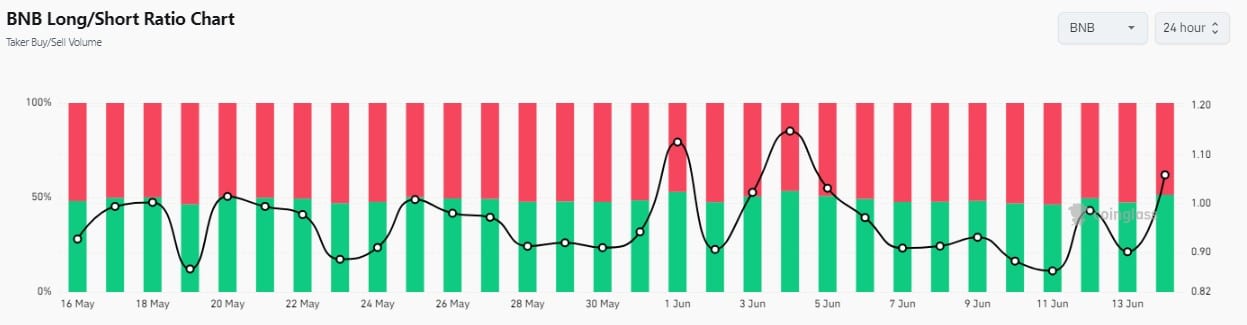
Source: Coinglass
BNB’s price is at a key point right now. On the back of accumulating bullish momentum, reinforced by increasing social volumes and the ascending whale activity recently, Binance Coin may be on the verge of surging to higher price levels.
However, if BNB builds enough bearish pressure and closes below the resistance zone, a price drop might be imminent.


![Solana [SOL]](https://ambcrypto.com/wp-content/uploads/2025/08/Solana-SOL-1-400x240.webp)