
- ONDO’s price has risen by double digits in the last week, while BNB’s value has dropped.
- ONDO is well primed to continue on its uptrend, while BNB remains at the mercy of the bears.
ONDO, the governance token for the Ondo DAO, has outperformed Binance Coin [BNB] in the last week.
While ONDO’s price surged by over 20% during that period, BNB’s price shed 1% of its value, according to CoinMarketCap.
ONDO is on course for more gains
At press time, ONDO exchanged hands at $0.99. Its double-digit rally in the last week has pushed its price above the long-term key resistance level of $0.95.
The price hike is due to an uptick in the demand for the altcoin during the period under review.
According to Santiment’s data, the number of daily active addresses that completed transactions involving ONDO in the last week increased by 101%.
As of the 17th of May, 1843 active addresses traded the altcoin, marking its highest single-day count since the 24th of April.
Likewise, the new demand for ONDO has increased. According to the on-chain data provider, the number of new addresses created to trade ONDO climbed by 86% in the past seven days.
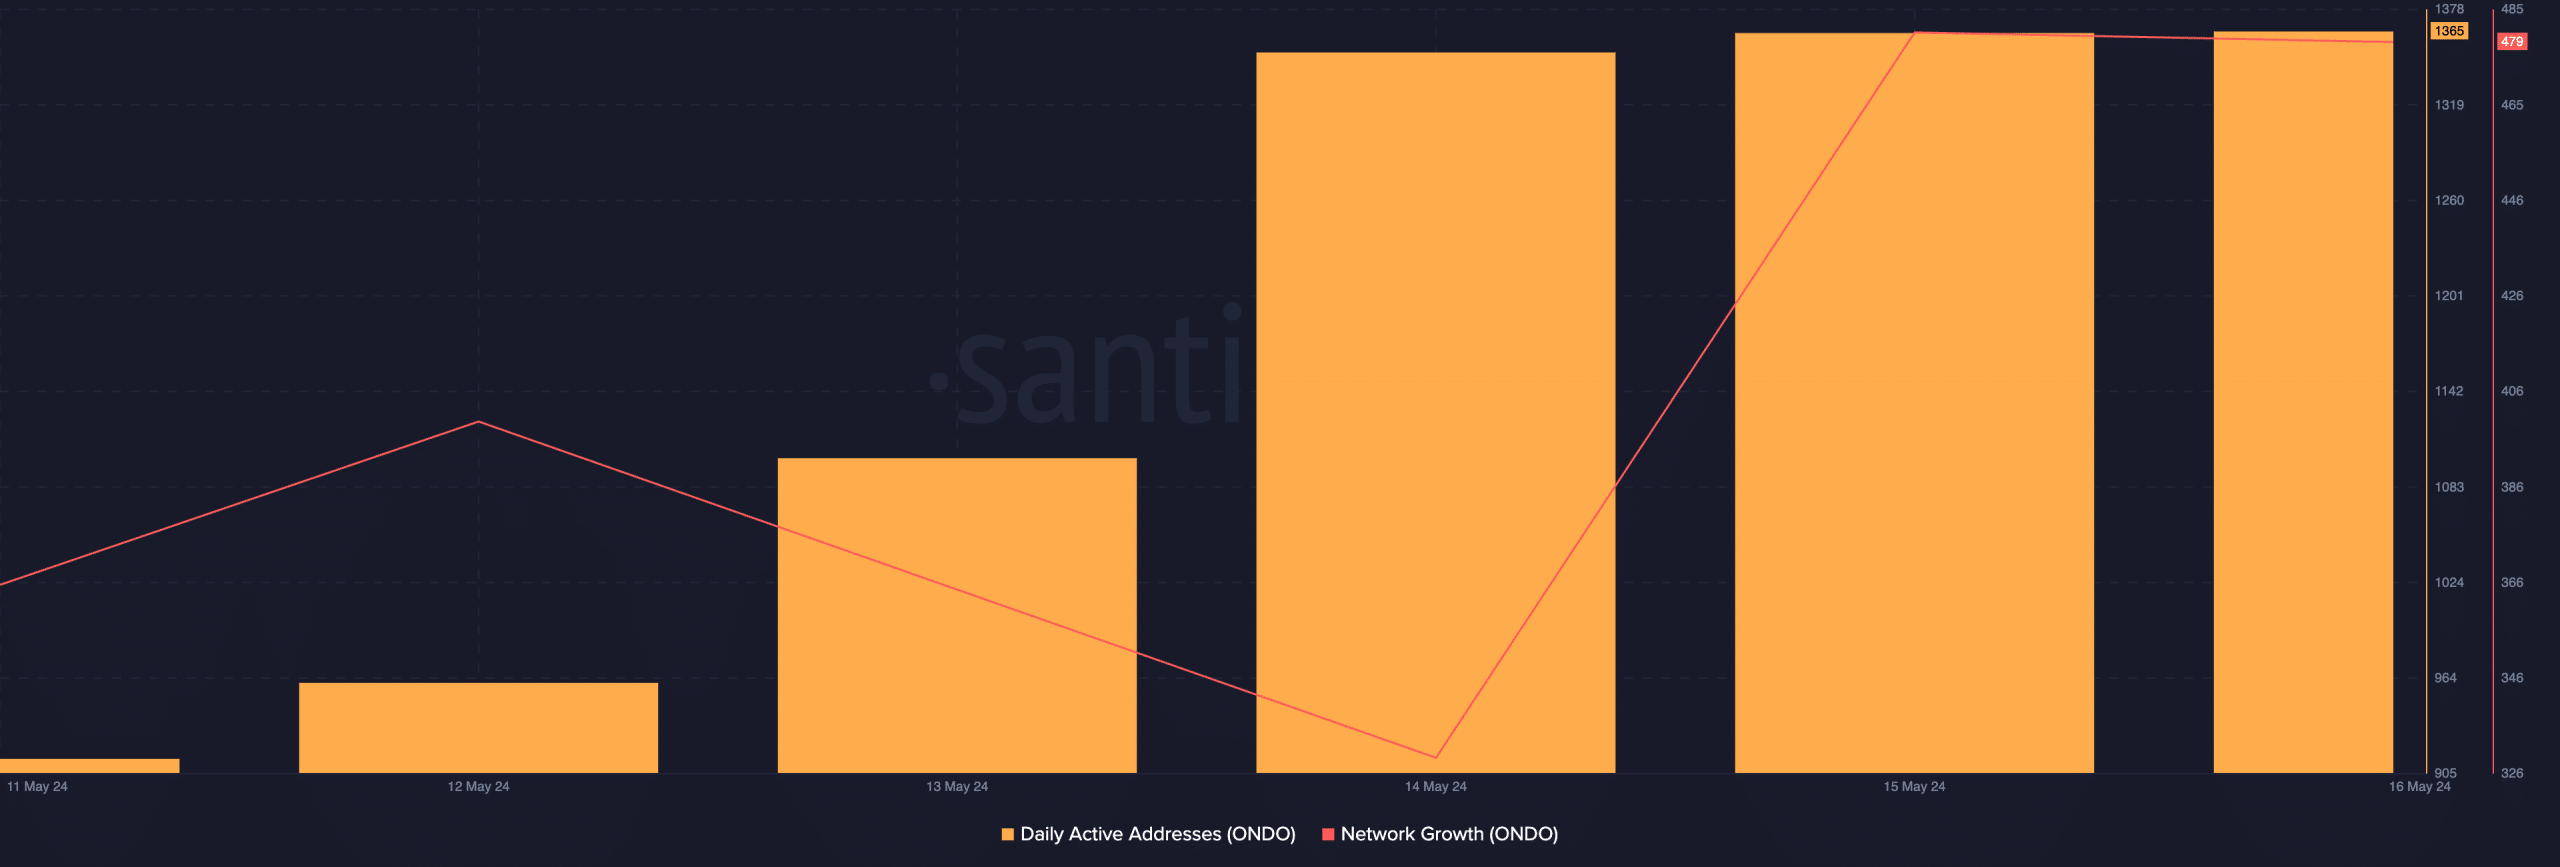
Source: Santiment
The spike in ONDO’s demand is due to how profitable transactions involving the altcoin have been during the period in question.
AMBCrypto assessed the token’s daily ratio of transaction volume in profit to loss (using a 7-day moving average) and found that it returned a value of 3.31.
This meant that every day in the past week, for each ONDO transaction that resulted in a loss, at least 3.31 transactions ended in a profit.
Trading above a key resistance level at press time, ONDO’s price chart suggests that the altcoin might sustain the rally in the short term.
Its Relative Strength Index (RSI) was 68.68, confirming that buying pressure remained significant. Likewise, the dots that make up its Parabolic SAR indicator were positioned under ONDO’s price at press time.
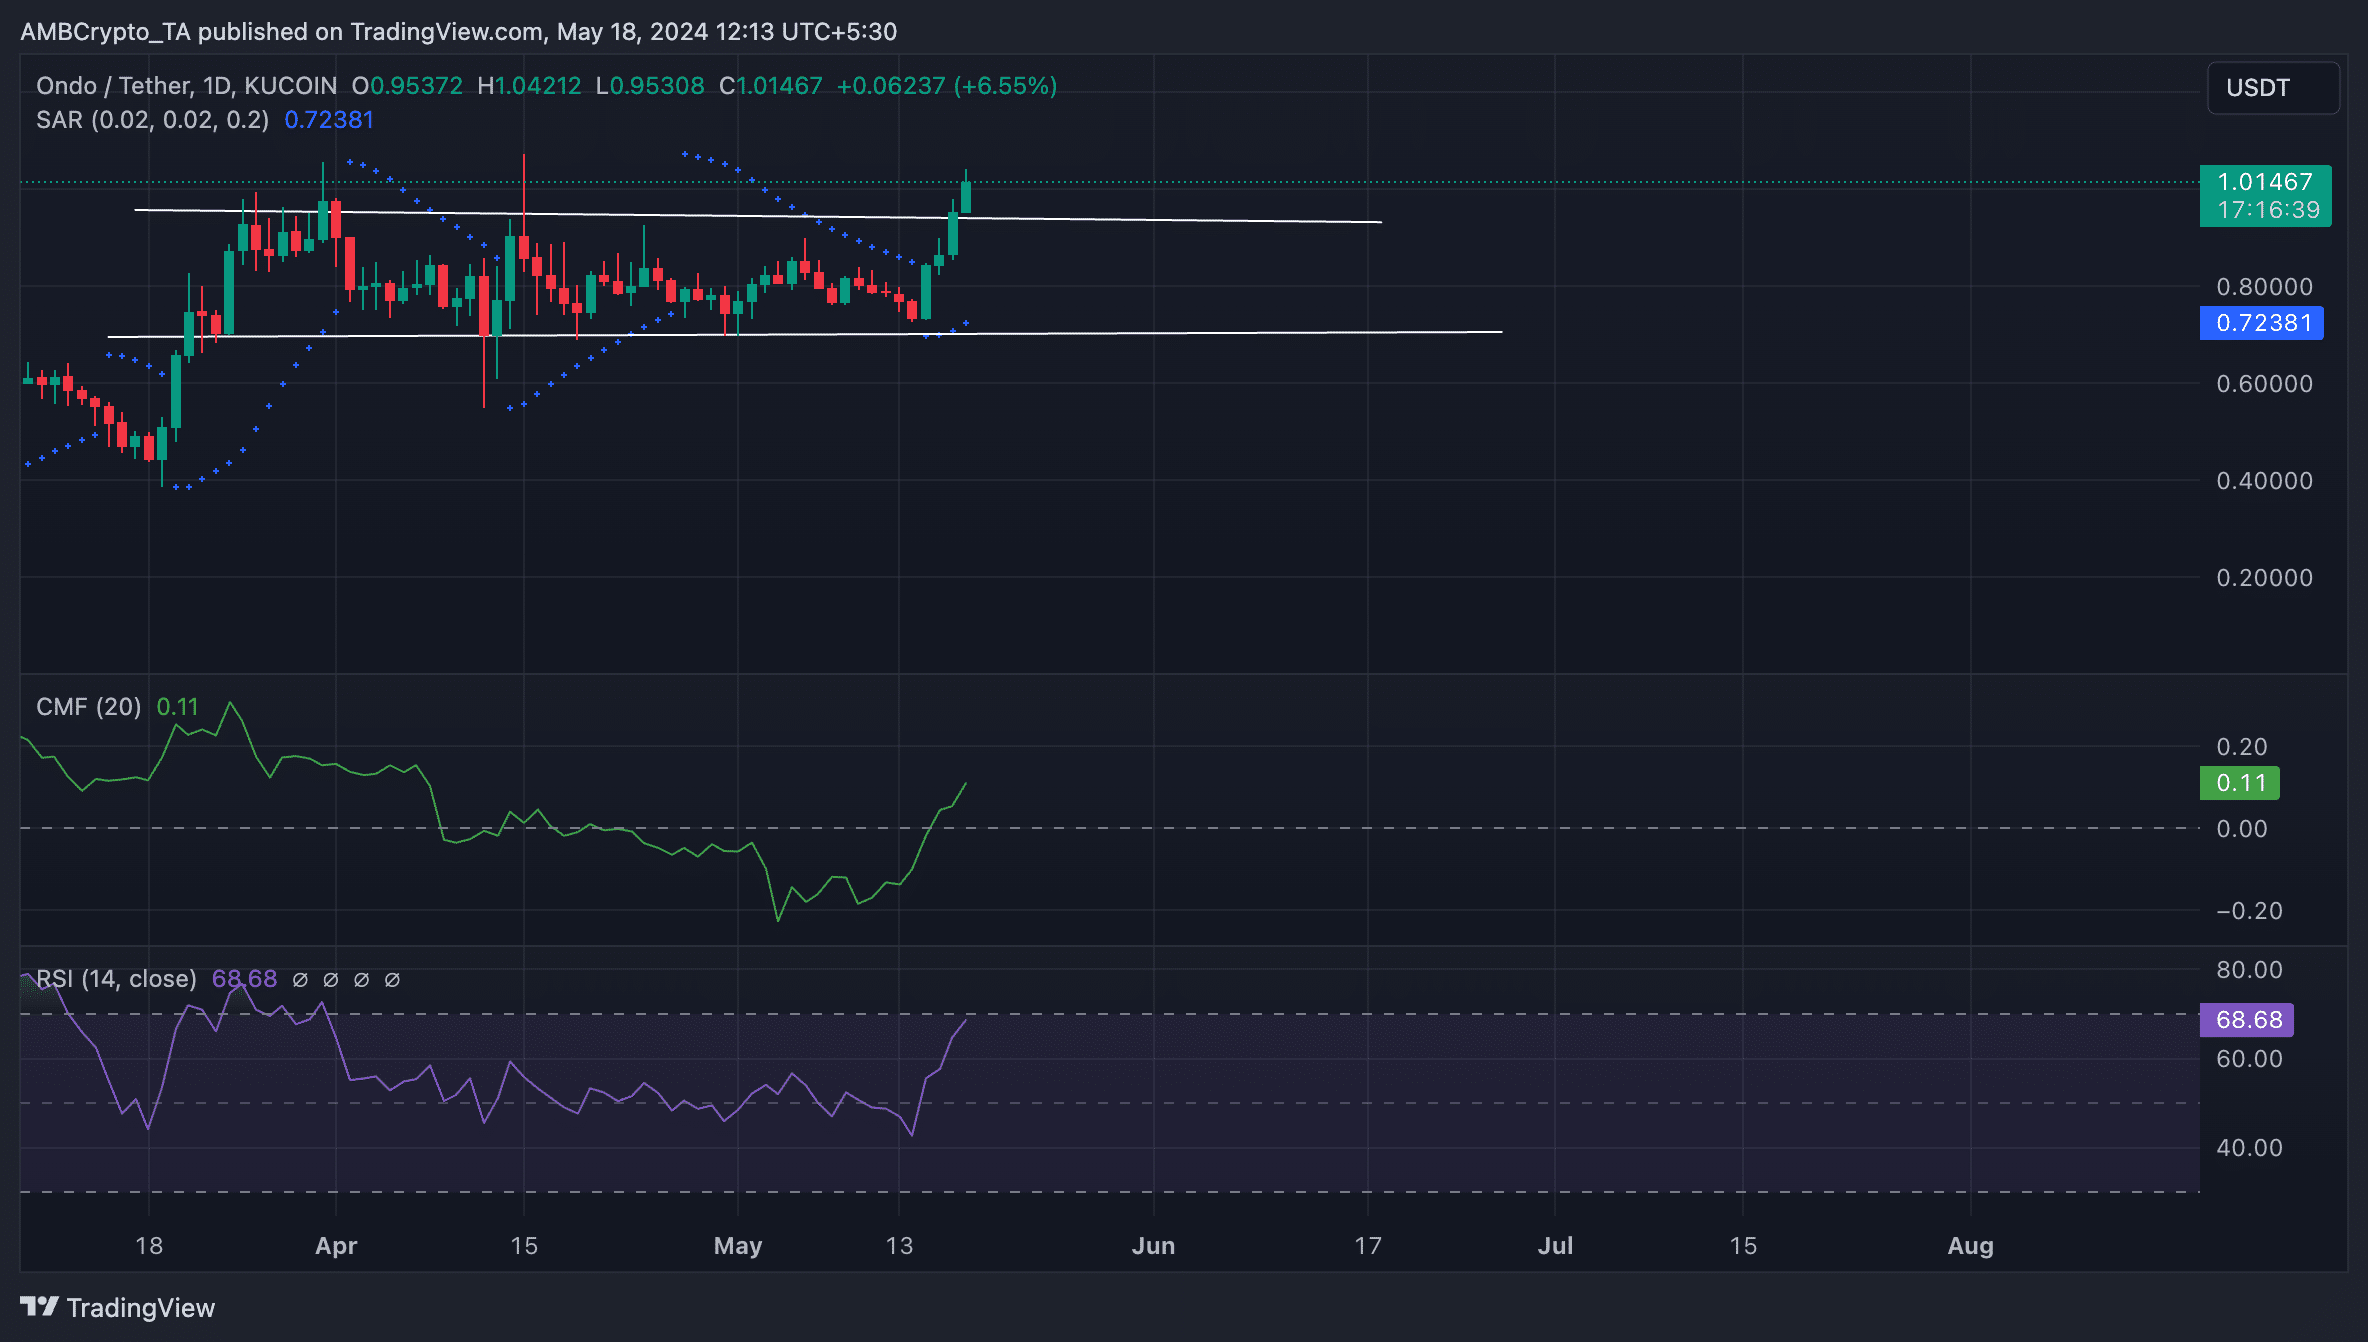
Source: ONDO/USDT on TradingView
This indicator identifies potential trend direction and reversals. When its dotted lines are placed under an asset’s price, the market is said to be in an uptrend.
It often suggests that the rising price of the asset may continue its uptrend.
BNB may take more losses
Regarding BNB, it traded close to the lower line of its symmetrical triangle pattern at press time. This line has formed a key support level for the altcoin since the 7th of March.
Readings from the coin’s moving average convergence/divergence (MACD) indicator suggest that bearish momentum was rising.
Read ONDO’s Price Prediction 2024-25
BNB remains at risk of falling below support and exchanging hands at $538, then $505.
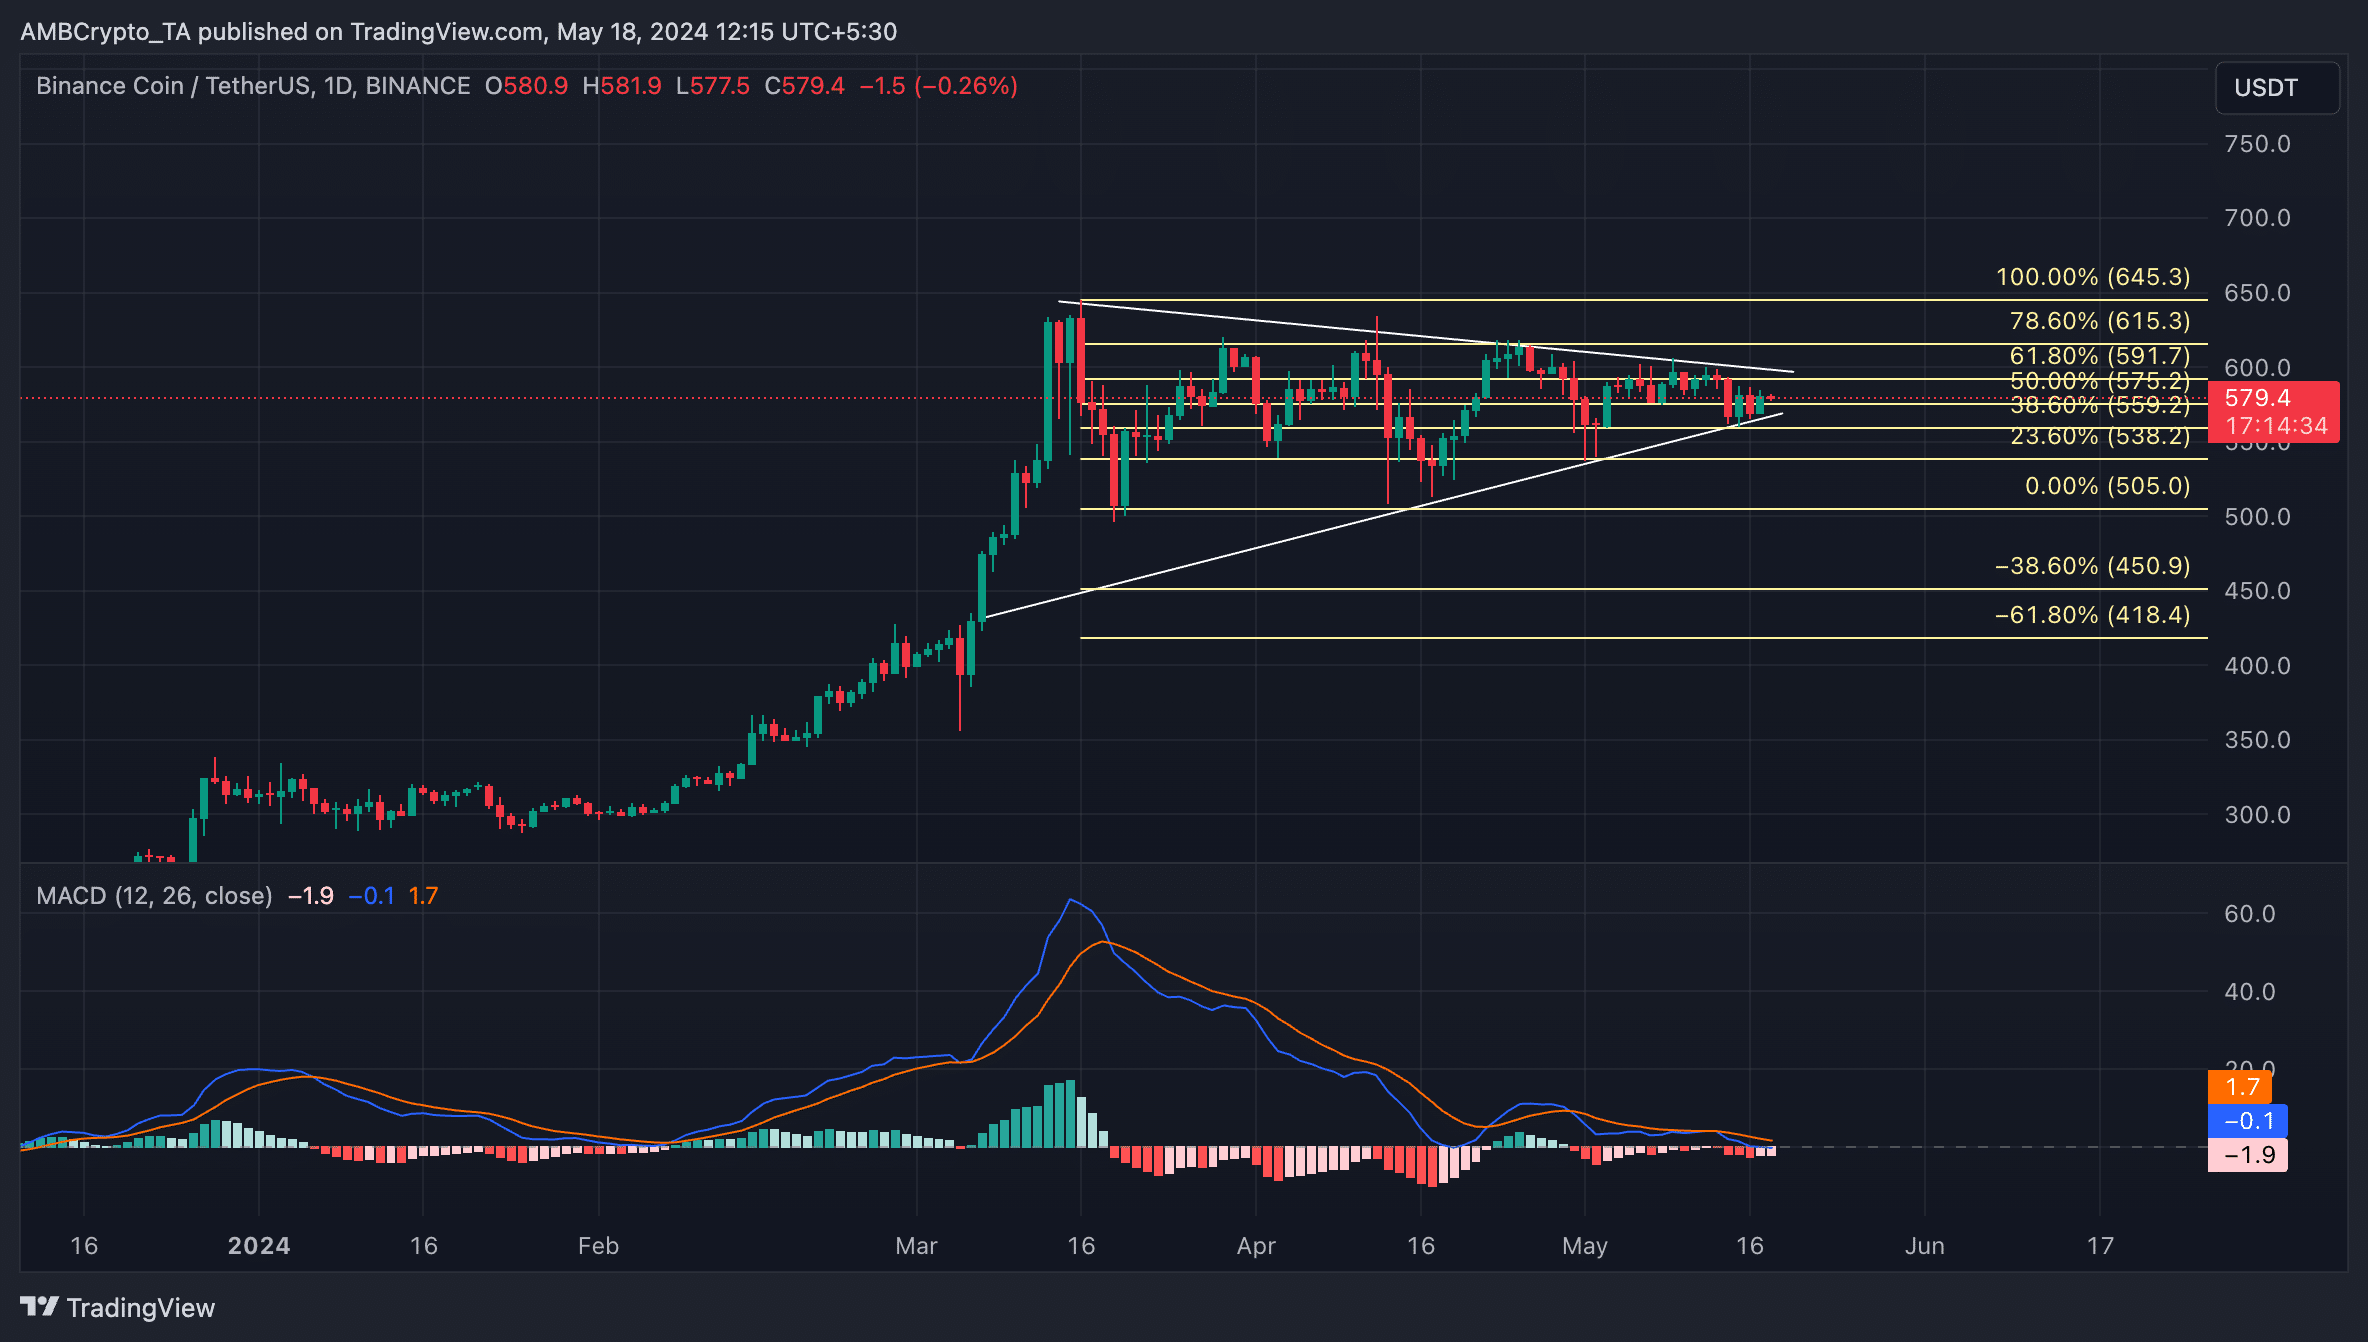
Source: BNB/USDT on TradingView
However, if this projection is invalidated and buying pressure spikes, the coin’s price might rally to trade at $591.