


- Optimism saw a massive increase in transaction volume as it trended above its seven-day Moving Average.
- Optimism [OP] has also been attracting a high number of daily active addresses.
According to a 16 January tweet by crypto analytics firm Delphi Digital, Optimism [OP] has seen high transaction volumes. As far as the data showed, only Ethereum’s [ETH] mainnet had a higher volume of transactions. Also, Optimism ranked higher than another Ethereum Layer 2 network Arbitrum.
Daily transactions on @arbitrum and @optimismFND combined were only 16K transactions short of Ethereum's total daily transactions on January 7th. pic.twitter.com/toXJqNH53i
— Delphi Digital (@Delphi_Digital) January 16, 2023
Read Optimism’s [OP] Price Prediction 2023-24
Dune Analytics’ daily transaction data analysis helps provide a clearer picture of the volume Optimism has been attracting recently. Since December 2022, daily transactions have been on an upward trend, trading above the seven-day Moving Average. However, the volume of transactions in January surpassed last year, suggesting more frequent use of the scaling network.
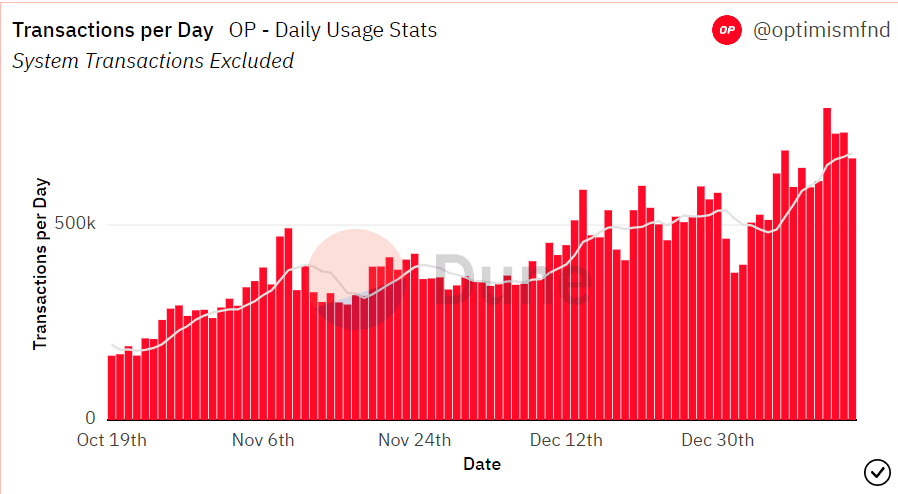
The seven-day moving average has been breached, and the trend above it is now more meaningful due to the increasing volume. The preceding week also saw a record high in volume, with daily transactions of around 800,000 seen on the chart.
Optimism Volume and Active Addresses impacted
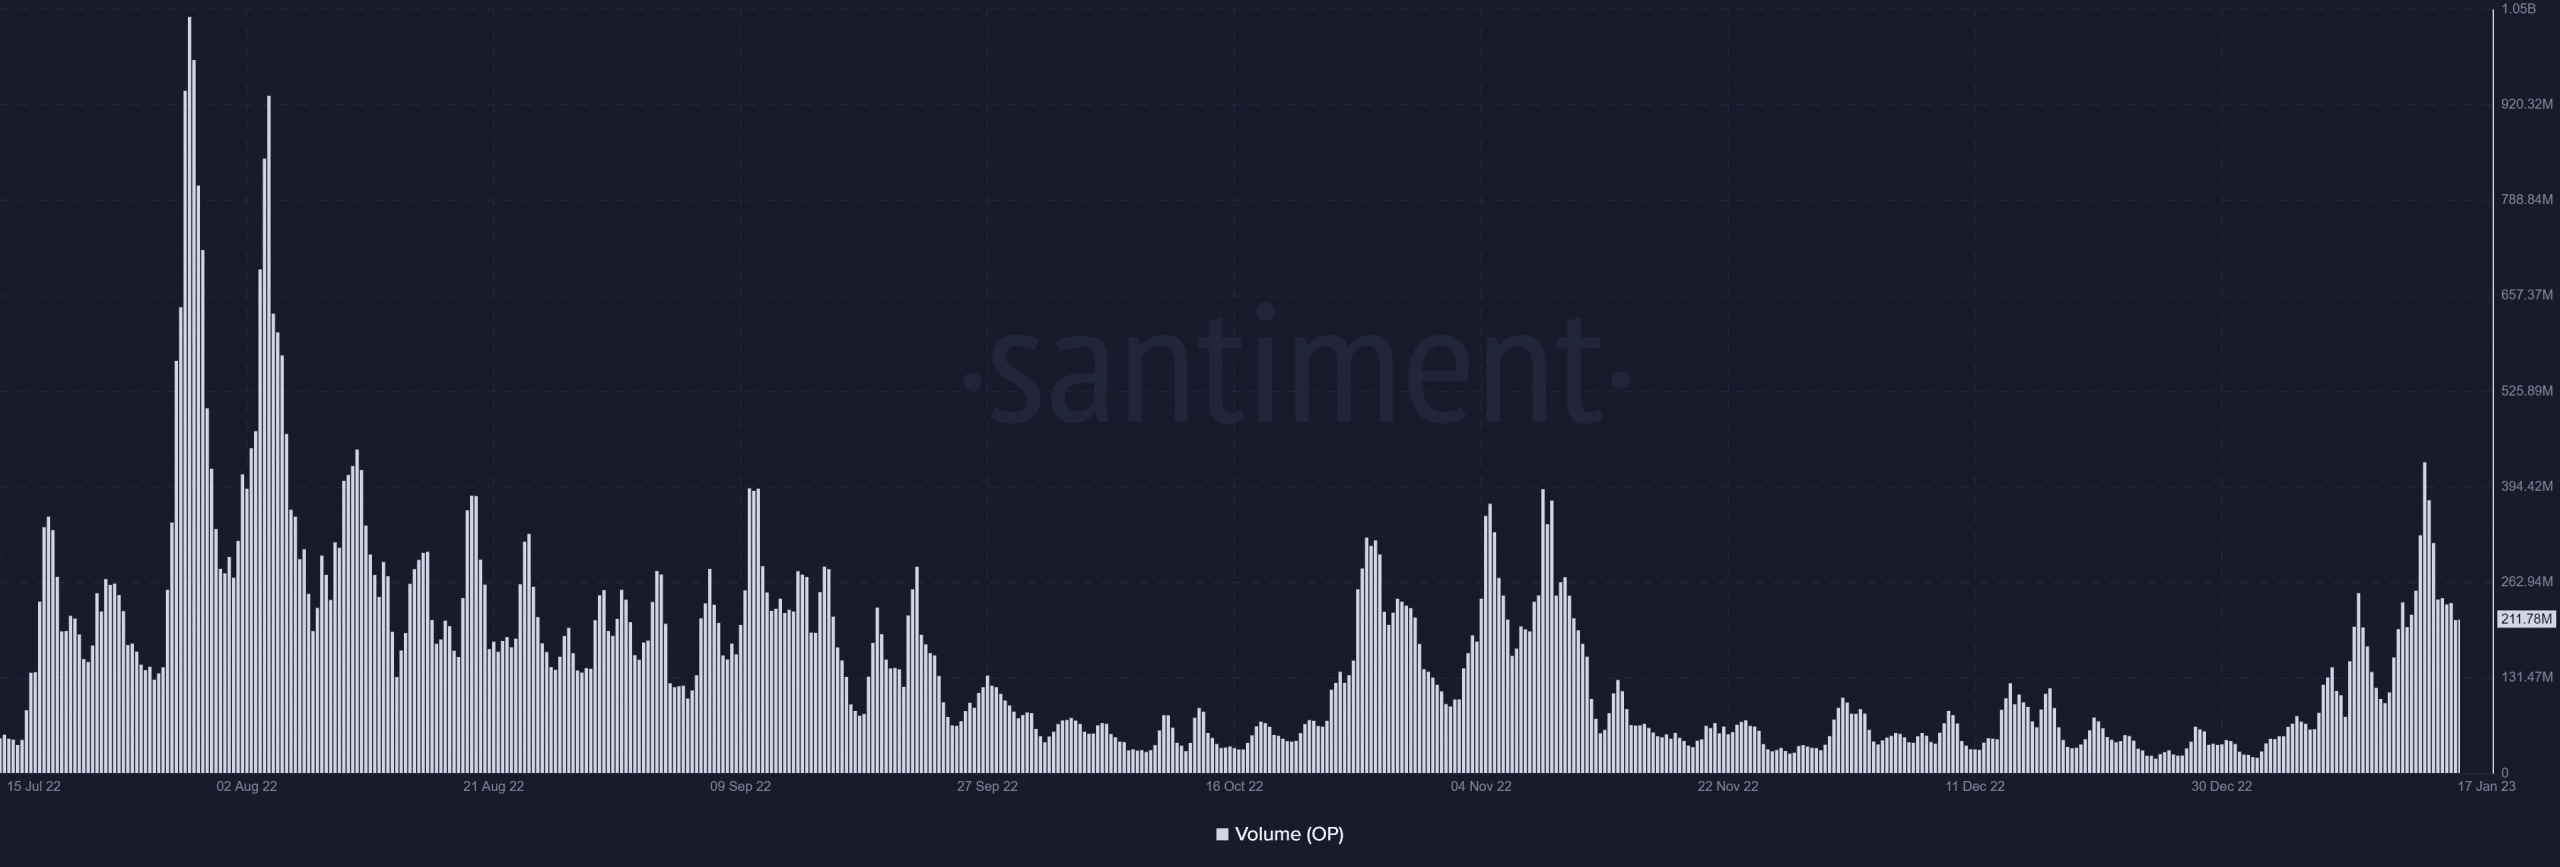
The Optimism network’s recent upward trend appears to be affecting its native token, OP. Santiment’s data indicated that OP has also seen a rise in volume recently. Looking at the chart revealed that the volume measure was currently at levels comparable to those last observed in November and September of the previous year.
As of this writing, the volume had already surpassed 200 million, and on 14 January, it had doubled.
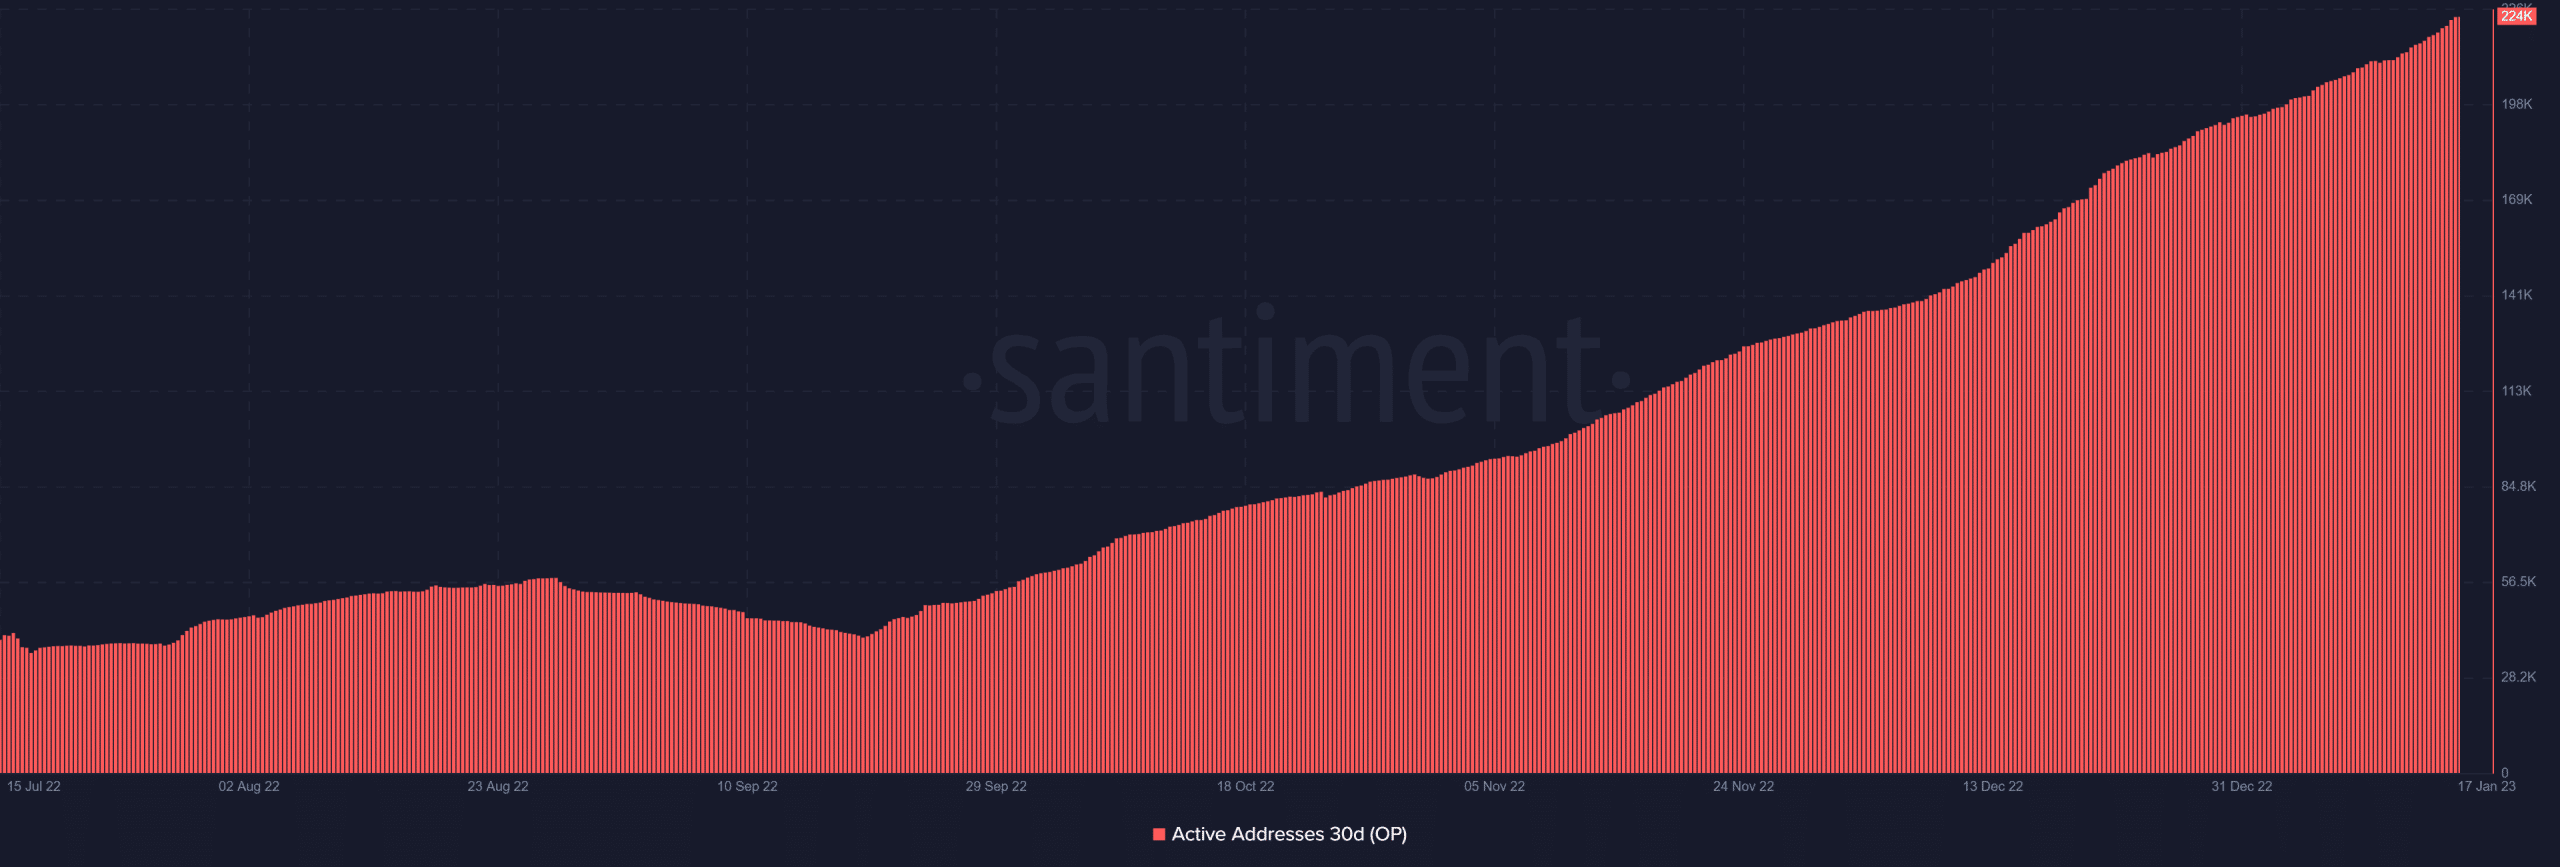
According to the data, there has also been a significant upswing in the number of active addresses during the past 30 days. For context, there were less than 140,000 active addresses in November 2022, but by December of that same year, that number had increased to nearly 192,000.
Over 224,000 active addresses were available as of this writing, a significant increase from what was obtainable the year prior.
OP price remains bullish…But for how long?
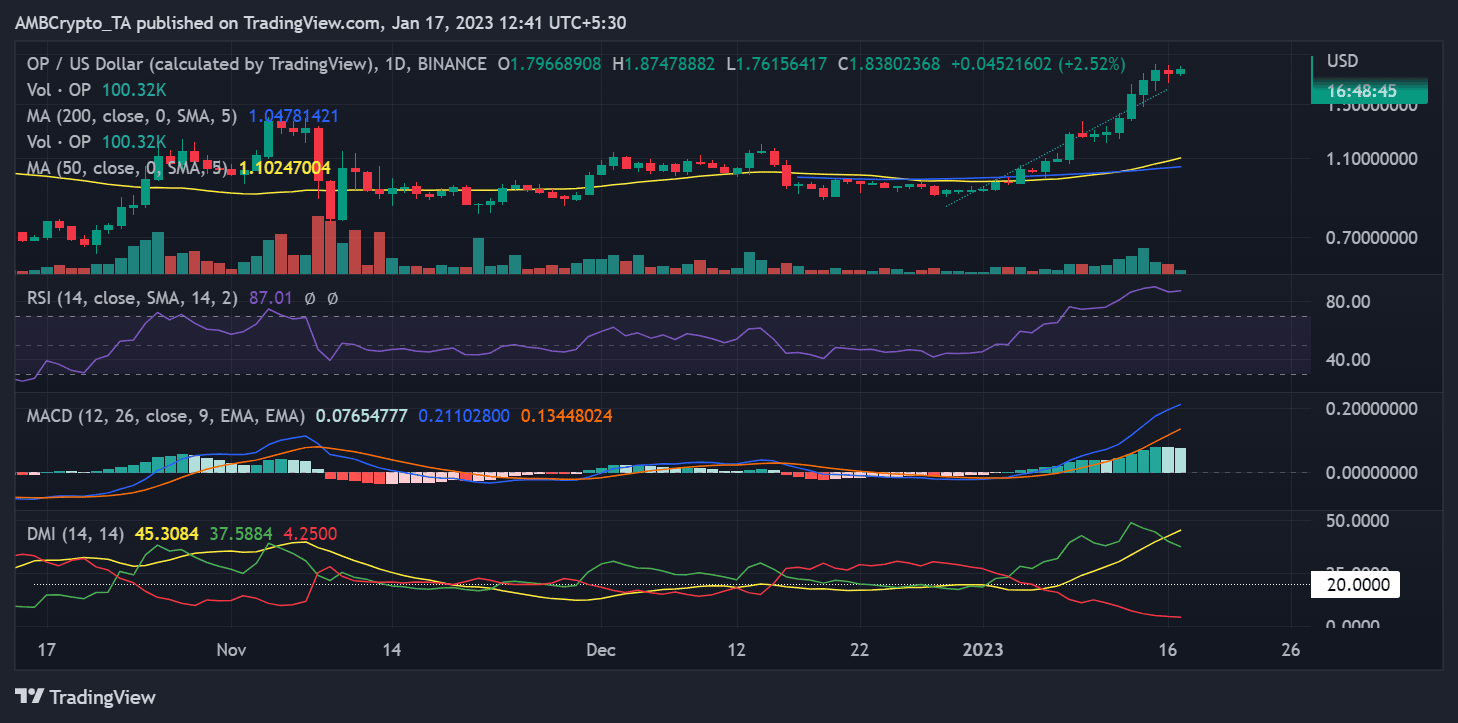
The trend line chart showed that Optimism had been moving upward on a daily timeframe. The trend line has also served as support and resistance as the price has climbed. It was up over 3% as of this writing and trading at roughly $1.7.
Is your portfolio green? Check out the Optimism Profit Calculator
In addition, the Directional Movement Index (DMI) and the Relative Strength Index (RSI) indicated that OP was in a bull trend in a daily timeframe. On the DMI, the plus DI and signal line (green and yellow line) were seen above 20, signifying a bullish trend.
Additionally, the RSI line was seen above 80, which denotes a strong bullish trend for OP. A likely price correction was also signaled by the RSI line, which was in an overbought area.