Osmosis jumps on BTC bandwagon, HODLs 10% as markets turn bullish

- Osmosis Foundation has converted more than 10% of the cash in the treasury into BTC.
- OSMO appears to be well poised for a rally, but more liquidity is needed.
Following its decision to integrate Bitcoin [BTC] into its network for additional security, Osmosis’ co-founder in a tweet on 19 March confirmed that the foundation has converted more than 10% of the cash in treasury into Bitcoin.
.@OsmosisFdn has converted a double digit percent of its "cash" treasury to #Bitcoin
🫡
— Sunny Aggarwal 🧪 (@sunnya97) March 19, 2023
Read Osmosis’ [OSMO] Price Prediction 2023-2024
While the exact amount in the project’s treasury remains unknown, Twitter crypto analyst WuBlockchain opined that “previously, it should mainly consist of OSMO and USDC.”
The co-founder of Osmosis stated that the Osmosis Foundation has converted more than 10% of the cash in the treasury into Bitcoin. Osmosis is the largest dex in the Cosmos ecosystem. Previously, it should mainly consist of OSMO and USDC. The total amount of the treasury amount…
— Wu Blockchain (@WuBlockchain) March 20, 2023
The conversion of some of its treasury’s cash to BTC comes as the king coin exhibits signs of recovery. On a year-to-date, BTC’s value has jumped by 71%, per data from CoinMarketCap. Exchanging hands at $28,223.99 at press time, the leading coin traded at price levels last recorded in June 2022.
Before you trade OSMO
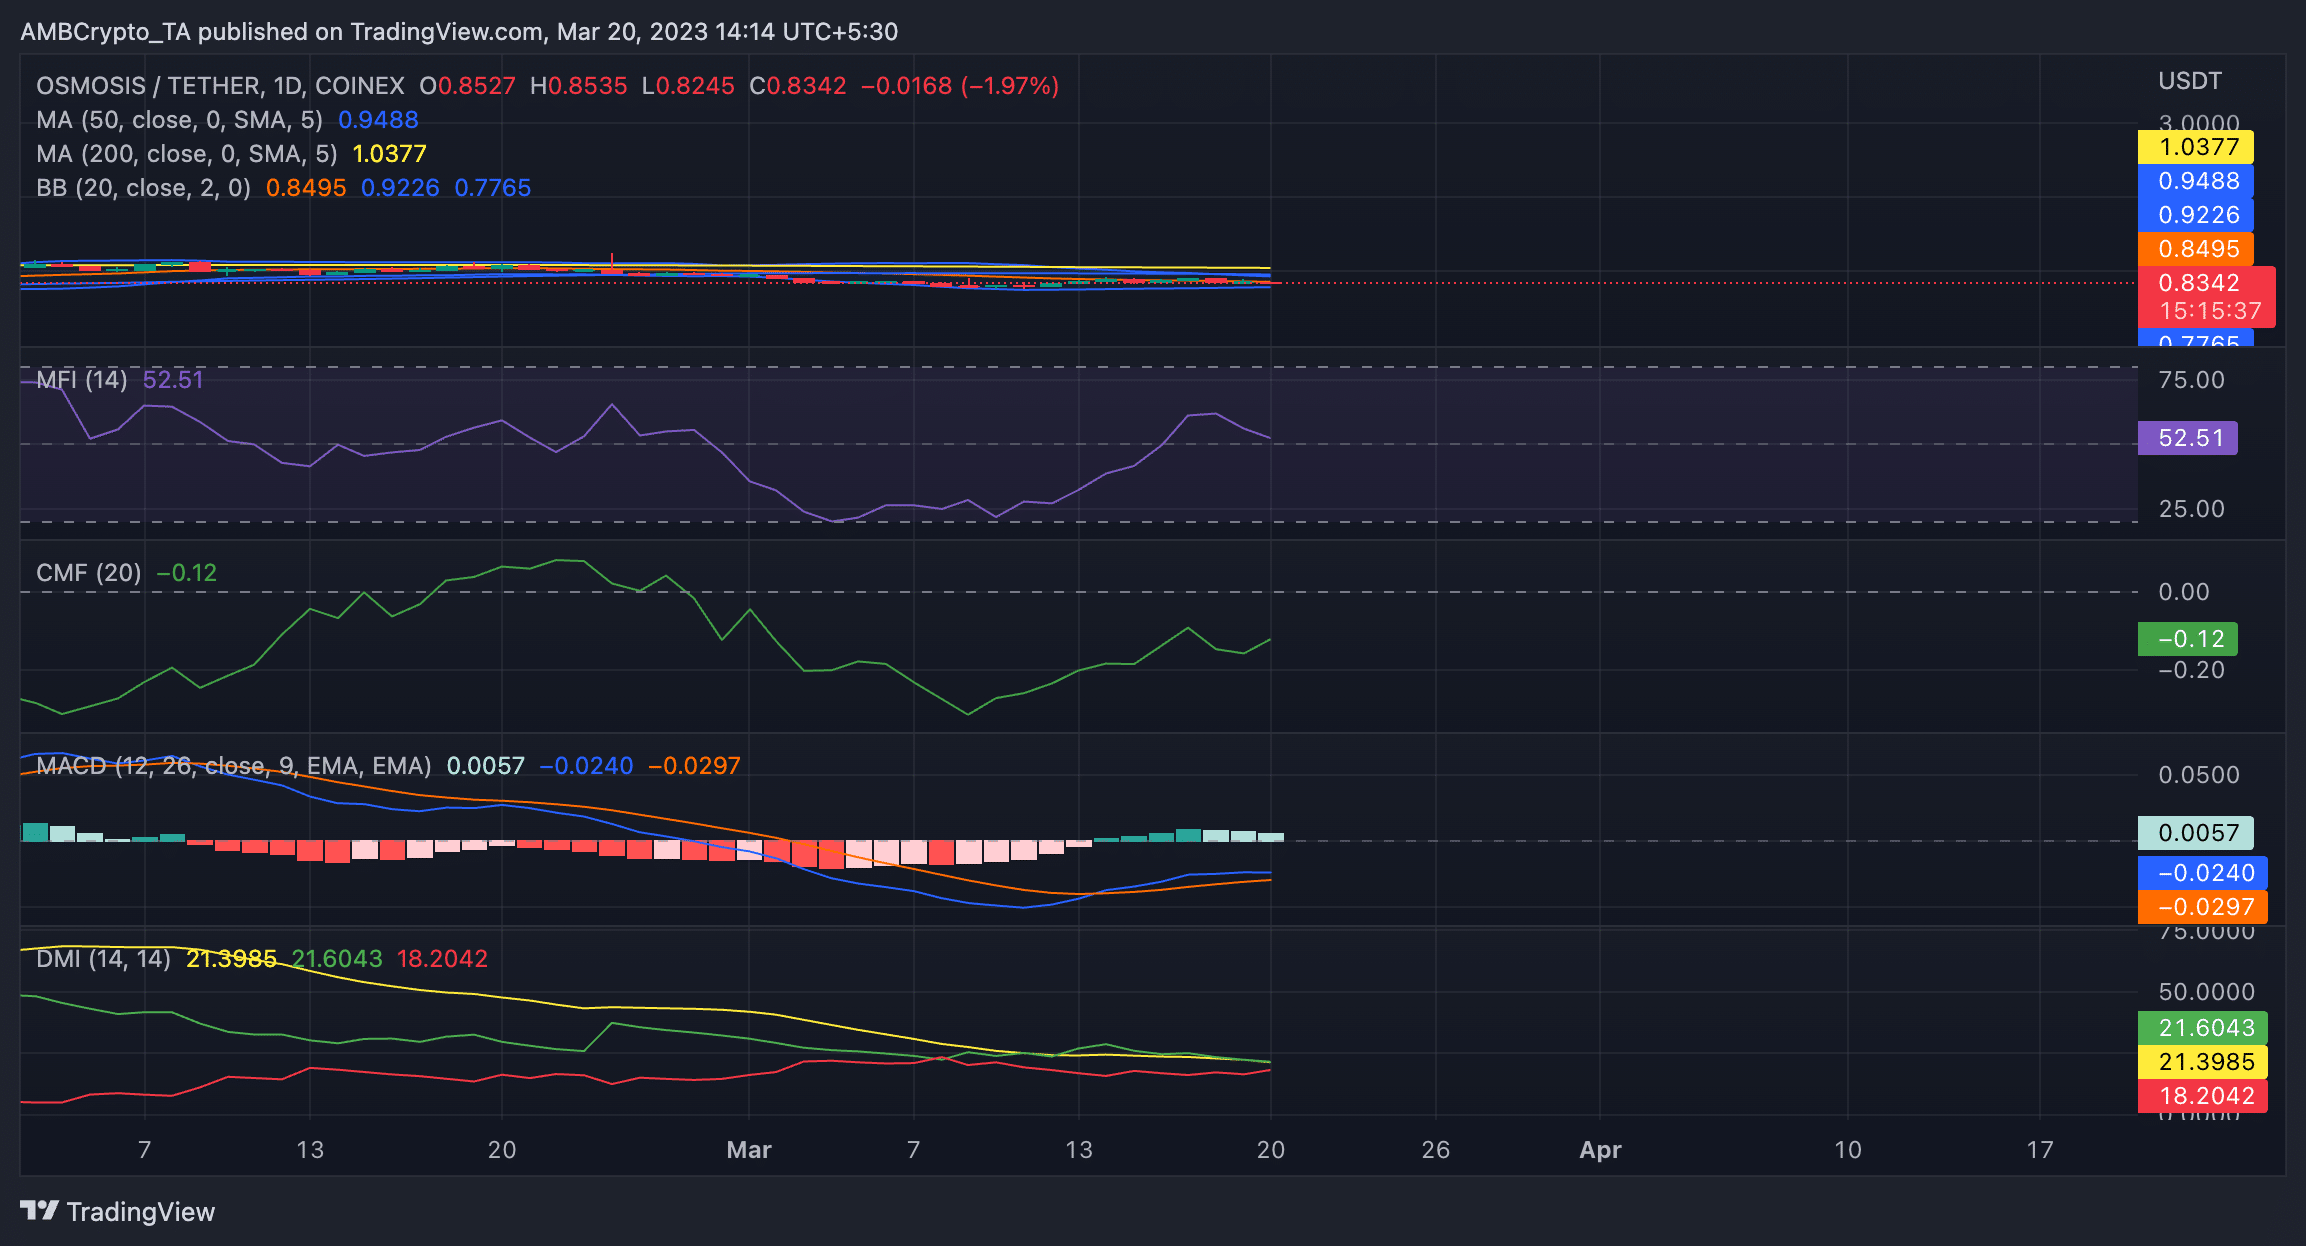
After trading at a high of $11 in March 2022, OSMO’s value has since declined by 92%. At $0.84 at press time, data from CoinMarketCap revealed that the token’s price had oscillated between the $1 and $0.80 price marks in the last month.
On a daily chart, an assessment of the token’s 200 and 50 moving averages revealed the existence of a death cross since December 2022. Since then, OSMO’s 50-day moving average has rested below its 200-day moving average. This is generally considered an indication of a downward trend.
Further, the OSMO’s price traded close to the lower band of the token’s Bollinger Band indicator. While this indicated that the asset was oversold at press time, it hinted at a potential price recovery.
Consideration of the Moving average convergence/divergence (MACD) confirmed this. On 14 March, the MACD line intersected with the trend line in an uptrend, thereby ushering in a new bull cycle.
Further, OSMO’s Money Flow Index (MFI) hinted at growing accumulation at press time. This indicator was pegged at 52.51, above its center line. Buyers’ presence in the OSMO market exceeded that of sellers as the Directional Movement Index (DMI) indicator showed they had control of the market.
Is your portfolio green? Check out the Osmosis Profit Calculator
At press time, buyers’ strength (green) at 21.60 was solidly above that of the sellers (red) at 18.20.
However, attention should be paid to the Chaikin Money Flow (CMF) indicator, which was negative at press time. This showed that, while being in a bull phase, a considerable amount of liquidity still left the OSMO market. Therefore, for any significant price jump, this has to change to a positive.