
- Toncoin showed signs of being overvalued on the charts
- Medium-term holders have been selling the token after the failed breakout past $6
Toncoin [TON], at press time, was down by close to 14% from the high it made in late September – $6.13. That’s not all though as the market structure of the 10th-ranked crypto asset by market cap was bearish on the daily timeframe too.
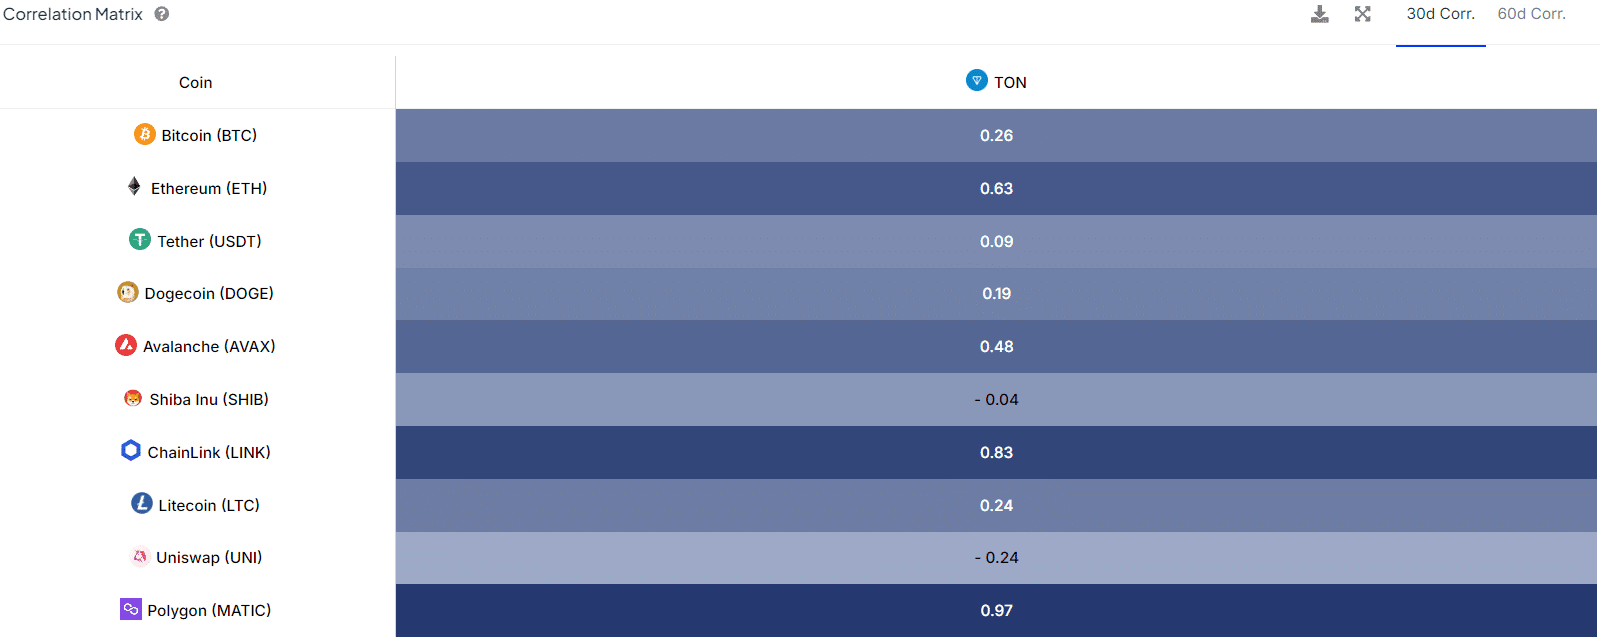
Source: IntoTheBlock
The correlation matrix also highlighted the recent underperformance of Toncoin. For instance – Over the past month, it has had a +0.26 correlation with Bitcoin [BTC], with the latter rallying by 10.5% over the same period.
To assess this further, AMBCrypto investigated other metrics to understand TON’s chances of playing catch-up.
Evidence for accumulation in recent weeks
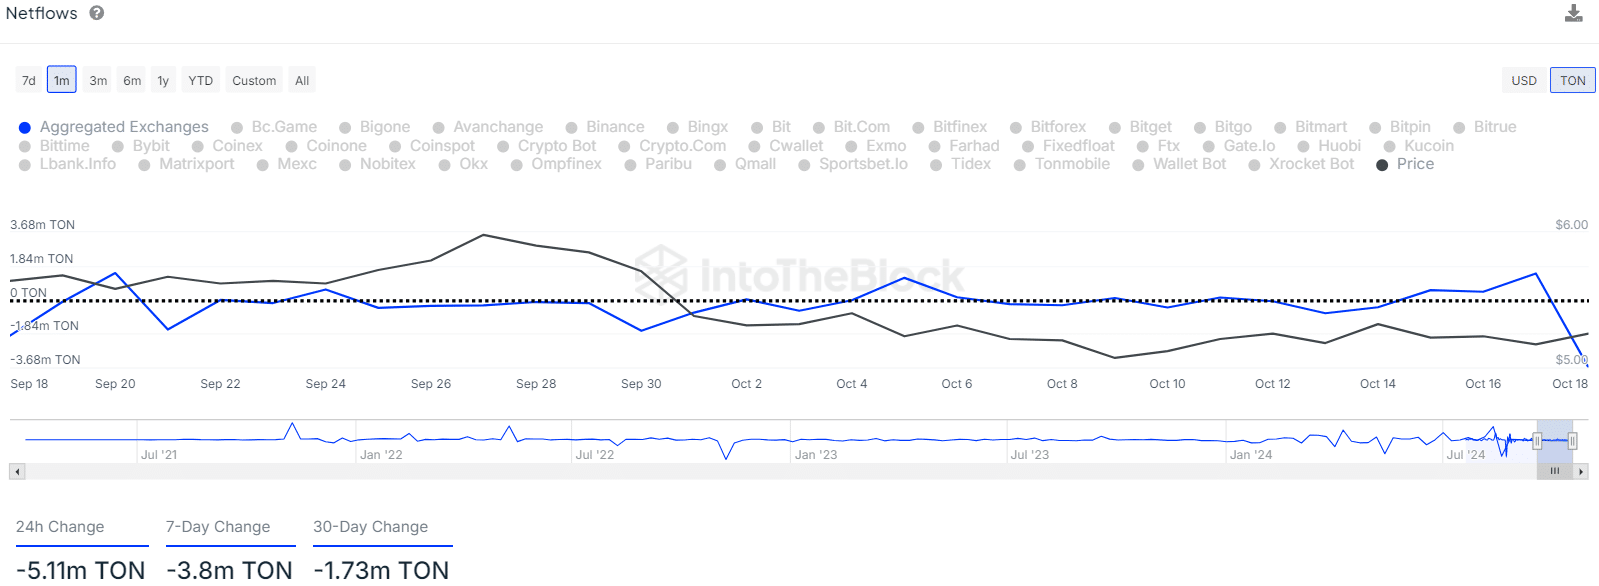
Source: IntoTheBlock
The netflows from exchanges showed that 5.11 million TON were transferred out of exchanges in the last 24 hours. This was a bullish sign as it suggested accumulation. In the past 30 days, the netflows had a figure of -1.73 million TON.
Simply put, the past 24 hours’ trend hasn’t been the same as the trend seen over the month. Some selling pressure and token inflows were spotted earlier this week too.
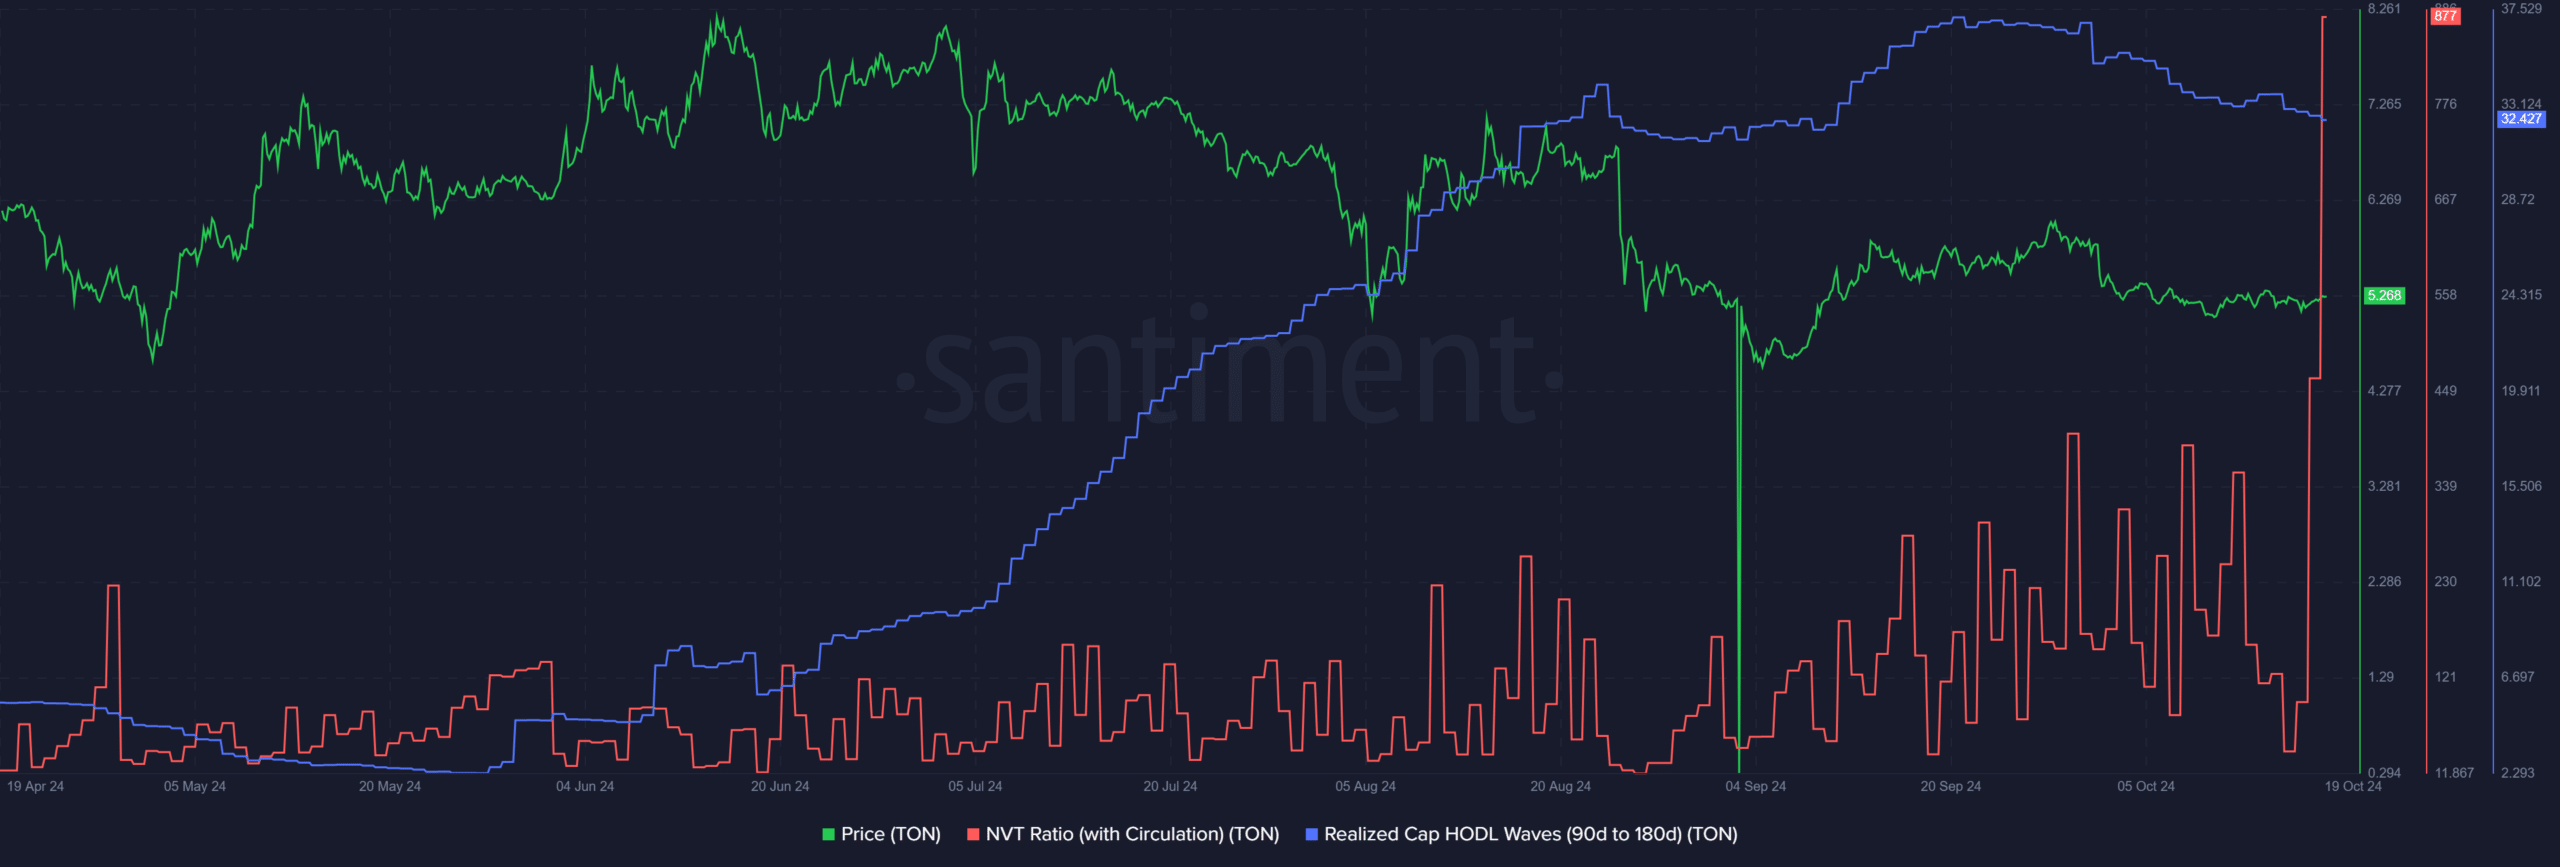
Source: Santiment
The Network Value to Transaction (NVT) Ratio, calculated using the daily circulation, has trended higher since September too. The high NVT meant that the market cap of the asset was high compared to the tokens transacted – A sign that the asset may be likely overvalued.
The realized cap HODL waves (90-180 days) began to fall over the last three weeks too. This implied that coins held for 90-180 days were spent or moved – A signal of distribution. This could affect the chances of a rally on the charts.
Price action clues for traders and investors
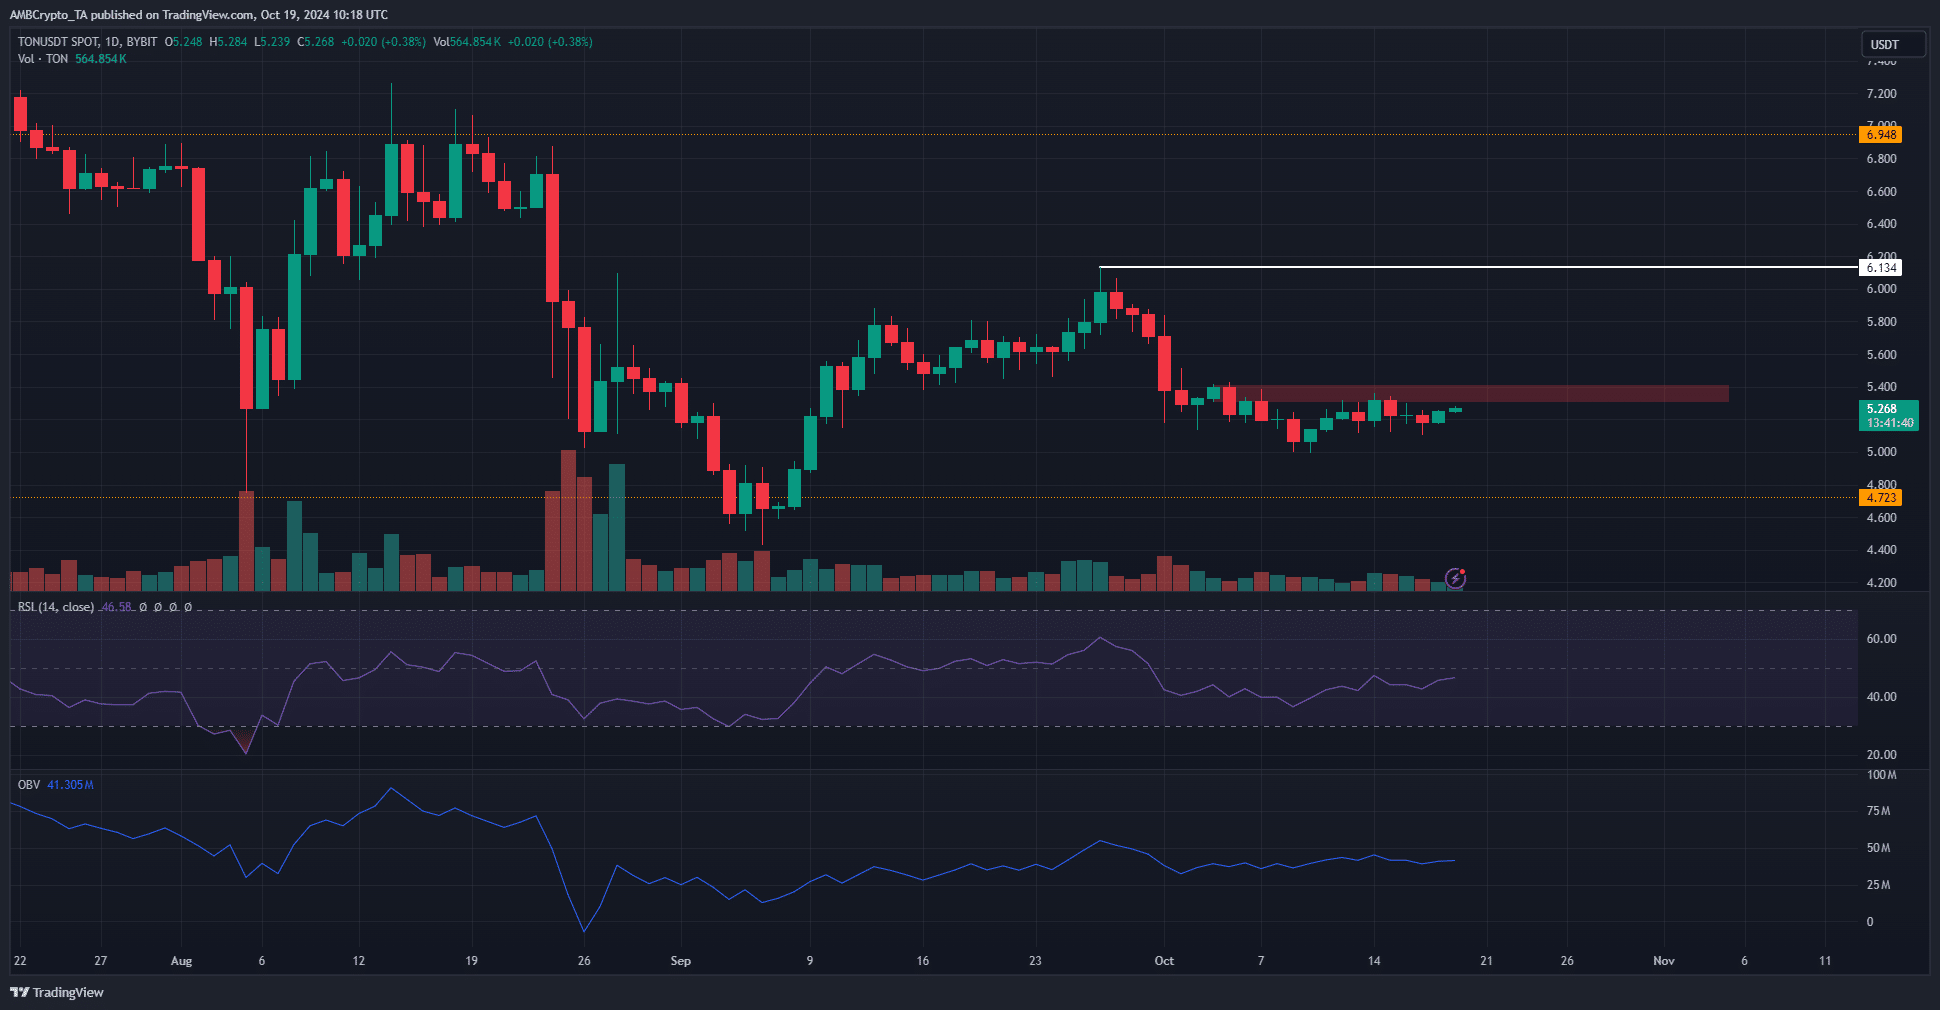
Source: TON/USDT on TradingView
Both the HODL waves data and rising NVT had bearish on-chain findings. The daily price chart also had a bearish outlook. The latest significant high was at $6.13, which TON needs to surpass to establish a new uptrend.
Read Toncoin’s [TON] Price Prediction 2024-25
The OBV and the RSI indicated lackluster demand and neutral momentum, respectively.
With a resistance zone overhead at $5.4 from the bearish order block, TON bulls need to band together and attack or risk being left behind while BTC rallies.