PancakeSwap, Solana, Stellar Lumens Price Analysis: 20 May

Bitcoin continued to trade sideways without much of a trend on lower timeframes, and the altcoin market also followed suit. Solana dropped toward the $50 mark once more, while PancakeSwap traded within a range between $4.36 and $4.78 in the past few days. Stellar Lumens saw some demand at the $0.124 support level, but it was unclear whether the buyers had more ammunition in store.
PancakeSwap (CAKE)
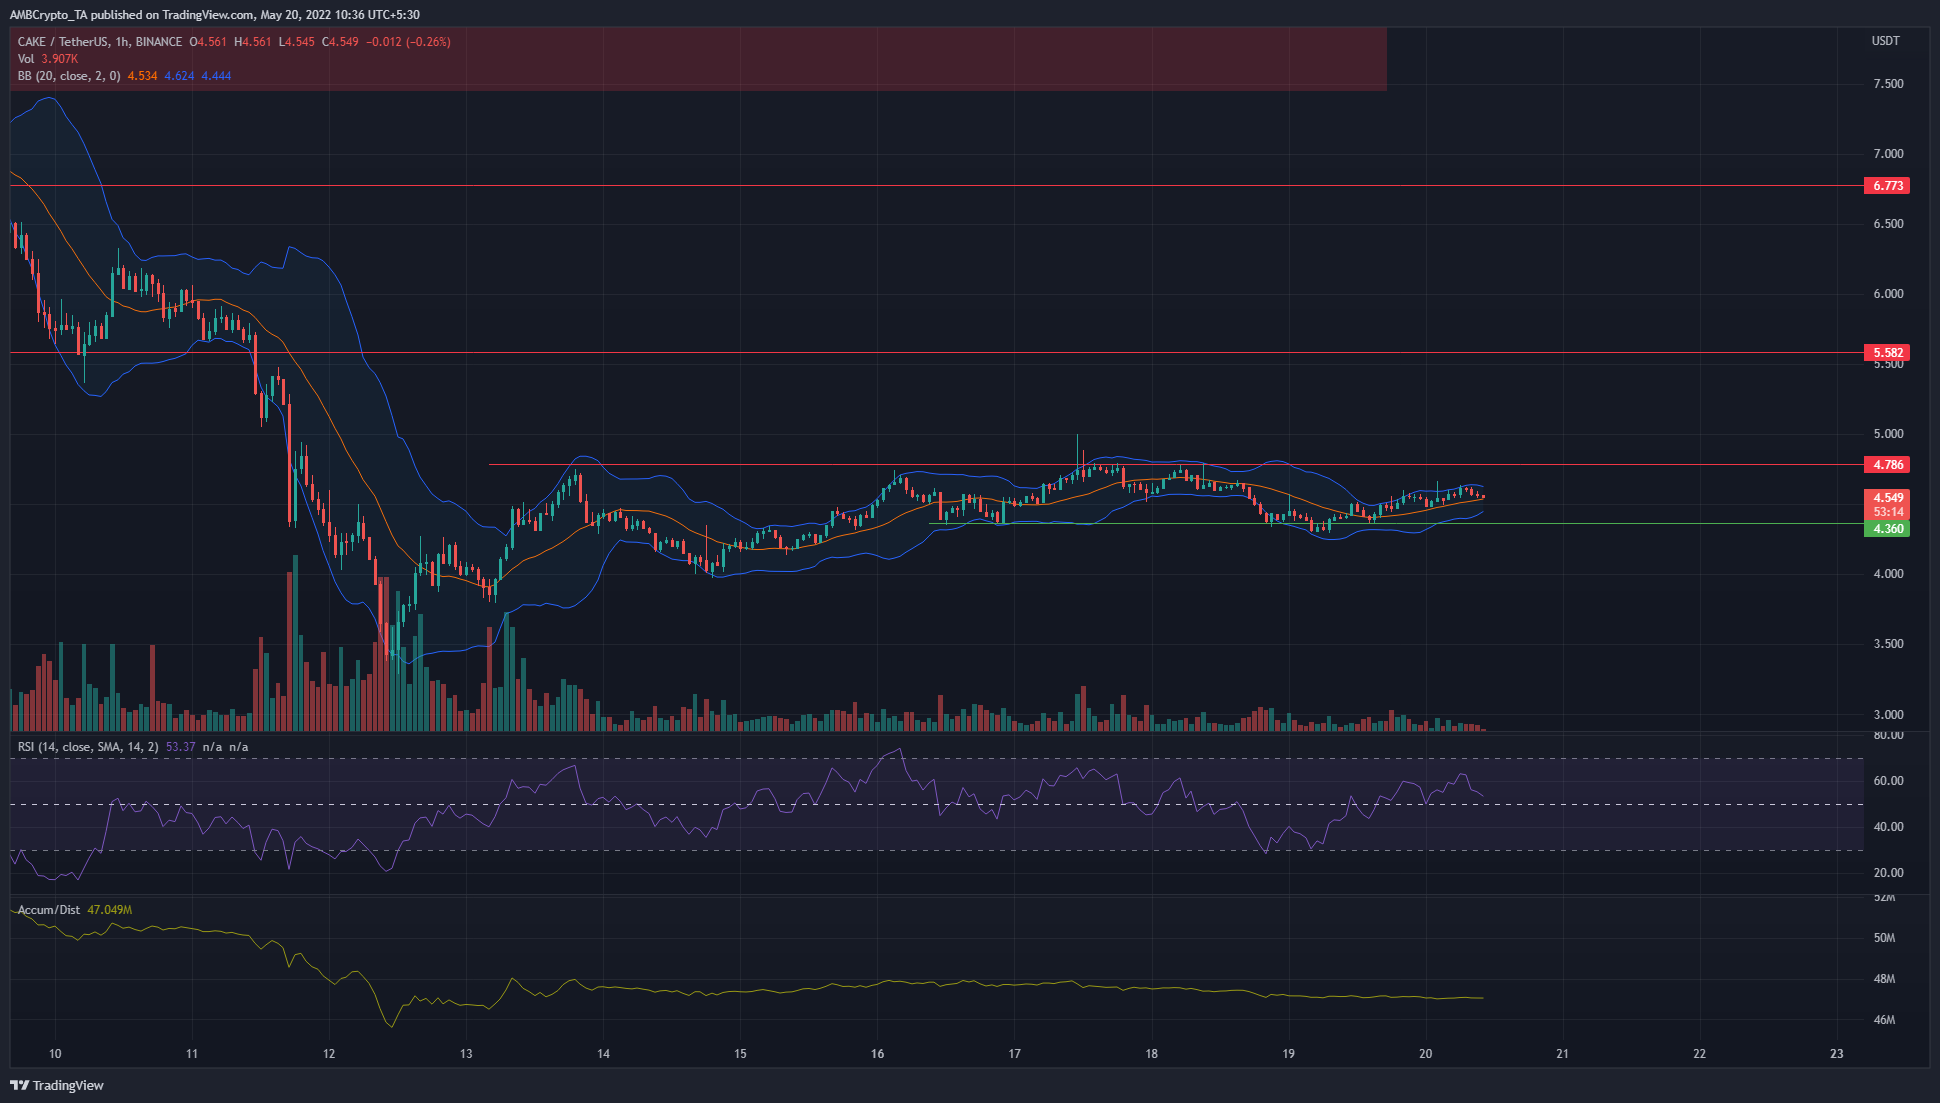
The Bollinger bands were quite close to the price, which indicated that volatility has been quite low in the past few days on the lower timeframes such as the hourly and two-hour charts. The price has some support at the $4.36 level and resistance at the $4.786 mark. In the next couple of days, these are the two levels that need to be closely watched. A flip of either one to resistance or support, and a successful retest, could give some idea of the direction of the next move for CAKE.
The RSI was above the neutral 50 level to suggest some bullish momentum. Yet, the A/D has not seen a spike upwards. In fact, it appeared to slip steadily lower, which indicated sellers continued to outweigh the buyers.
Solana (SOL)
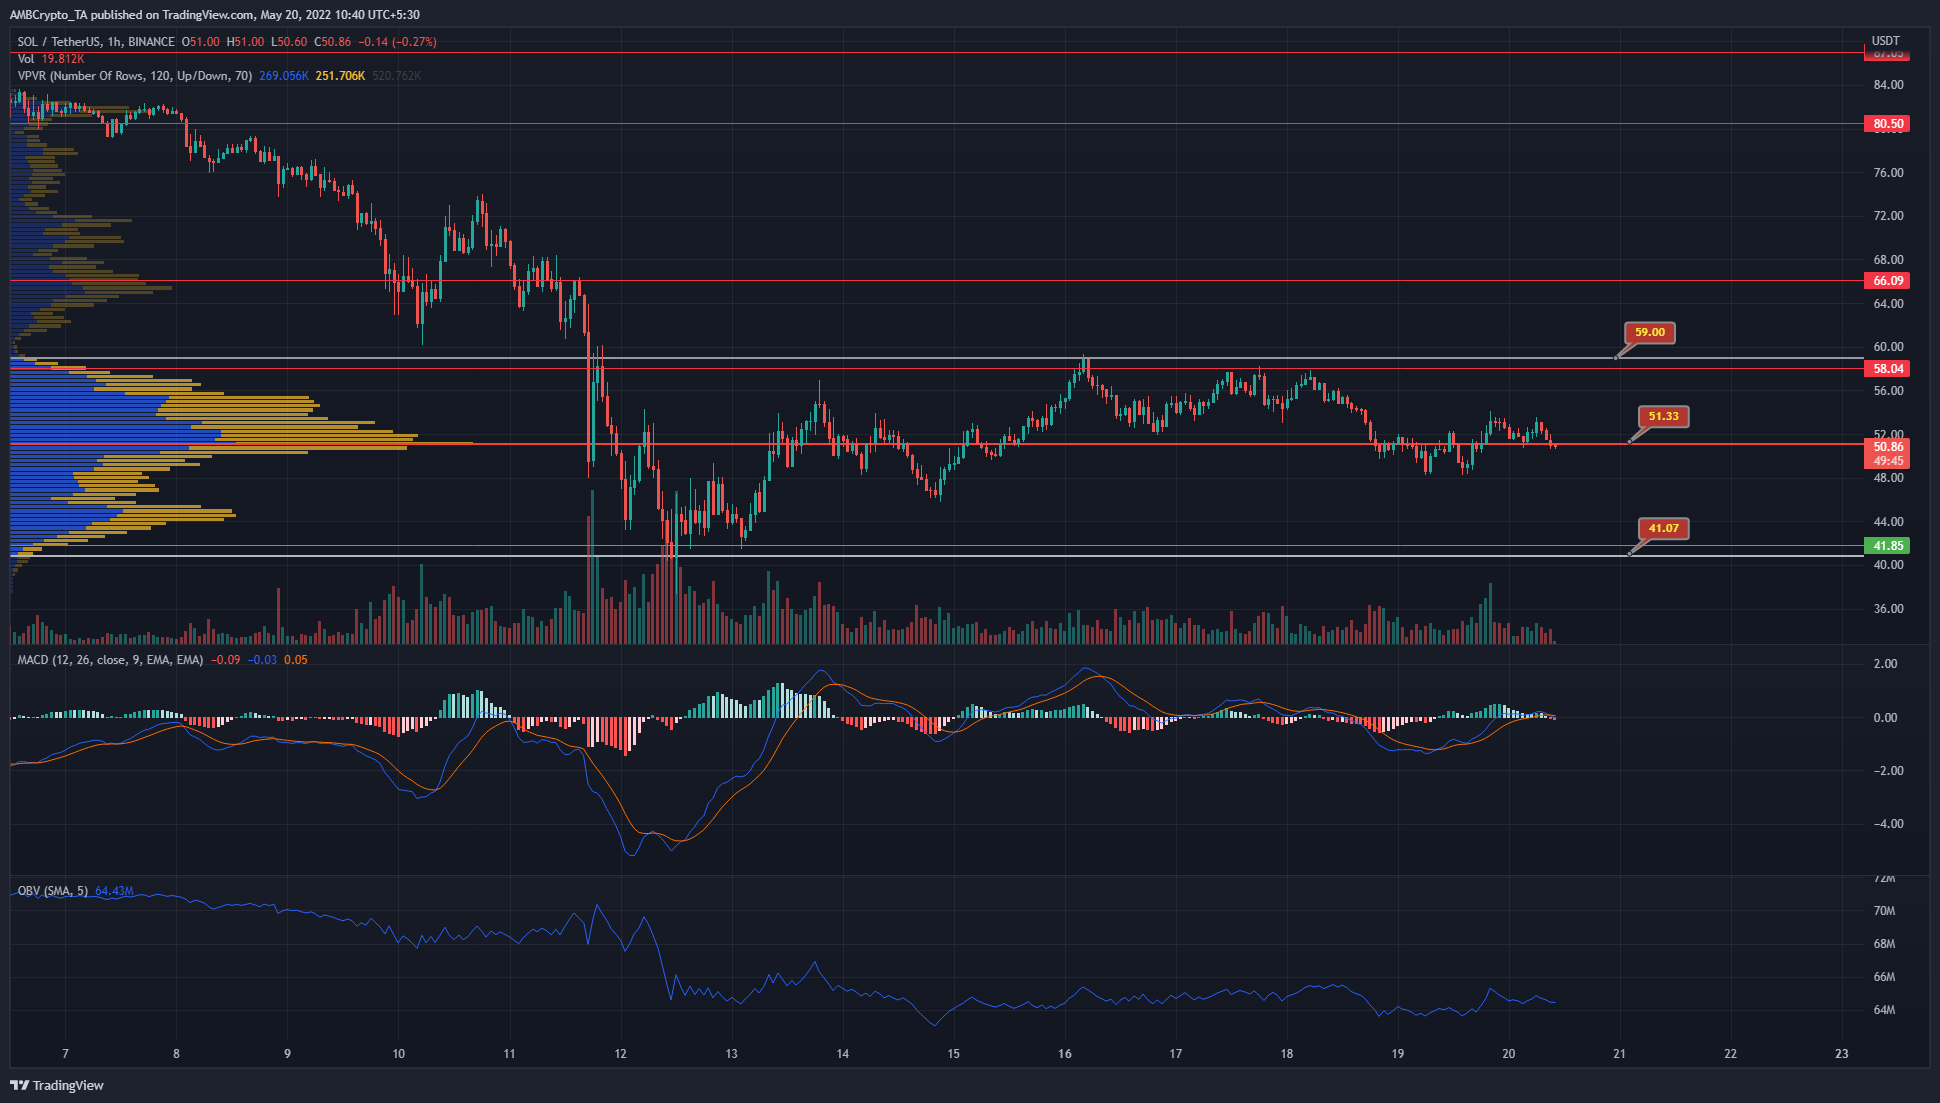
The Visible Range Volume Profile showed the Point of Control to lie at $51.33, and the Value Area Highs and Lows at $59 and $41.07 respectively. The $50-$52 area has seen heavy trading volume in the past week.
At press time, the price was at $50.86, and the MACD was at the zero line. The momentum has not favored either side in the past few days. On the OBV as well, both buying and selling volume appeared to be equal in the past week, as SOL oscillated from $48 to $58 and back.
Stellar Lumens (XLM)
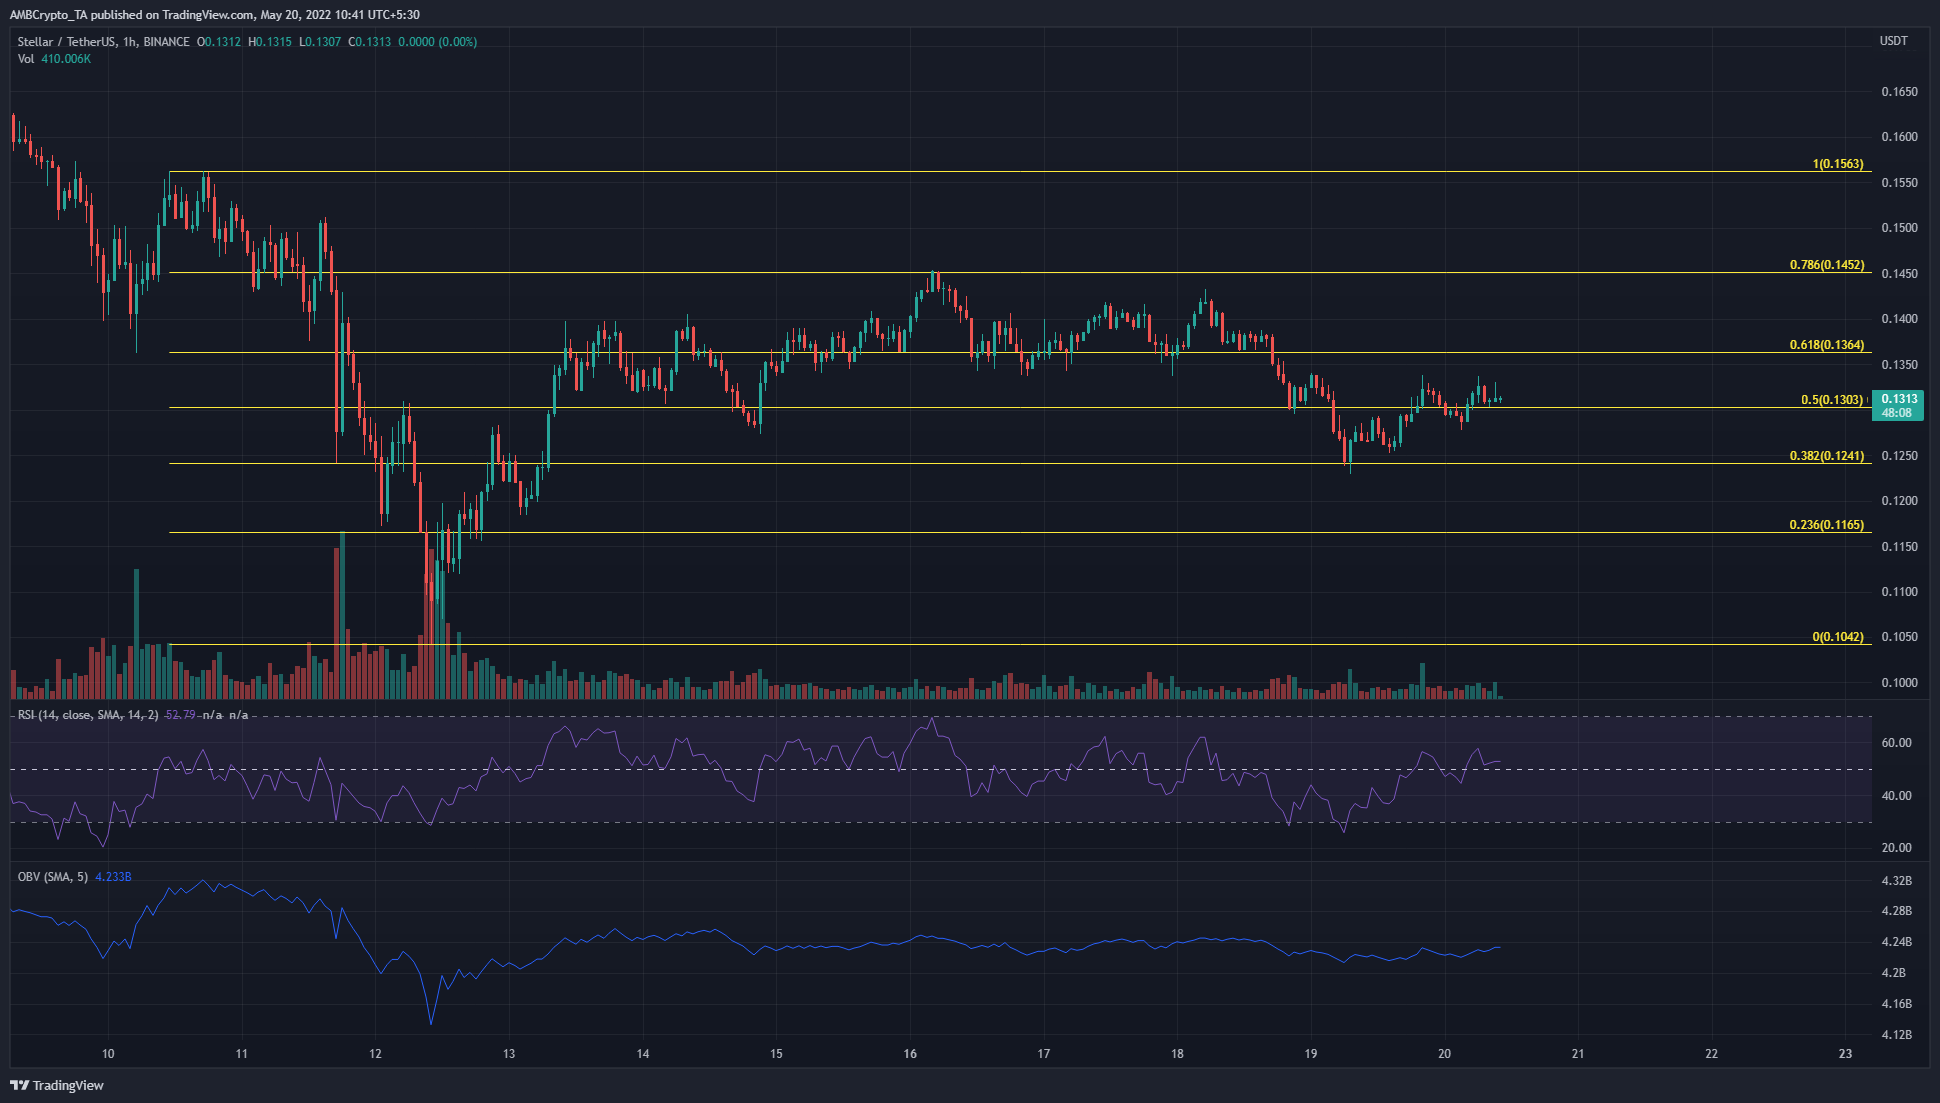
The Fibonacci retracement levels (yellow) showed levels of support and resistance for XLM in the past week. The bulls were unable to push prices past the $0.145 mark, and moreover, the $0.124 level was tested as support. The short-term market structure was flipped to bearish when the price dropped below the lows at $0.134 and retested it as resistance the previous day.
The RSI hovered above neutral 50, while the OBV was also relatively flat. Hence, waiting for a strong trend could be a good decision for lower timeframe traders.