PENDLE soars 355% YTD: ATH in sight if THIS happens
Pendle climbs 355% YTD with TVL at $3.392B. Will the December monthly candle break the all-time high?
- Pendle’s TVL stood at $3.392 billion, highlighting renewed market confidence.
- If the price closes above $6.3, the coin could challenge its December all-time high of $7.52.
Pendle [PENDLE] began the year with significant gains, peaking in April with a 600% increase. The price then retraced over the following months to the 75% Fibonacci retracement level before recovering in August.
Pendle was trading at $5.3 at press time, reflecting a 355% gain year-to-date.
Pendle is experiencing significant growth, revolutionizing yield optimization by tokenizing future yields and maximizing returns.
With a potential bullish monthly candle close above $6.3, the price could challenge its all-time high of $7.52 in December.
Pendle’s TVL continues uptrend
The coin’s TVL steadily climbed from February, surpassing $6 billion in June, indicating robust growth and strong user adoption.
However, a sharp decline followed in July, reducing the TVL to nearly $3 billion, reflecting possible market corrections or liquidity outflows.
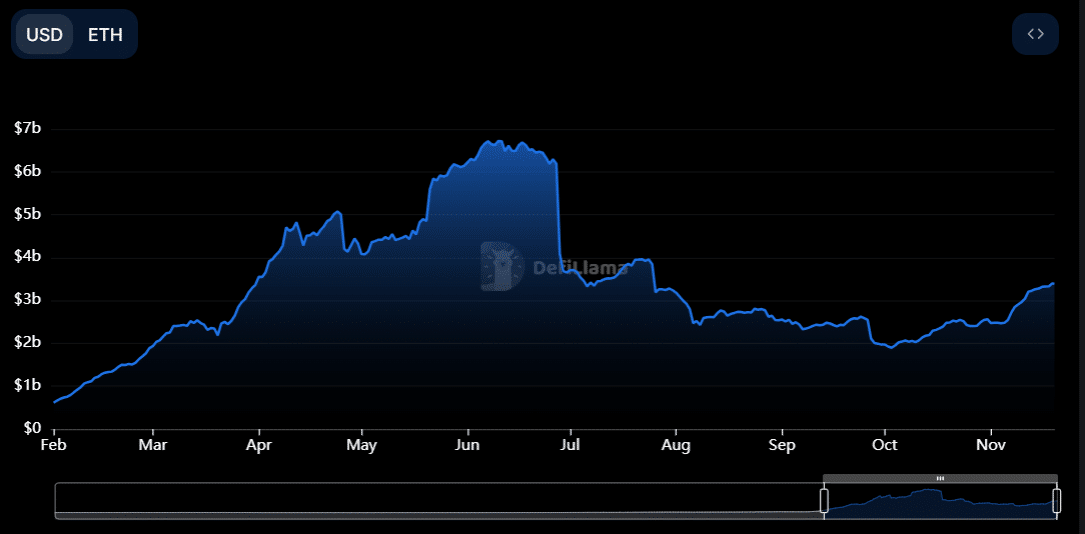
From August onwards, the TVL showed resilience, stabilizing around $3 billion before gradually recovering in October and November.
At the time of writing, Pendle’s TVL stood at $3.392 billion, highlighting renewed market confidence and increased participation in its ecosystem.
Price ignites fresh optimism
PENDLE’s four-hour chart showed price action consolidating above a strong support level at $5.00. A breakout could see a price target of $7.00, reflecting a 39.73% upside if the bullish momentum continues.
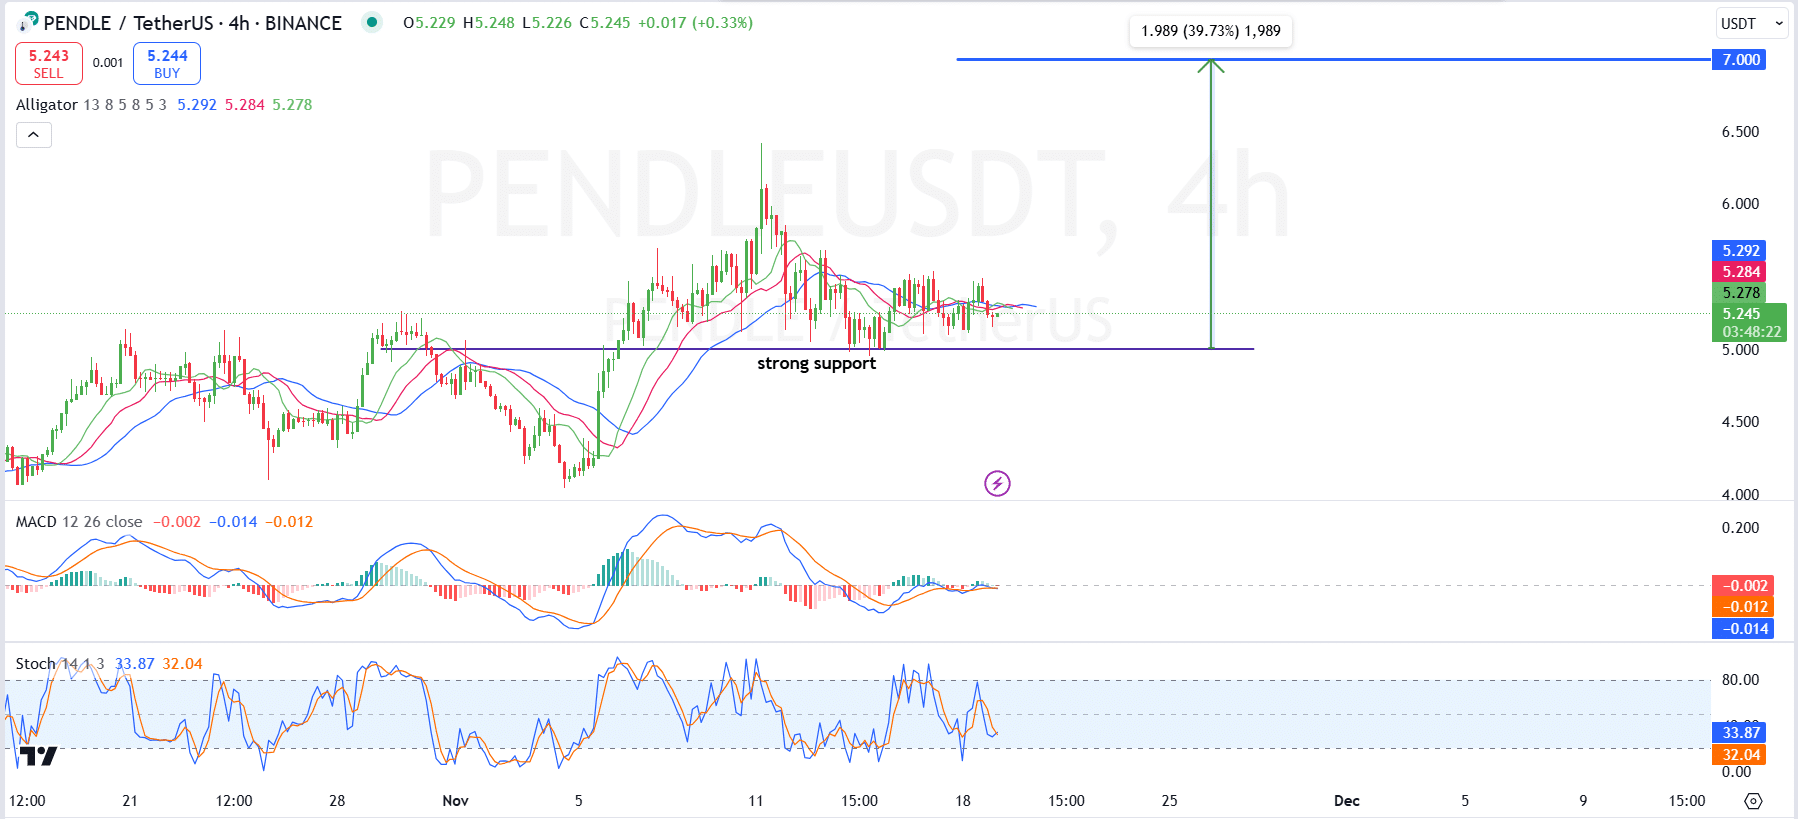
The price action remained range-bound, with the Alligator lines converging, signaling a lack of clear directional momentum for now.
Furthermore, the MACD was slightly bearish, with the lines below the signal line, reflecting weak momentum.
However, the histogram showed declining bearish pressure, suggesting a possible reversal. Meanwhile, the stochastic RSI was near the oversold region at 33.87, indicating the price may be poised for a bounce.
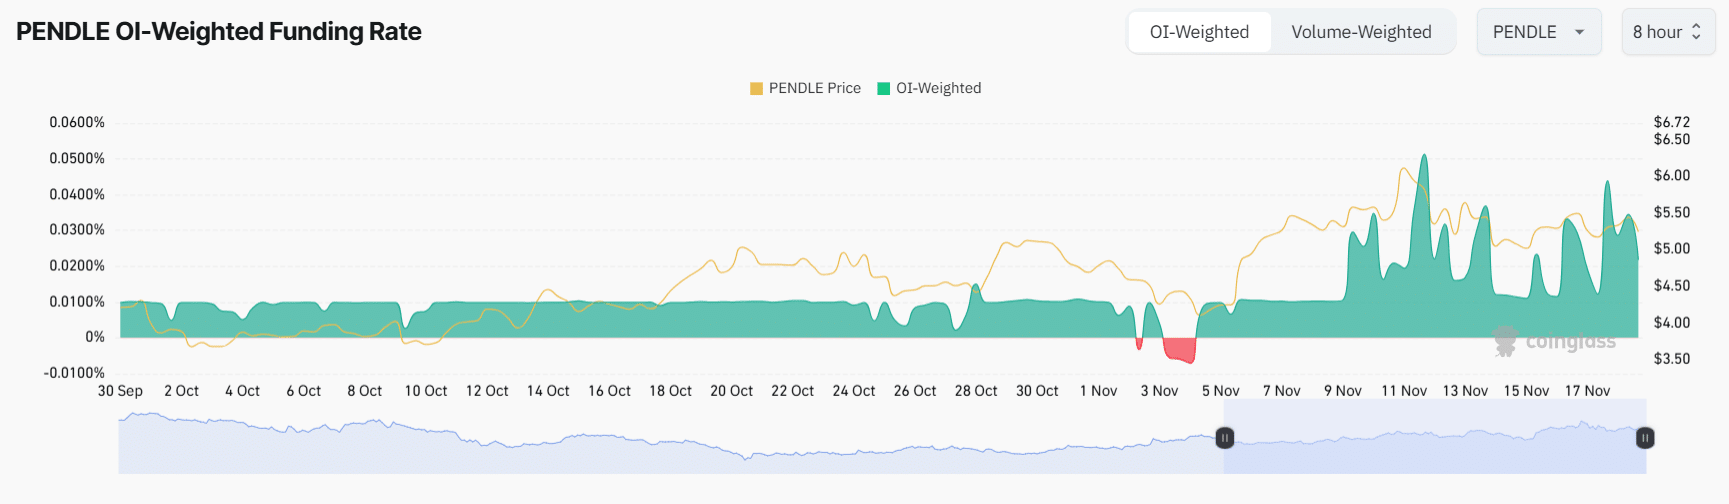
Pendle rebounds following funding rate shift
The chart illustrates the relationship between Pendle’s price (yellow line) and the Open Interest-Weighted Funding Rate (green area) over time.
Read Pendle’s [PENDLE] Price Prediction 2024-2025
In early November, the Funding Rate briefly turned negative, coinciding with a small price dip, indicating short-term bearish sentiment.
However, as the Funding Rate stabilized and turned positive, Pendle regained momentum, reflecting renewed confidence.


