
- PEPE saw its OBV fall below a recent low.
- On-chain activity faltered alongside the price decline.
Pepe [PEPE], the meme coin, saw losses worth 26.5% in the past four days. It came alongside a Bitcoin [BTC] pullback from $71.3k to $65.5k at press time.
More losses could follow, based on the technical indicators of PEPE.
Before the price drop, an AMBCrypto report noted a huge Pepe movement on-chain. Since then, the selling pressure has been persistent.
The buyers need to arrest the short-term losses- but at press time, they lacked the strength to do so.
The bullish structure remained intact…for now
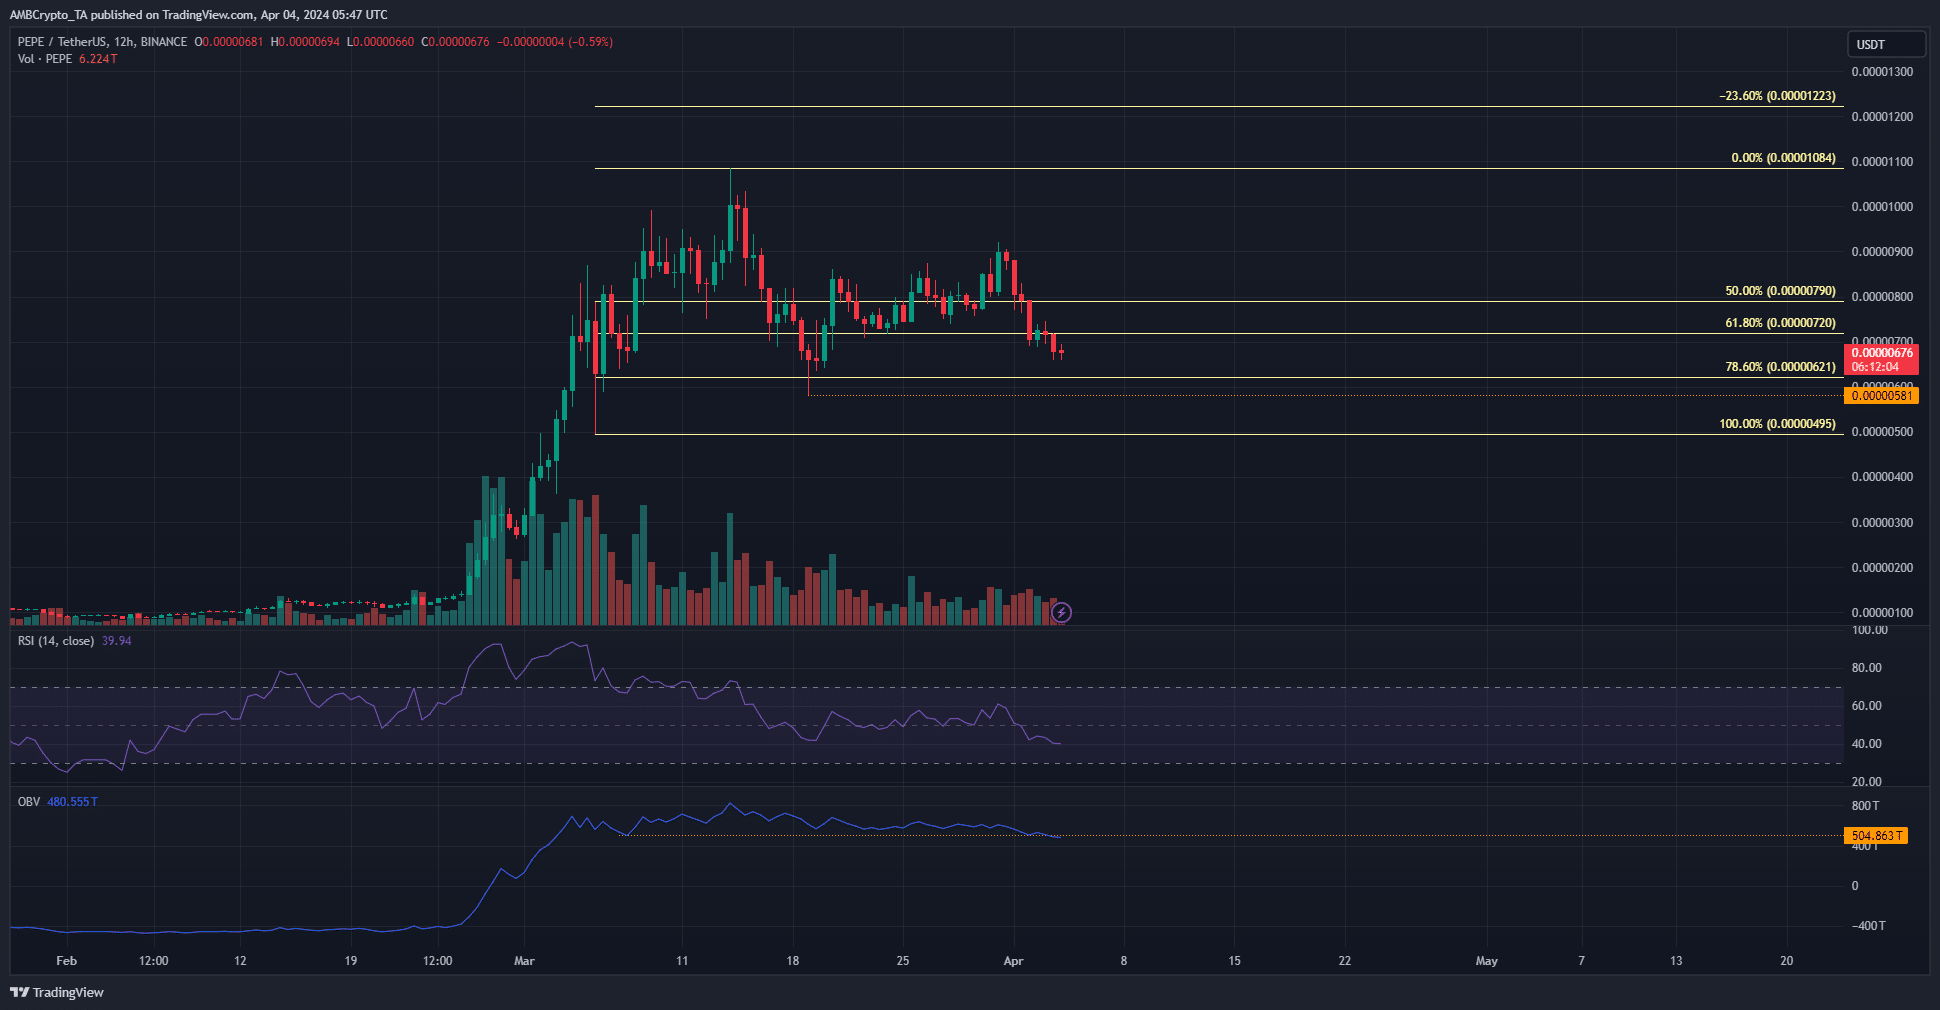
Source: PEPE/USDT on TradingView
In the 12-hour timeframe, the RSI slipped below neutral 50 to signal bearish momentum was taking hold. To complement this, the OBV also fell below a low it formed during the rally in March.
This indicated that selling volume had the upper hand at press time, and we are likely to see further losses.
The trading volume has trended downward in recent weeks. Since the recent losses were not accompanied by a surge in volume, it suggested that the current drop was more of a dip than the beginning of a downtrend.
The price action showed the key swing low at $0.00000581 on the H12 chart. If PEPE drops below this level, the market structure will shift bearishly.
Bulls need to defend this level to keep alive the hopes of continuing the uptrend from the first half of March.
The active addresses count has dropped enormously
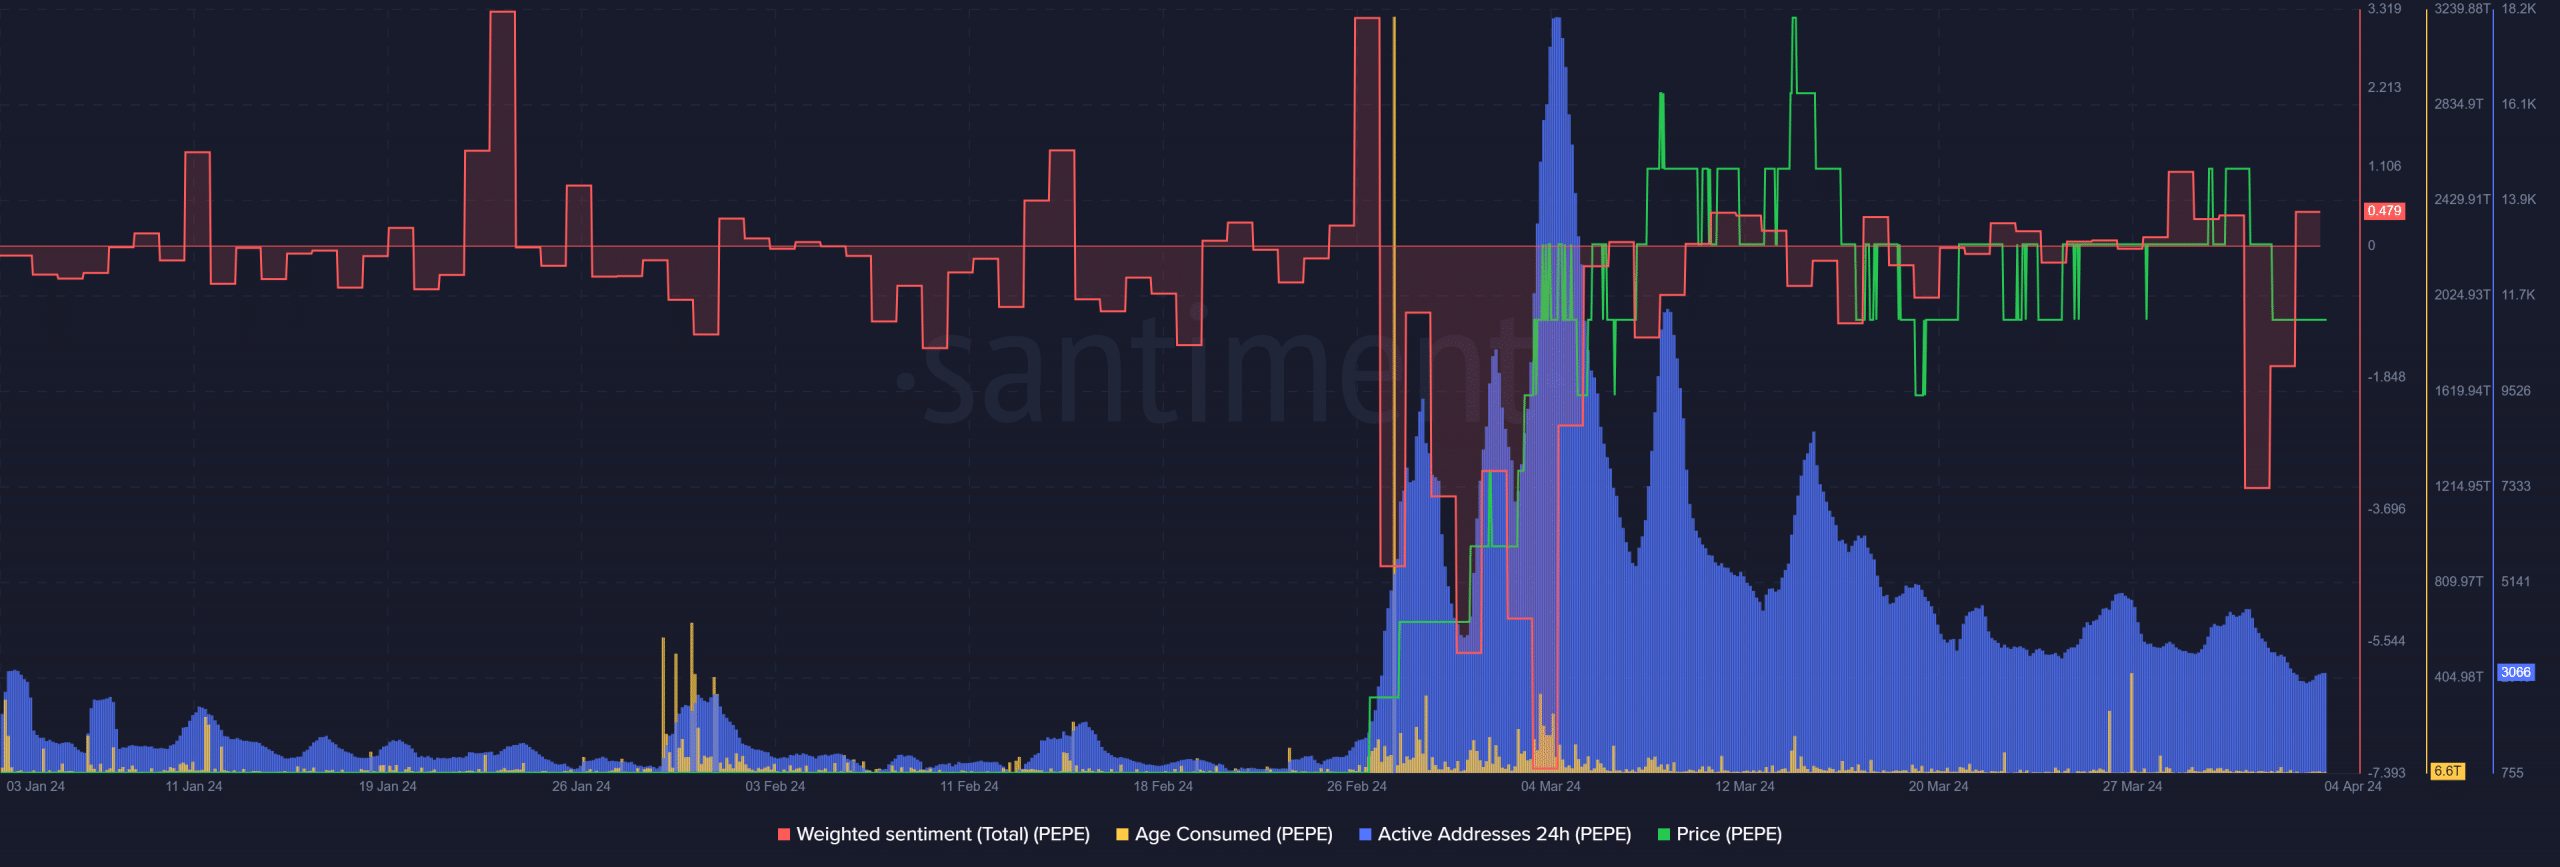
Source: Santiment
The Weighted Sentiment behind PEPE dropped quite low last week just as PEPE began its short-term downtrend.
The age-consumed metric saw large spikes on the 26th and 27th of March, which rivaled the early February ones.
Is your portfolio green? Check out the PEPE Profit Calculator
This surge was likely an early sign of a wave of selling. Spikes in this metric outline previously dormant PEPE tokens being moved around, likely for selling purposes.
The daily active addresses have fallen dramatically from the recent highs. While it was still above January and February highs, it represented a massive decline in crowd participation.
Disclaimer: The information presented does not constitute financial, investment, trading, or other types of advice and is solely the writer’s opinion.