Can PEPE continue its 100% rally from last week

Disclaimer: The information presented does not constitute financial, investment, trading, or other types of advice and is solely the writer’s opinion.
- The strong rally of PEPE was interrupted by a pullback and the structure flipped bearish.
- The retracement can go a little deeper but the previous impulse move upward can likely continue.
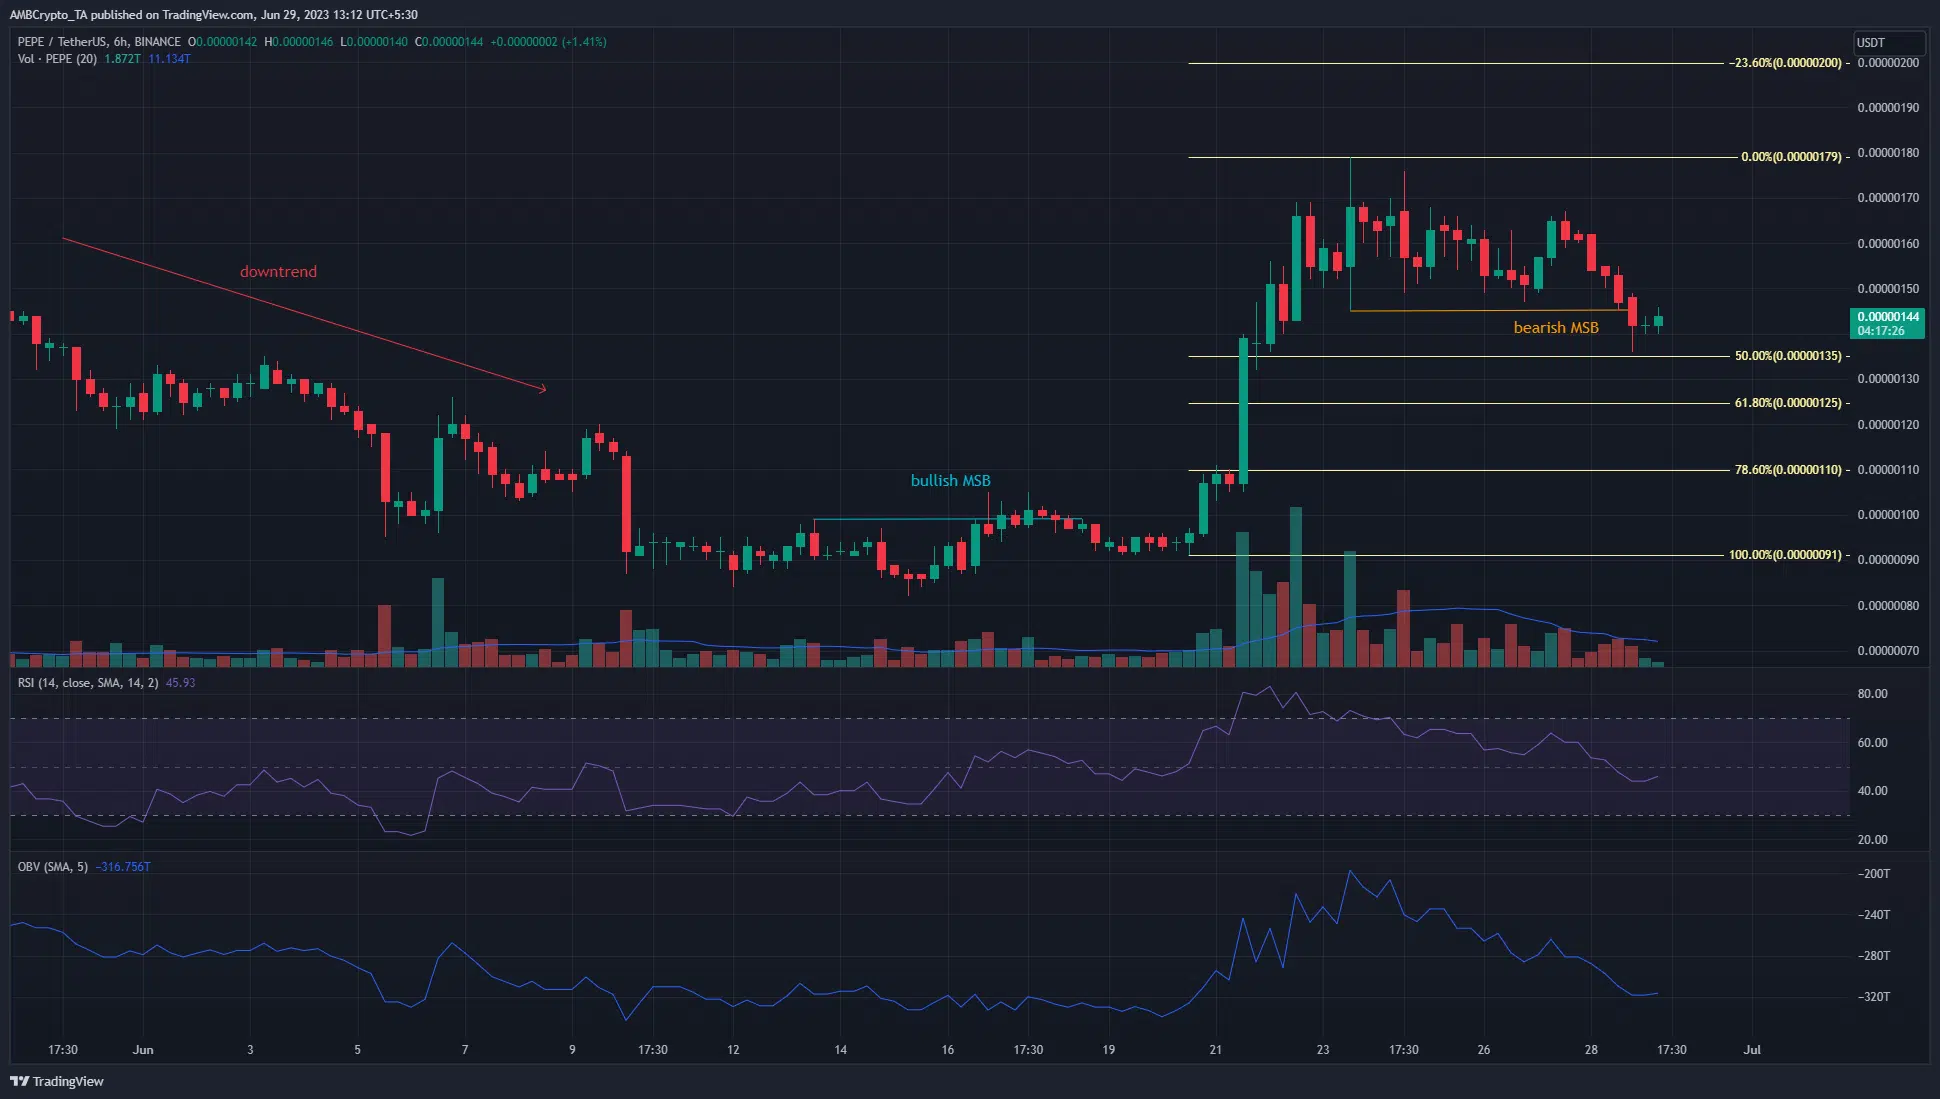
From mid-May to mid-June, PEPE prices saw a downtrend. Around 10 June, the prices began to consolidate within a range formation. But in the past ten days, the bulls made a resounding comeback.
Realistic or not, here’s PEPE’s market cap in BTC terms
They drove a rally that measured 96.7% after the bullish structure break. Yet, the trading volume has begun to decrease in recent days. This sparked concerns about a decrease in demand and capital flow out of the market.
The price action of PEPE showed bears had the upper hand once again
The bullish market structure break on the 6-hour chart was shown in cyan. It occurred on 16 June, and was followed by the near 100% rally. In the past three days, the bullish momentum of PEPE began to slow down.
The RSI fell below neutral 50 on 28 June, and on the same day the prices fell below the recent higher low at $0.00000145. Highlighted in orange, this represented a shift in market structure back toward a bearish bias.
The rally last week was used to plot a set of Fibonacci retracement levels. They showed that the 50% and 61.8% levels were likely support levels where PEPE bulls can look to force a reversal. However, the OBV has retraced almost all of its gains from 20 June, showing intense selling pressure in the market.
The MVRV ratio hinted at increased profit-taking from holders

Source: Santiment
The weighted sentiment remained in negative territory. Meanwhile, the age consumed metric saw a few sharp spikes in the past few days. It was accompanied by a fall in PEPE prices, suggesting increased token movement in the form of selling pressure.
How much are 1, 10, or 100 PEPE worth today?
The MVRV ratio was positive but headed lower. This showed that short-term holders who were at a profit were realizing their gains, adding to the sell pressure behind the meme coin. Overall, the price action and sentiment of PEPE favored the bears. The Fib retracement levels can be of interest to traders as a reversal from these levels was possible.


