News
PEPE – Is a ‘buy the dip’ opportunity on the cards for the memecoin?
Memecoins are slowly all the rage again, and PEPE may be leading the race.
- PEPE could soar by 20% to hit the $0.0000132 level if it closes a daily candle above $0.0000111
- On-chain metrics, together with technical analysis, suggested that bulls have been dominating the asset
After a decent price correction, the broader cryptocurrency market started recovering on the charts. Amid this, the popular memecoin PEPE formed a bullish price action pattern on its daily chart.
In light of the price recovery and the aforementioned bullish pattern, one expert is suggesting there may be a buy-the-dip opportunity here.
Expert hints at buy the dip opportunity
According to InvestingHeaven’s latest post on X (Previously Twitter), PEPE’s price is now approaching a “buy the dip” level as it nears the 50% Fibonacci retracement. Based on the success rate, traders and investors often use the 50% retracement when building long positions or going long on an asset.
PEPE technical analysis and key levels
According to AMBCrypto’s technical analysis, PEPE is currently forming a symmetrical triangle price action pattern following its breakout from the descending trendline.
However, PEPE reached a very narrow zone within the pattern, and there is a strong possibility of a breakout on either side soon.
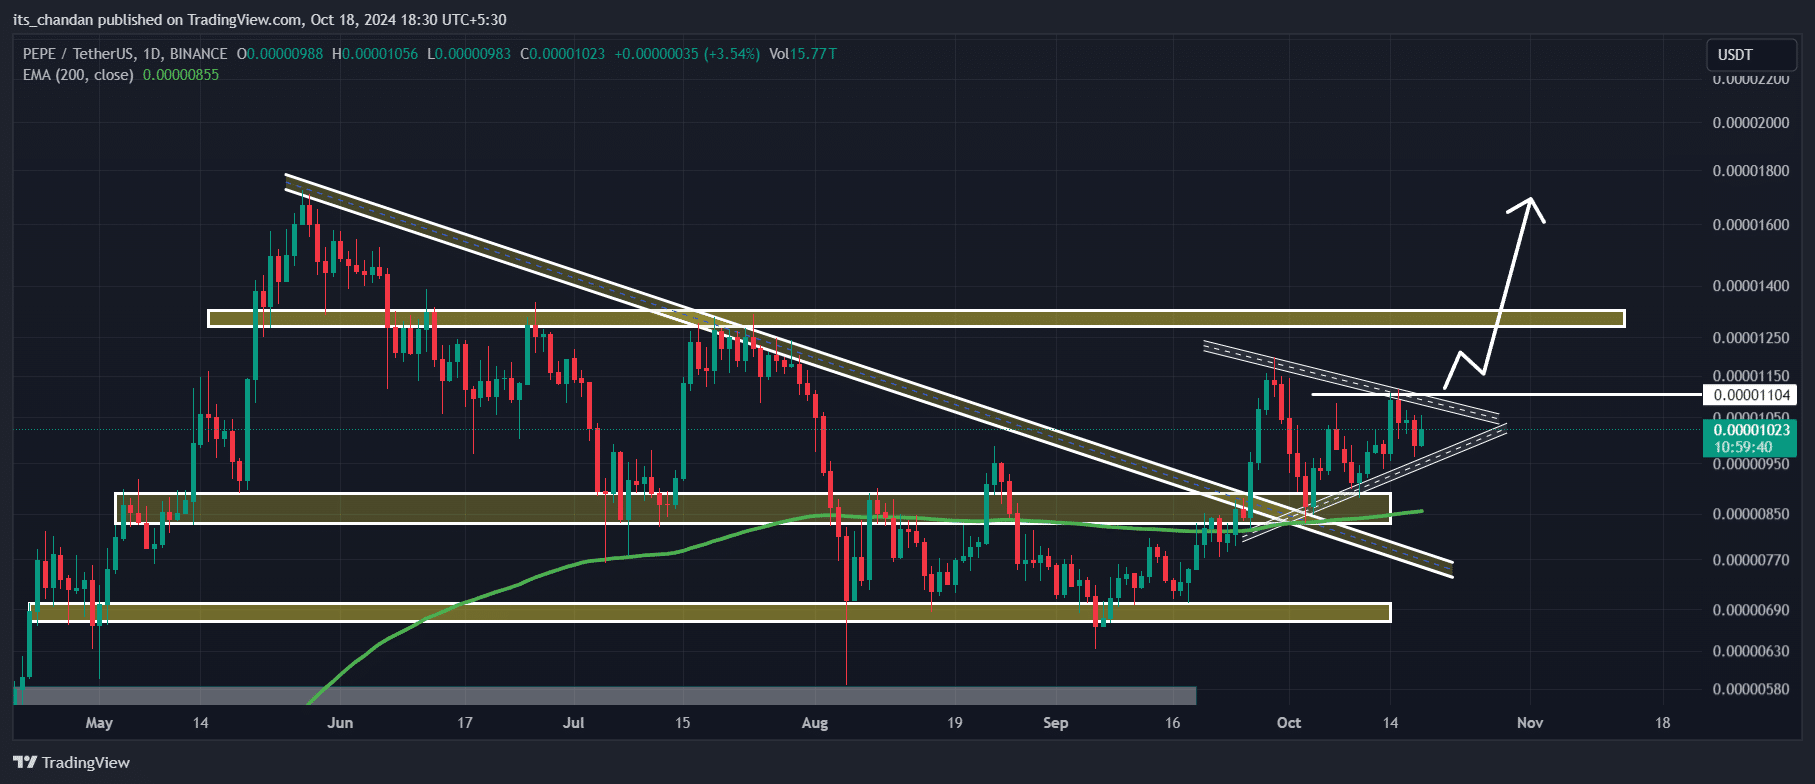
Source: TradingView
Based on the prevailing market sentiment, PEPE may be poised for an upside breakout. If this occurs and PEPE closes a daily candle above the $0.0000111 level, there is a strong possibility it could soar by 20% to hit the $0.0000132 level in the coming days.
Here, it’s worth pointing out that PEPE’s Relative Strength Index (RSI) and 200-day Exponential Moving Average (EMA) hinted at a potential upside rally.
Bullish on-chain metrics
PEPE’s positive outlook can be further supported by on-chain metrics, as trader sentiment seemed quite bullish for the memecoin. According to the on-chain analytics firm Coinglass, PEPE’s Long/Short ratio, at press time, had a value of 1.039. a value above 1 indicates strong bullish sentiment among traders – A positive sign.
Additionally, PEPE’s Futures Open Interest has started rising too. Over the past 24 hours, it rose by 4.3% while it hiked by 2.3% in the last four hours. Simply put, traders have been building their positions as PEPE recovered on the charts.
Major liquidation levels
Right now the major liquidation levels are near $0.0001019 on the lower side and $0.00001051 on the upper side, with traders over-leveraged at these levels.
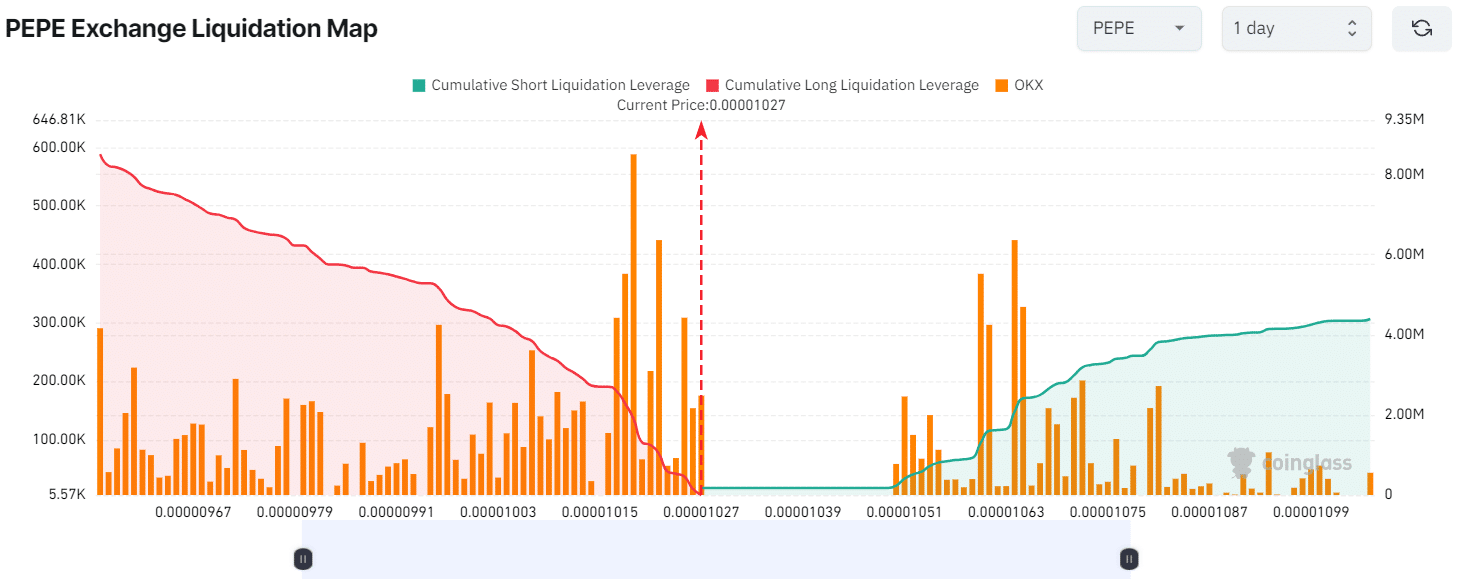
Source: Coinglass
If PEPE breaks out of the triangle pattern and hits the $0.00001051 level, nearly $407,910 worth of short positions will be liquidated. Conversely, if it fails to do so and the price drops to $0.00001019, approximately $1.90 million worth of long positions will be liquidated.
Combining all these on-chain metrics with technical analysis, it would appear that bulls are currently dominating the asset. They could trigger an upside rally in the coming days.
Current price momentum
At press time, PEPE was trading near $0.00001024, following a hike of 1.5% over the last 24 hours. During the same period, its trading volume jumped by 8.9%, indicating higher participation from traders and investors as the market began to recover.