
- PEPE had bullish momentum and price structure on the charts
- On-chain metrics continued to flash a buy signal too
PEPE has been performing well on the charts, even as the rest of the market fought to defend support levels or sank into a short-term downtrend. In fact, since hitting its lows on 1 May, the altcoin has bounced by 35% at press time.
Its network growth has also hiked, implying greater usage and demand for the memecoin. The metrics AMBCrypto analyzed underlined accumulation and reduced sell pressure over the past week.
Is the PEPE buy signal still on?
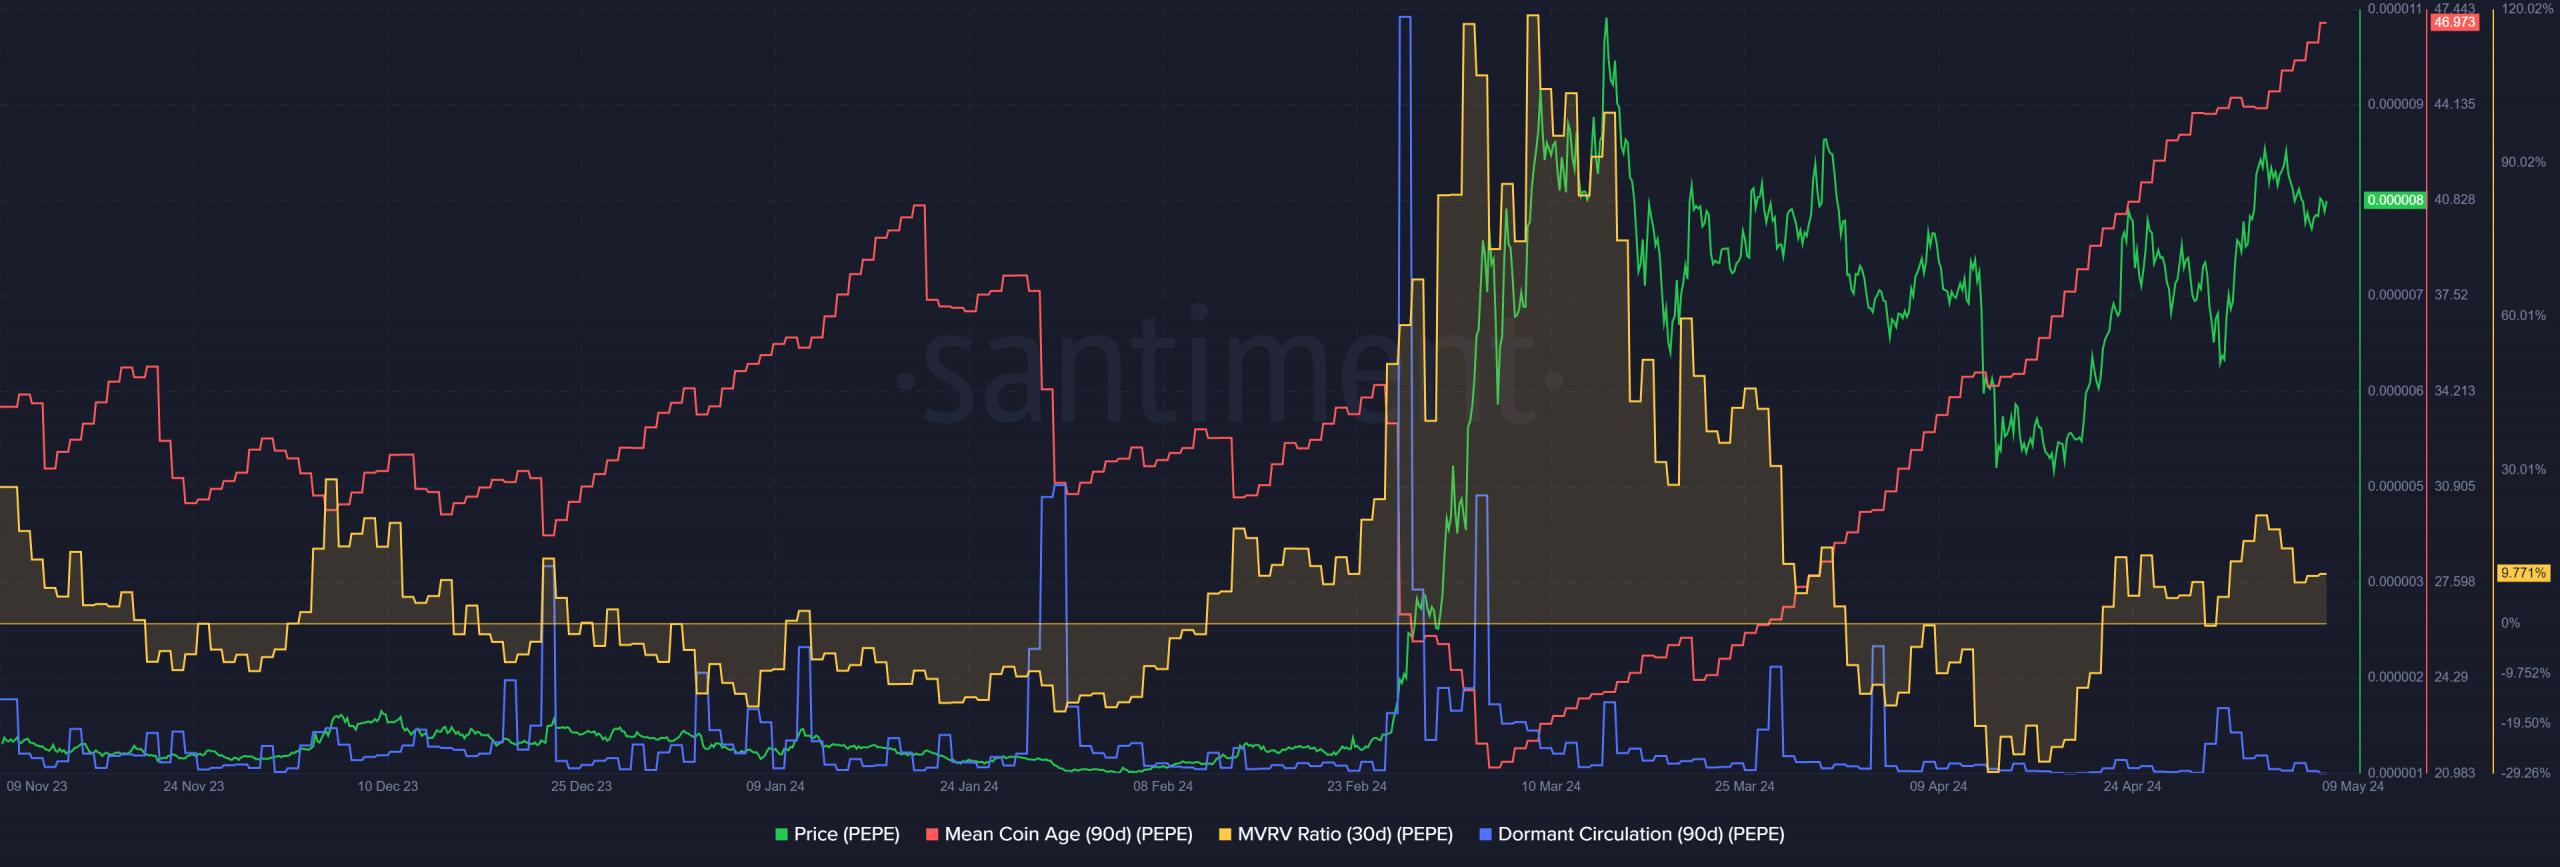
Source: Santiment
The 30-day MVRV ratio fell below zero in mid-April while the mean coin age metric trended aggressively higher. This was when PEPE hit the low at $0.0000048. Since then, the altcoin’s price has rallied by 65%, with the MVRV ratio slightly positive too.
At press time, the mean coin age had not lost its uptrend yet. Comparing the 30-day MVRV with how it went in late February, it seems that the memecoin could post large gains soon, provided Bitcoin does not nosedive below key support levels.
Apart from the buy signal going strong, the dormant circulation did not see notable spikes in recent weeks. It had one on 4 April, and another smaller one on 1 May. This suggested reduced token movement between addresses, which likely outlines reduced selling pressure.
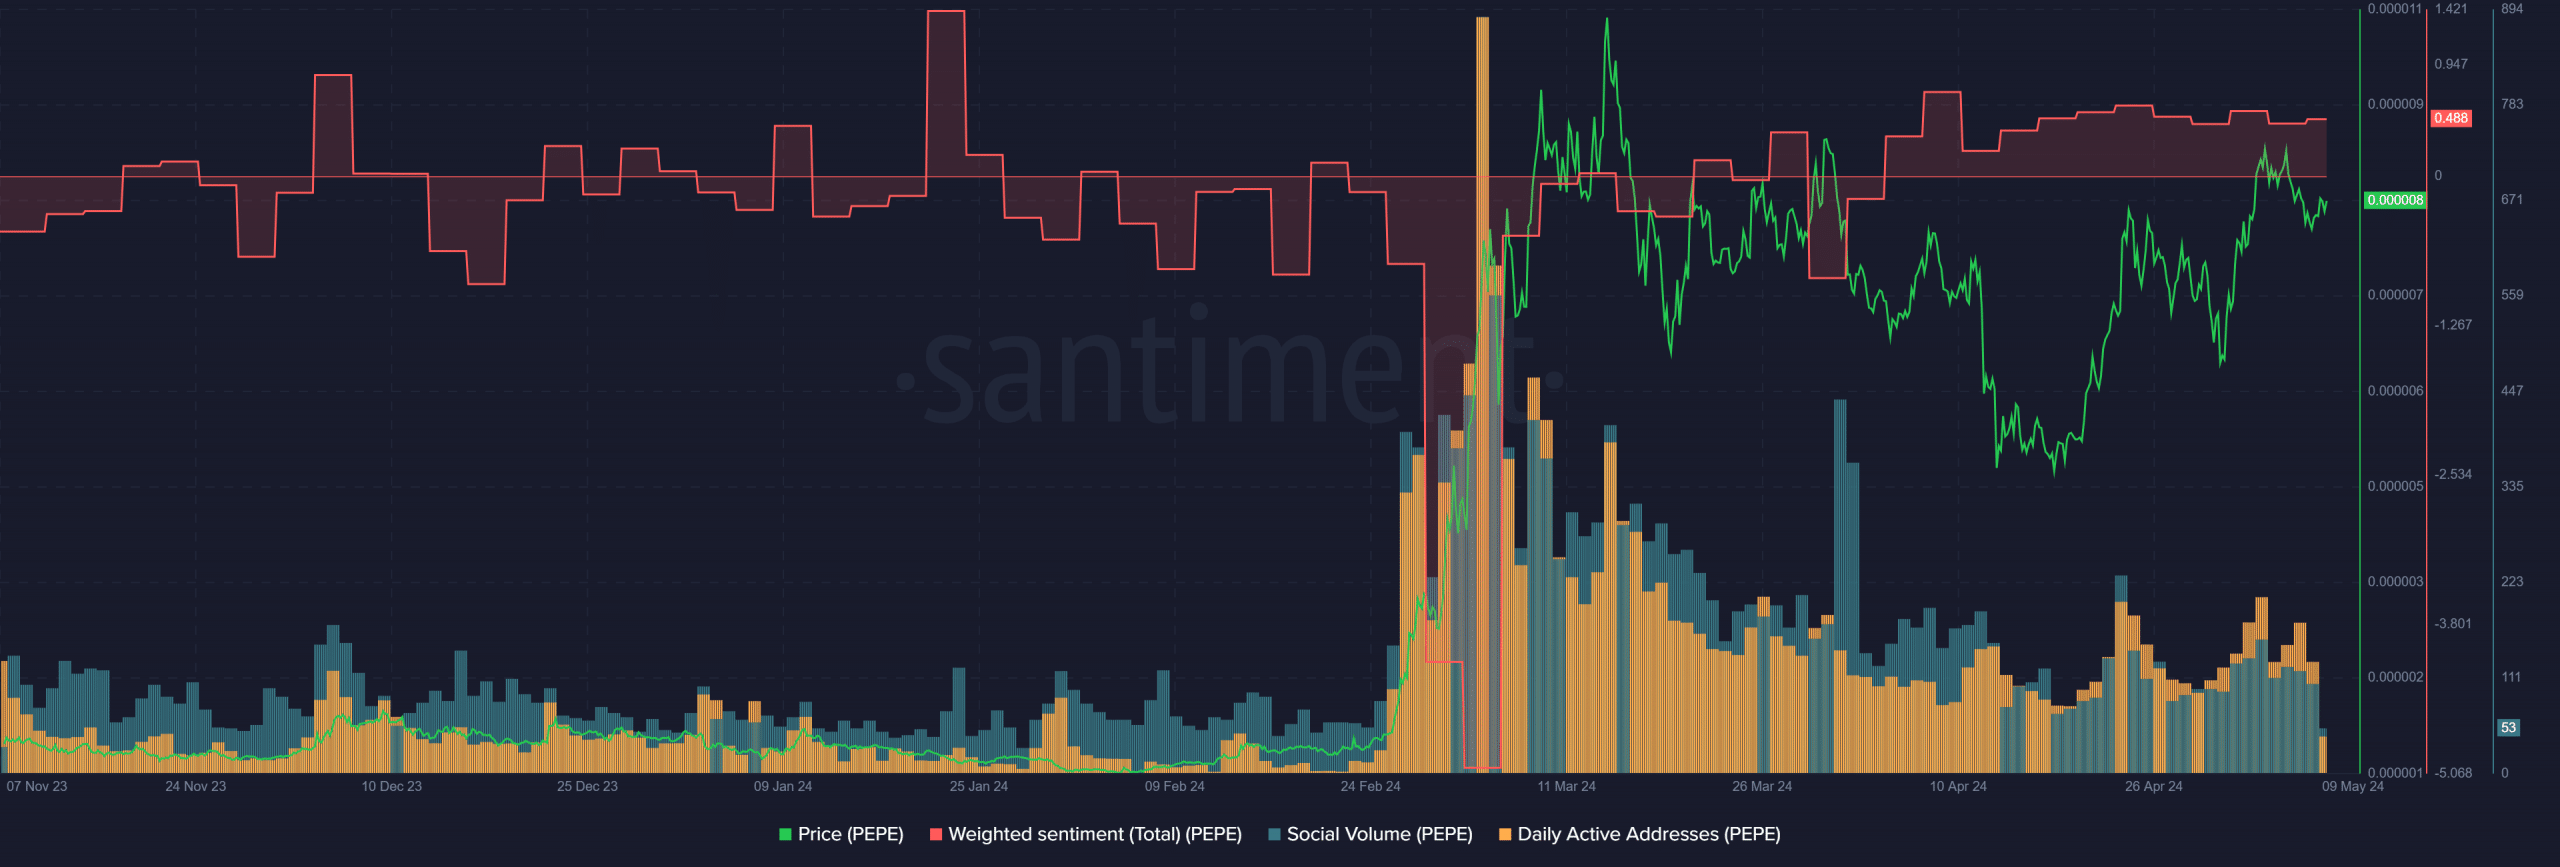
Source: Santiment
Additionally, the 3-day interval weighted sentiment has been positive over the past month. On the other hand, the social volume behind PEPE has been on a downtrend since early April. These conflicting signs showed that PEPE has a decent online presence with more bullish engagement than bearish.
Interestingly, the daily active addresses have slowly trended higher over the past three weeks. With network growth also rising, it could be a positive development that indicates a potential increase in demand.
Memecoin going strong, but…
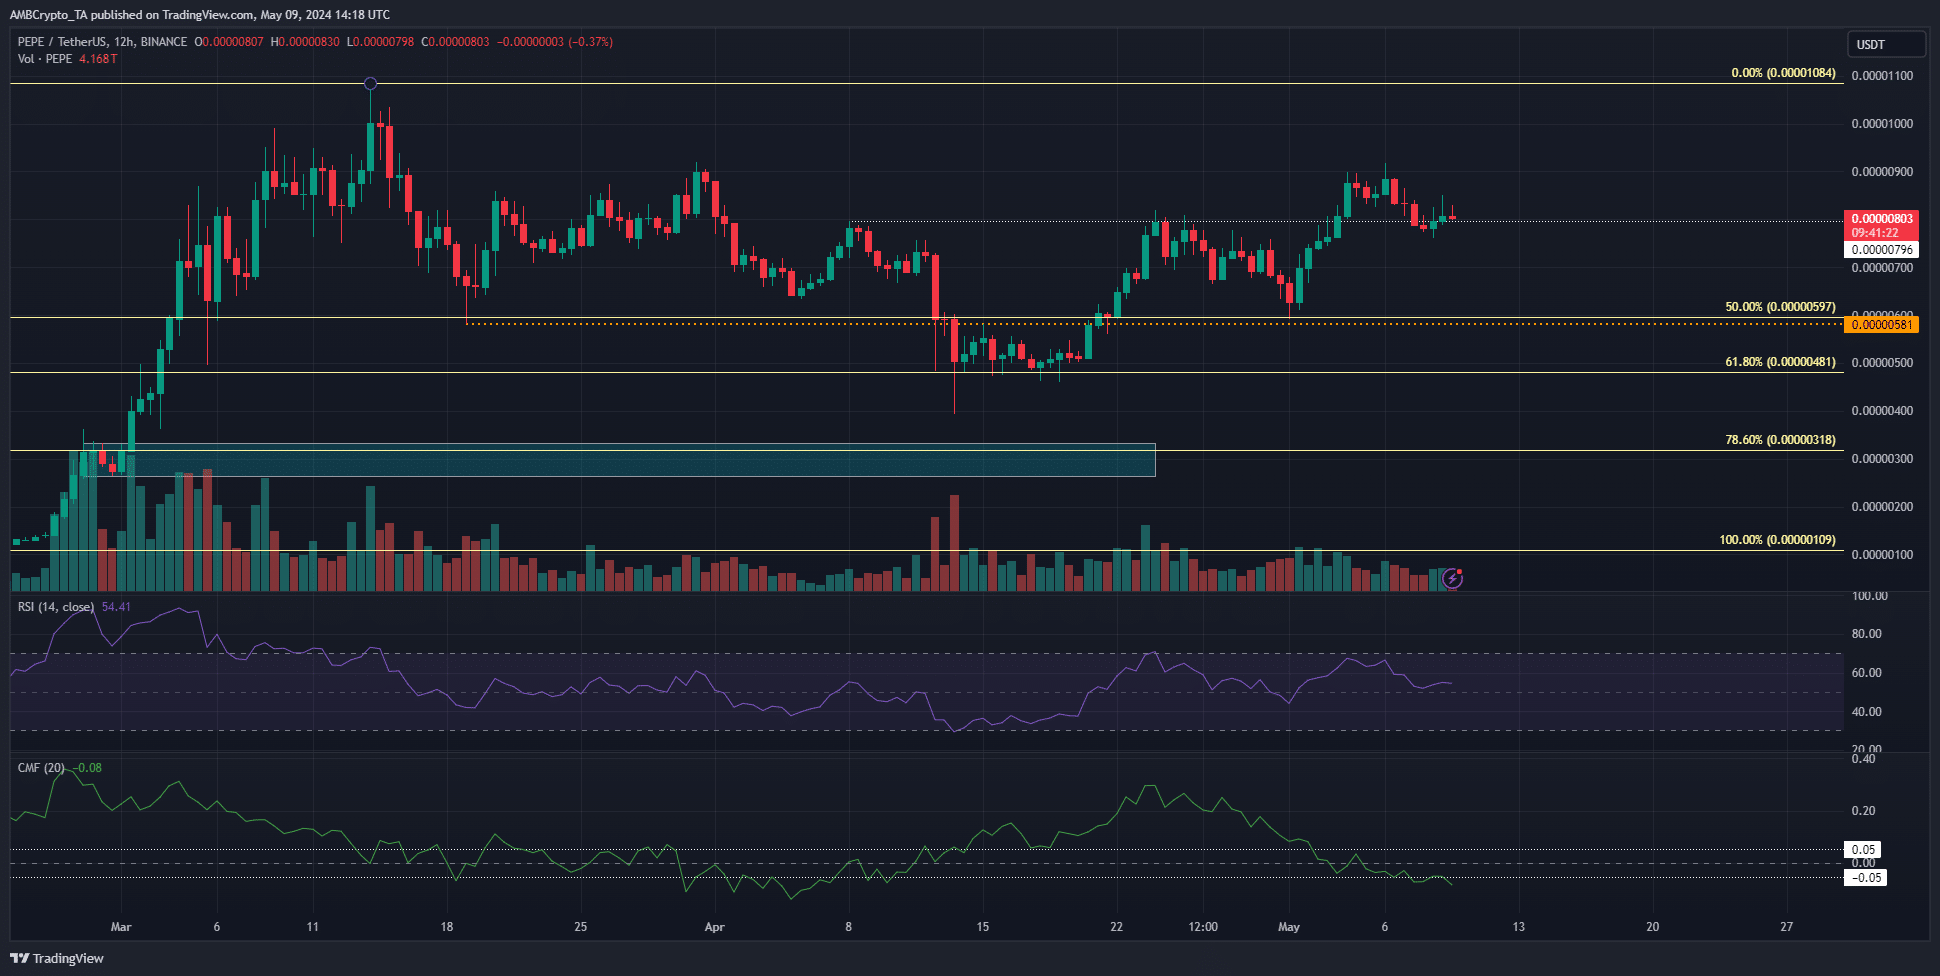
Source: PEPE/USDT on TradingView
The 12-hour price chart revealed a bullish bias. The local high at $0.000008 was beaten and flipped to support. The RSI stayed above neutral 50 and showed that upward momentum was dominant.
Is your portfolio green? Check the PEPE Profit Calculator
However, the CMF has been slowly declining and showed a reading of -0.08, at press time. This indicated significant capital flow out of the market, despite the bullish price structure.
Even so, considering all the factors together, it is still likely that the token would see gains on the charts.