Analysis

PEPE price prediction: Here’s a trading opportunity that you shouldn’t miss
Posted:
Journalist

- PEPE has a bullish structure but momentum and buy pressure have waned considerably.
- The liquidation levels data showed that a bearish trend could take over soon.
Pepe [PEPE] was in a consolidation phase over the past twelve days. It has traded above the $0.00001129 support level but was unable to advance past the $0.000014 resistance.
A recent analysis of the meme coin revealed that a majority of the holders were in profit.
Analysis of the liquidation levels showed that traders can expect a price move upward in the coming days, provided Bitcoin [BTC] does not initiate a short-term downtrend.
The overhead resistance was respected
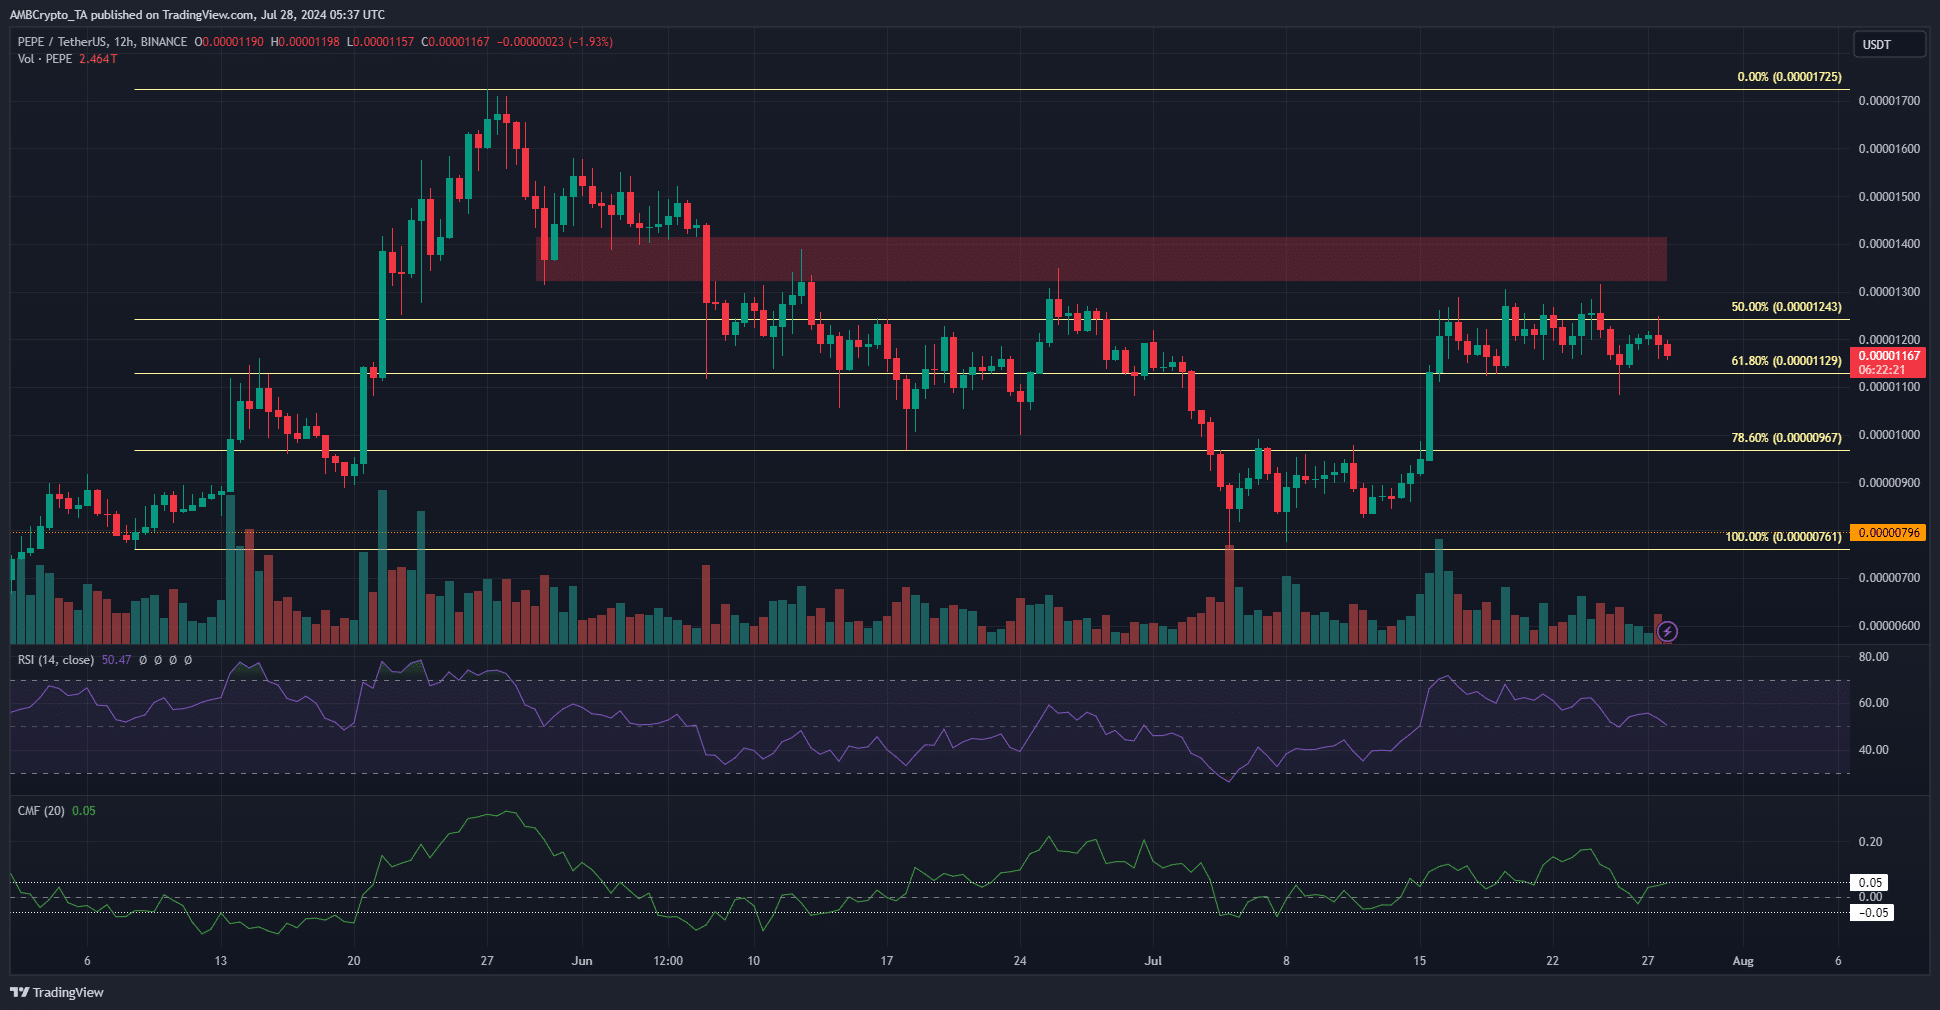
Source: PEPE/USDT on TradingView
On the 12-hour chart, the RSI has slowly trended downward since the 15th of July. At press time, it was at 50.47, showing momentum was neutral.
The CMF has been below +0.05 since the 25th of July, showing that capital flows were not significantly bullish.
Together they highlighted PEPE’s consolidation over the past two weeks. The $0.0000113 and $0.0000127 levels marked the extremes of a short-term range.
With declining trade volume, PEPE did not yet show signs of a breakout.
The magnetic zone around $0.000014 should be interesting for traders
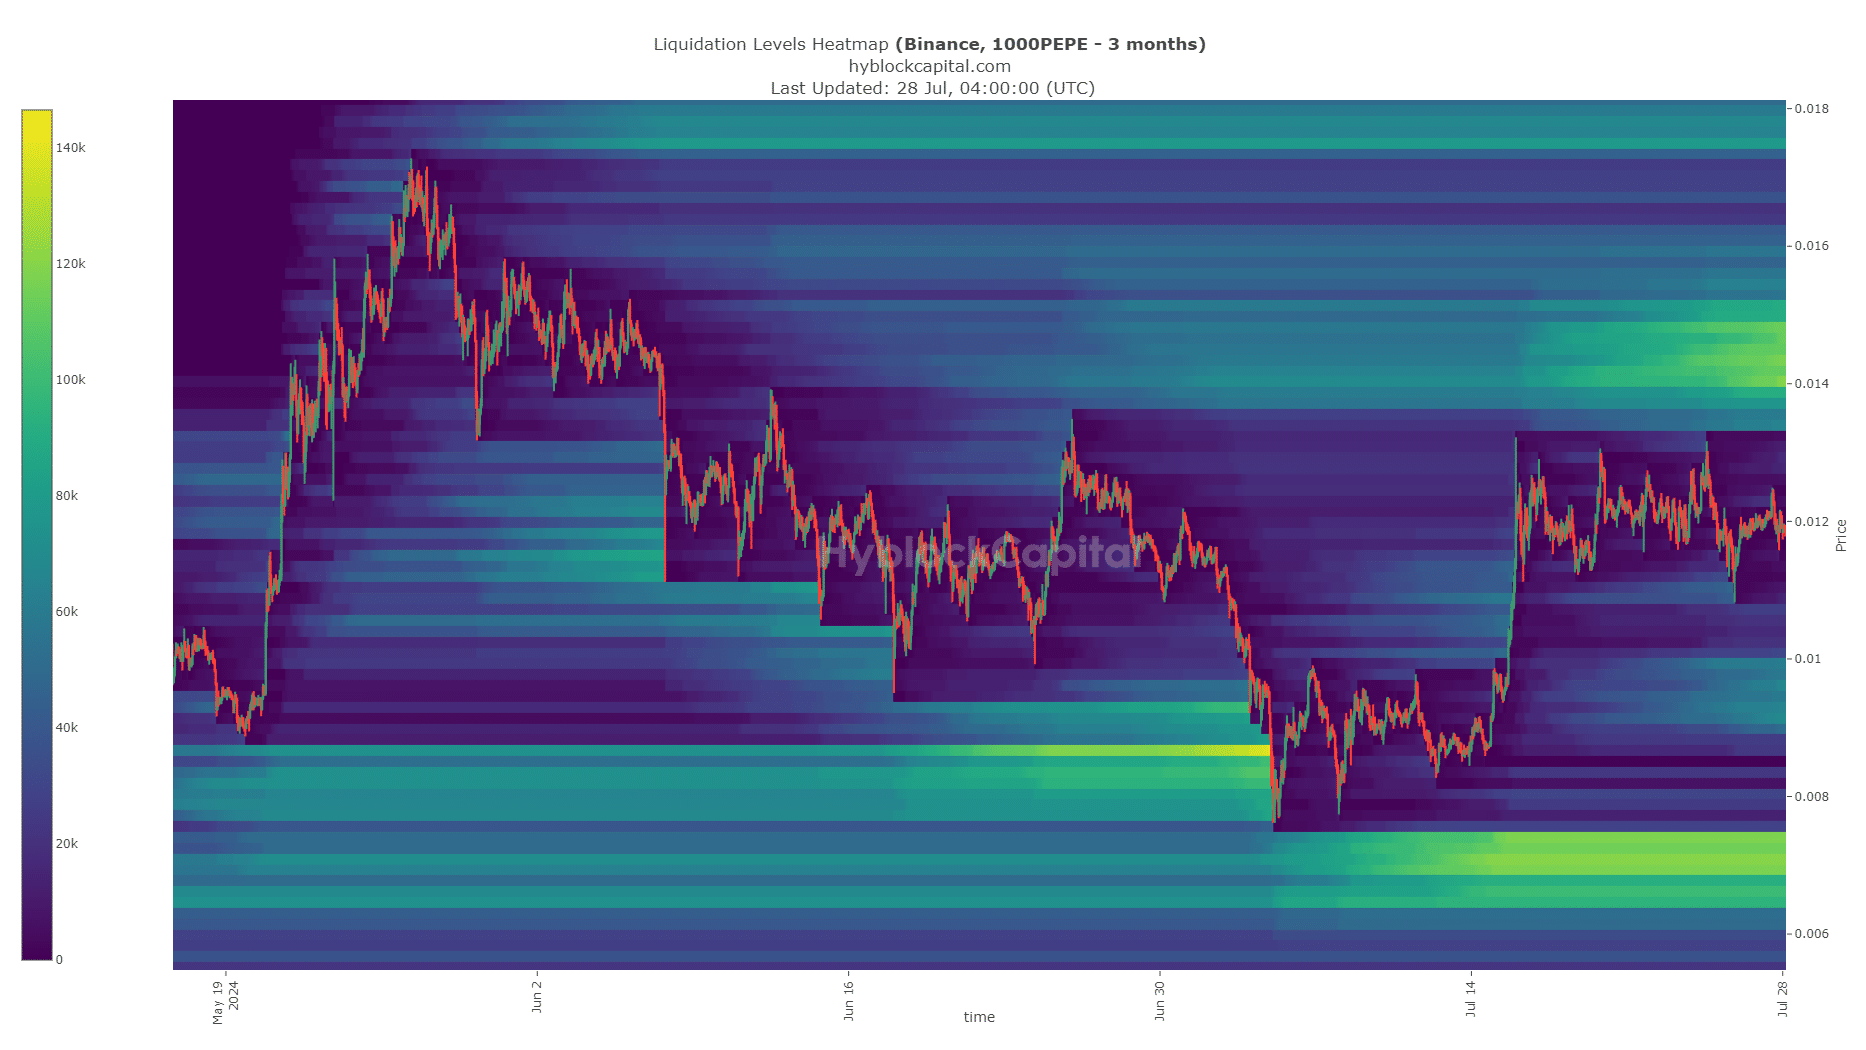
Source: Hyblock
Analyzing the liquidation heatmap of Pepe, AMBCrypto noted that the $0.000014-$0.0000148 zone was densely populated with liquidation levels. This magnetic zone is likely to pull prices toward it.
The consolidation of the past two weeks has served to increase the amount of liquidation levels in this area. This made it more likely to be swept in the next week or two.
To the south, the $0.000007-$0.0000076 zone is a target.
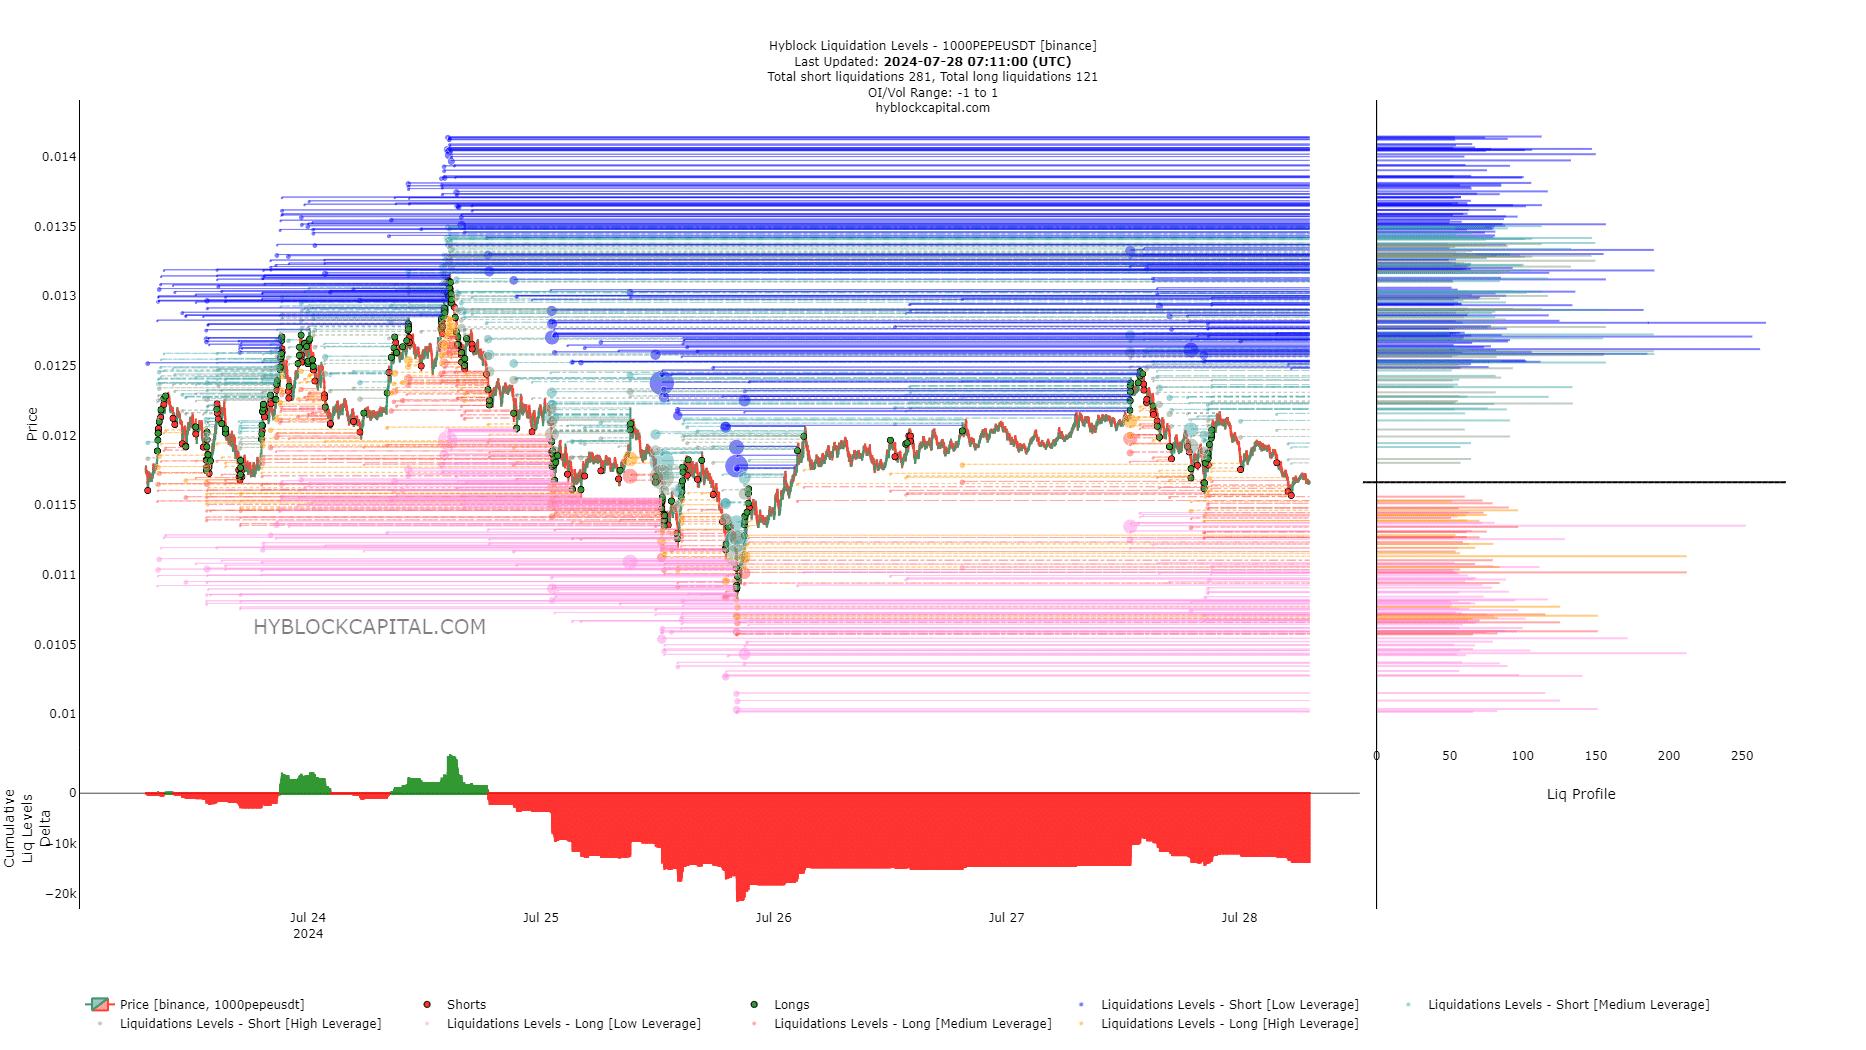
Source: Hyblock
The liquidity levels chart showed short positions outnumbered the longs. This could see a short squeeze, or a price move upward to hunt the short-sellers.
The $0.0000123-$0.0000126 levels, or the short-term range highs, were a viable bullish target for the next 48 hours.
Realistic or not, here’s PEPE’s market cap in BTC’s terms
Overall, PEPE might see a move as high as $0.000014 before a bearish reversal. The chances of a breakout appear slim, especially with BTC retreating from the $69k resistance in recent hours.
Disclaimer: The information presented does not constitute financial, investment, trading, or other types of advice and is solely the writer’s opinion.