PEPE recovers ground, but can it escape bearish shadows?
While demand for Pepe was low, the price action noted a potential consolidation phase for the popular memecoin.

- The PEPE price action showed that the bearish trend might be ending.
- Three-to-six-month holders endured large losses, and on-chain activity was drying up for Pepe.
The memecoin market continued to suffer under the yoke of the bears. Over the past thirty days, the memecoin market cap has fallen by 15.1%.
Its daily trading volume was 20% lower than what it was a week ago, and 45% lower than the daily volume from a month ago.
As one of the major memes, Pepe [PEPE] has not escaped this bearish onslaught.
While it was only 4% within the past month, it has seen its share of volatility. Its March high and low were at $0.0000092 and $0.0000057, respectively. This was a 76% difference measured from bottom to top.
Failing on-chain activity and lack of accumulation hurt PEPE’s bullish chances
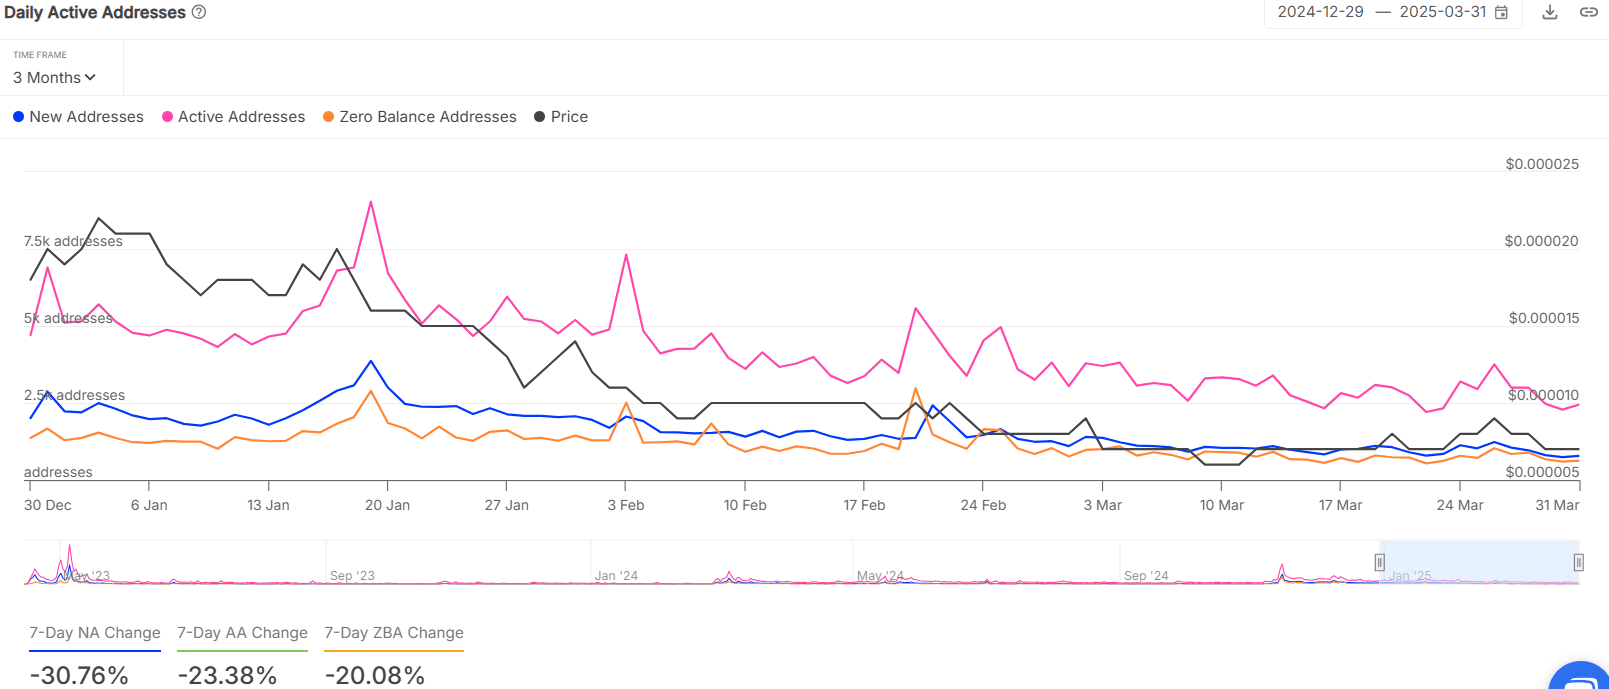
The 7-day change of the new PEPE addresses, active addresses, and zero-balance addresses were all negative. Zooming out further, we can see the daily active addresses metric has been falling since the 20th of January.
The new addresses count had a spike on the 21st of February, but has dwindled since then.
The lack of activity on-chain was a concern, and it also showed that there was low demand for PEPE.
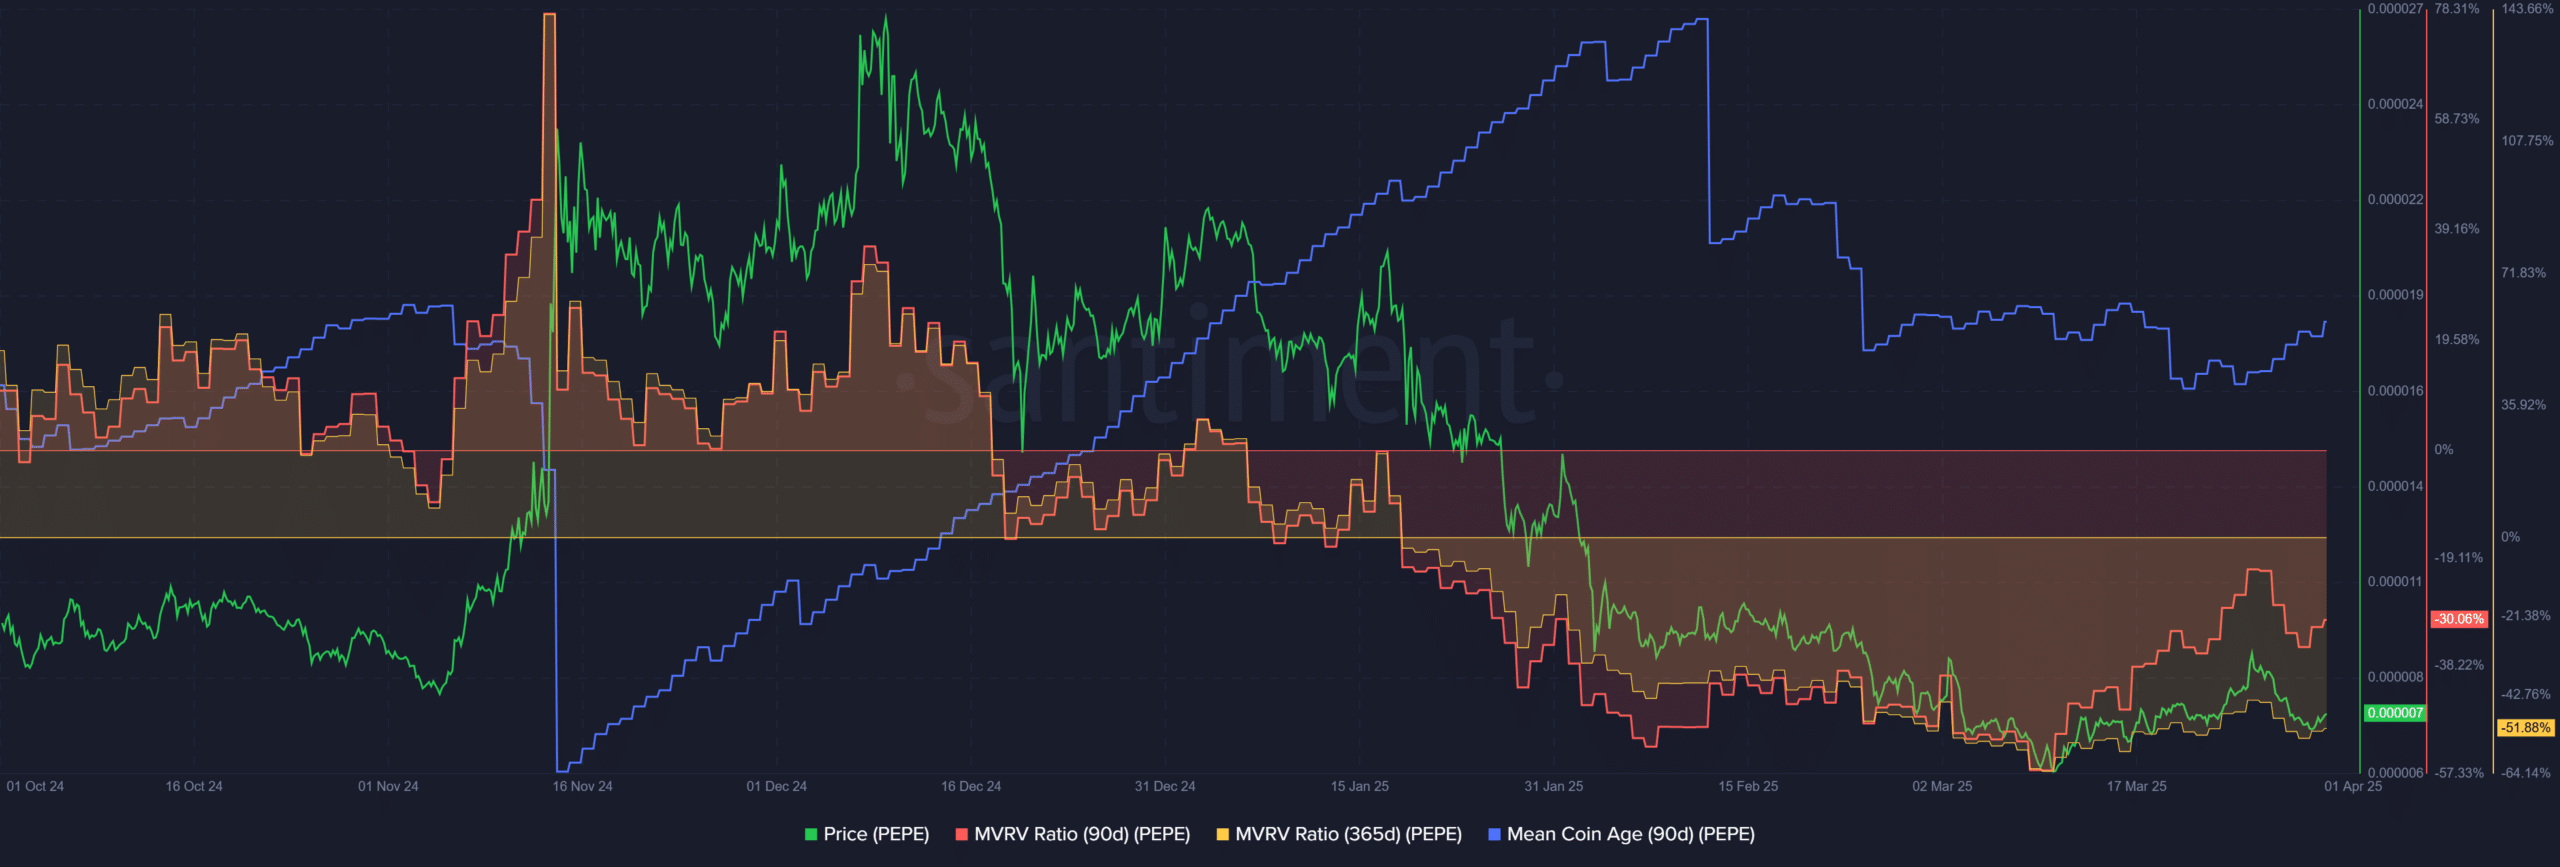
The 90-day and 365-day MVRV ratios were both deeply negative, especially the latter. It showed medium to long-term holders were suffering. At the same time, the Mean Coin Age acked a strong trend in either direction over the past six weeks.
This suggested a lack of accumulation, but also that selling pressure from longer-term holders was waning. This could be good news for investors looking to buy PEPE.
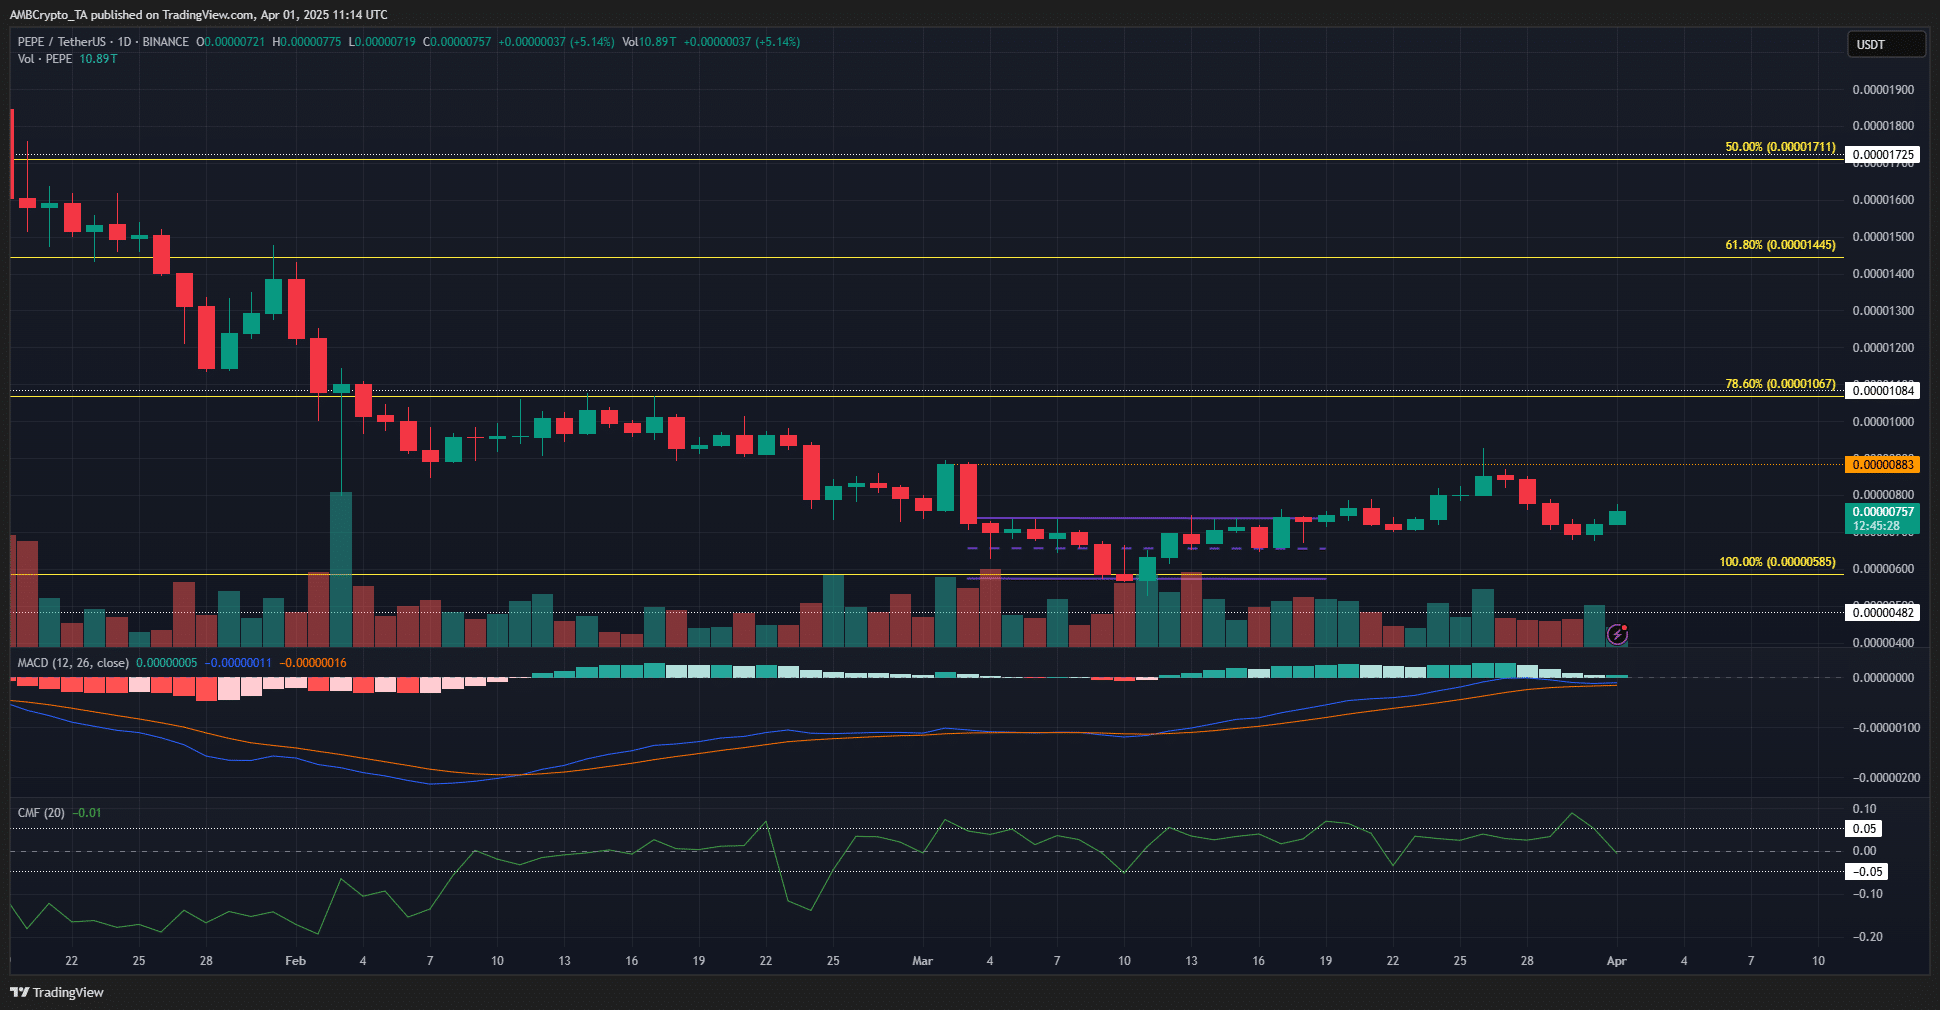
Since March, Pepe’s downtrend on the 1-day chart has shown signs of weakening. Over the past three weeks, the price has not formed a new lower low and has tested the local resistance level at $0.00000883.
The MACD has moved higher and is approaching the zero line, though it has yet to confirm a bullish crossover.
Meanwhile, the CMF remains in neutral territory, indicating that capital flow is balanced between buyers and sellers.
Although network metrics reveal holders at a loss and reduced on-chain activity, the price action chart suggests consolidation.