PEPE’s 27% gains in 30 days at risk? Here’s why…

- Despite trading within a broader bullish structure, PEPE could be forced to seek stronger support zones.
- If PEPE remains unable to clear this resistance, an extended accumulation phase could follow.
Pepe [PEPE] had an impressive run in the last month, gaining 23.7%. However, those gains are now at risk, with PEPE gradually losing momentum.
Currently, the asset has dropped by 2.46% on the daily charts, signaling a potential continuation of this downtrend.
According to a recent analysis by AMBCrypto, this decline may persist, as current market sentiment leans bearish, with limited buying pressure to sustain upward movement in PEPE’s price.
PEPE faces a major obstacle
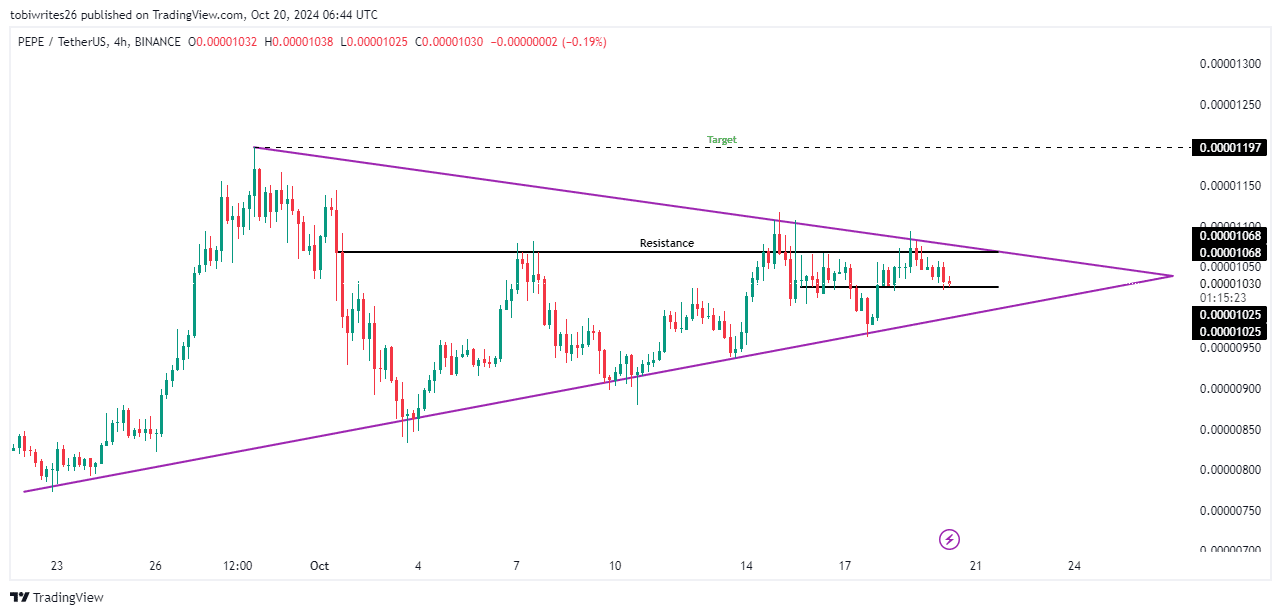
PEPE was trading within a symmetrical triangle at press time, a pattern typically seen as a precursor to a price breakout following a period of accumulation.
The token recently reacted to resistance at $0.00001068, a level that has rejected price rallies twice, indicating significant selling pressure at this zone.
During this period, PEPE was hovering around a support level of $0.00001025. Suppose this support holds and sufficient buying pressure emerges.
In that case, the price is expected to rebound, potentially retesting the resistance level and breaking through the pattern, pushing PEPE toward the upper boundary of the triangle.
However, if this support level fails to hold, PEPE could retreat further to the lower support of the ascending triangle, a zone with high liquidity that may generate enough buying momentum to drive the price higher.
Will PEPE’s support level hold?
According to AMBCrypto’s findings, it appears unlikely that PEPE’s current support level will hold, as technical indicators suggest increasing selling pressure from traders.
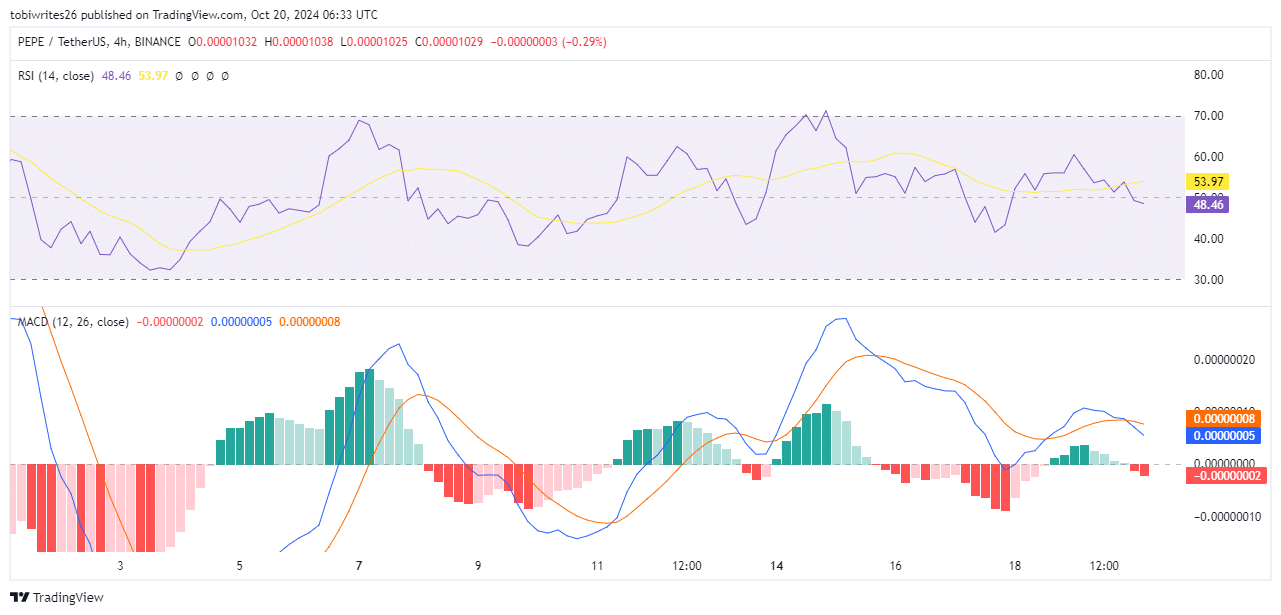
The Relative Strength Index (RSI) is currently at 48.46, below the neutral 50.00 mark, indicating that market sentiment is bearish and PEPE’s price may follow suit.
The RSI measures the speed and change of price movements in an asset.
The Moving Average Convergence Divergence (MACD) has also formed a “death cross,” with downward momentum gaining strength.
This happens when the MACD line (blue) crosses below the signal line (red), signaling that traders are more inclined to sell than hold the asset.
If this trend continues, PEPE could break below its support level, leading to further declines.
Interest in PEPE continues to fade
Open Interest, which is used to gauge market sentiment by tracking whether participants are buying or selling, indicated that selling pressure was increasing at press time.
Read Pepe’s [PEPE] Price Prediction 2024–2025
According to data from Coinglass, Open Interest in PEPE has dropped by 3.61%, with a current value of $165.20 million in the near term.
This decline in Open Interest suggests that further price drops for PEPE are likely, making a fall from its current level seem inevitable.


