
- PEPE saw its market structure flip bearishly, indicating further losses were likely.
- The on-chain metrics flashed a strong buy signal, but market sentiment remained fearful.
Pepe [PEPE] was unable to defend the $0.00000581 level at the second time asking and has shed close to 50% in the past five days. The majority of those losses came from the 11th to the 13th of April.
The volatility might catch traders off guard, but it was also an opportunity. From the lows of 13th April, PEPE has bounced by 33% in around 32 hours. Does that mean the local bottom has been set? Here’s what the path ahead might look like.
Evidence for accumulation
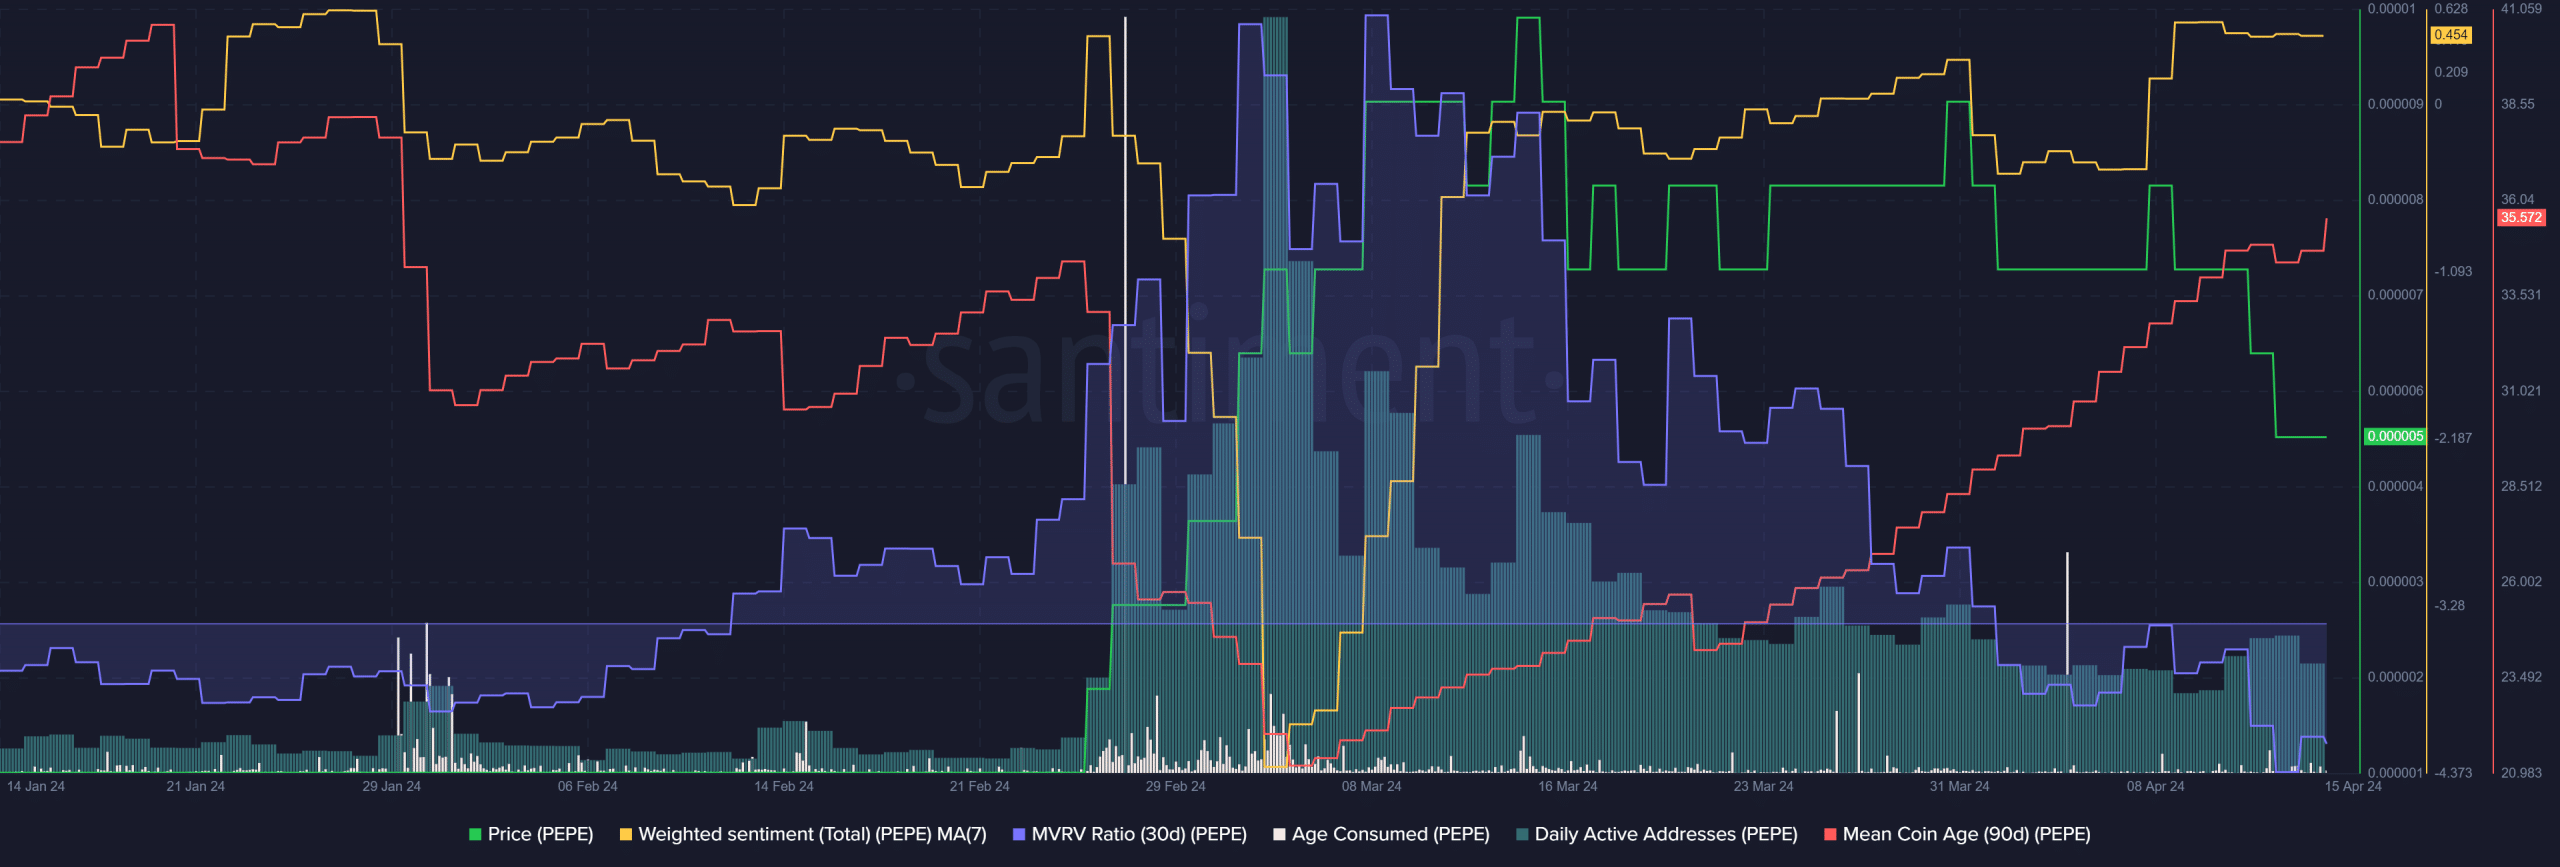
Source: Santiment
Since mid-March, the memecoin has been retracing the gains it made in late February. Yet, despite the losses on the price chart, the mean coin age has trended higher. This pointed toward network-wide accumulation of PEPE.
This was further supported by the age consumed metric. It saw a huge spike on the 4th of April and two large ones on the 26th and 27th of March. Together, they showed large token movements, but not consistent movement like we saw in early March.
This meant holders sold in panic but many others continued to hold through the losses. The 30-day MVRV was negative, showing their losses were growing. But in concert with the mean coin age, the negative MVRV was a buy signal.
The 7-day weighted sentiment was positive, which was surprising after the recent developments. There was still a chance of a deeper drop, based on technical analysis.
The structure breaks and the next demand zone
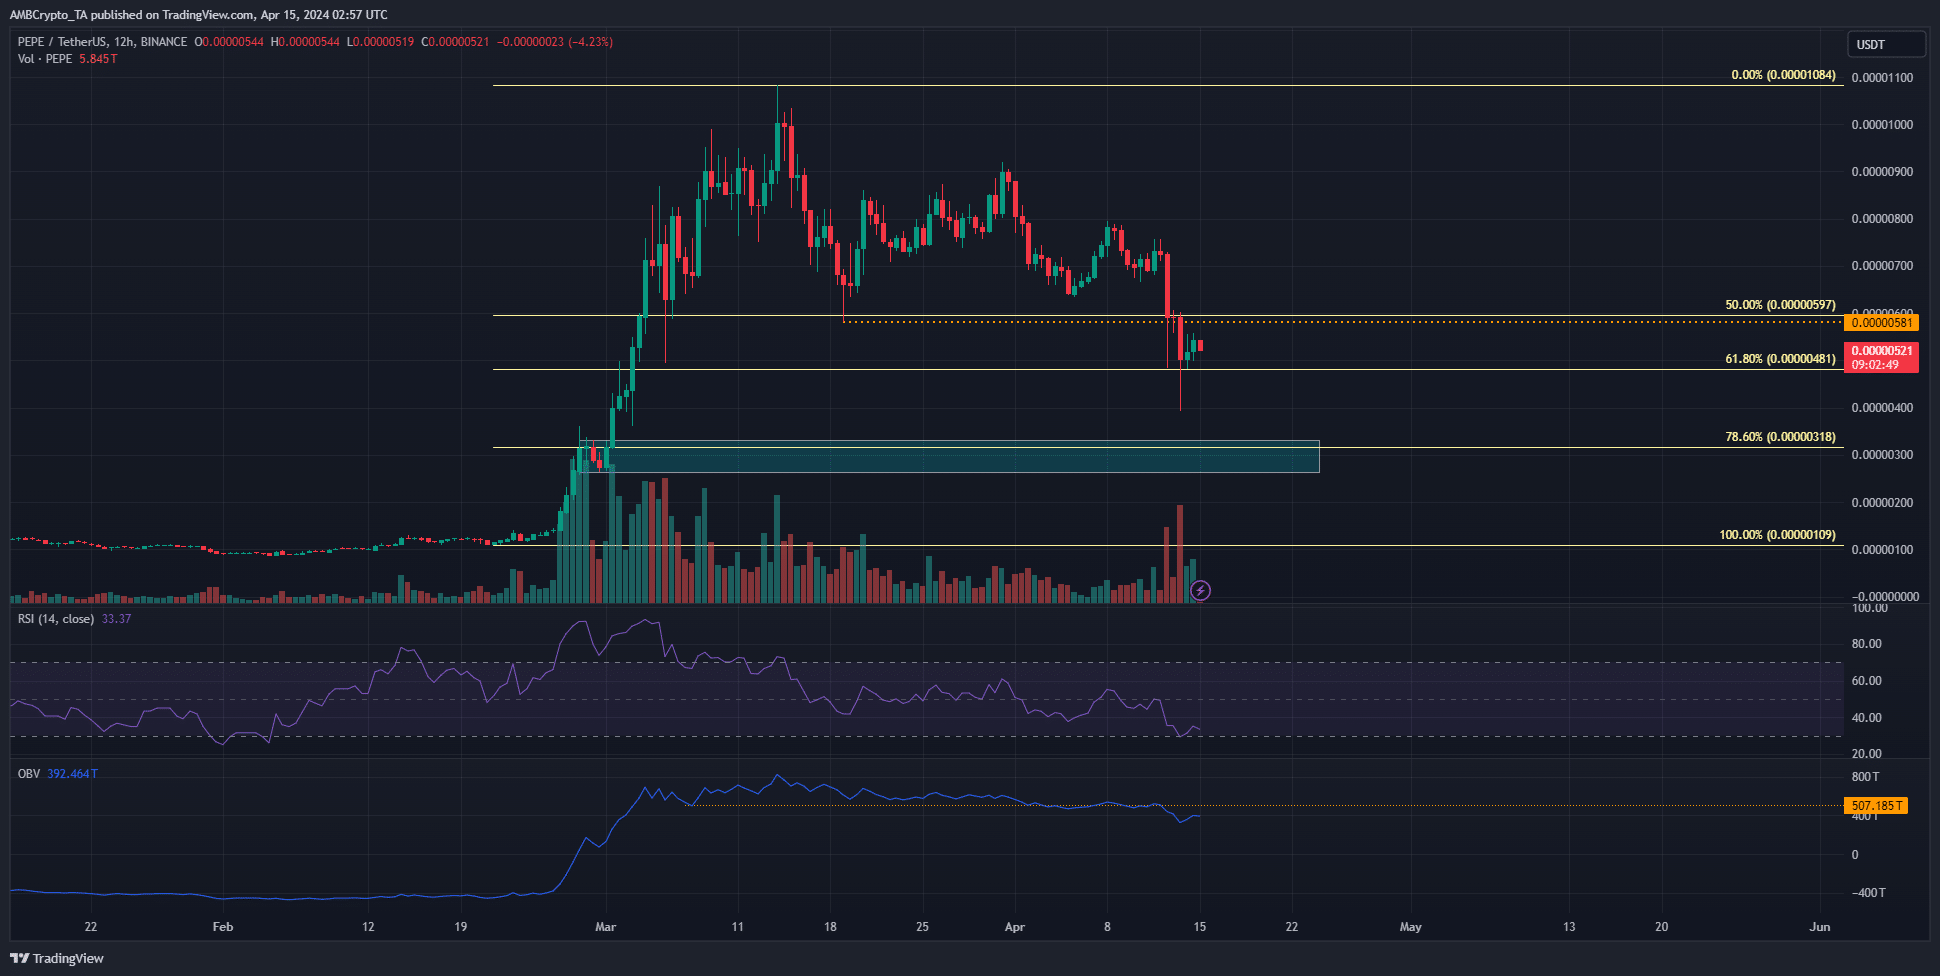
Source: PEPE/USDT on TradingView
The retracement to $0.00000581 on the 19th of March set a new swing low. The recent PEPE dip meant that the shorter timeframe trend was bearish and so was the market structure. However, on the 12-hour chart, the trend was still biased bullishly.
The RSI was at 33 to signal downward momentum was dominant. Moreover, the OBV also fell below a month-long support. Hence, more losses are expected in April. This could see the meme coin reach the 78.6% retracement level at $0.00000318.
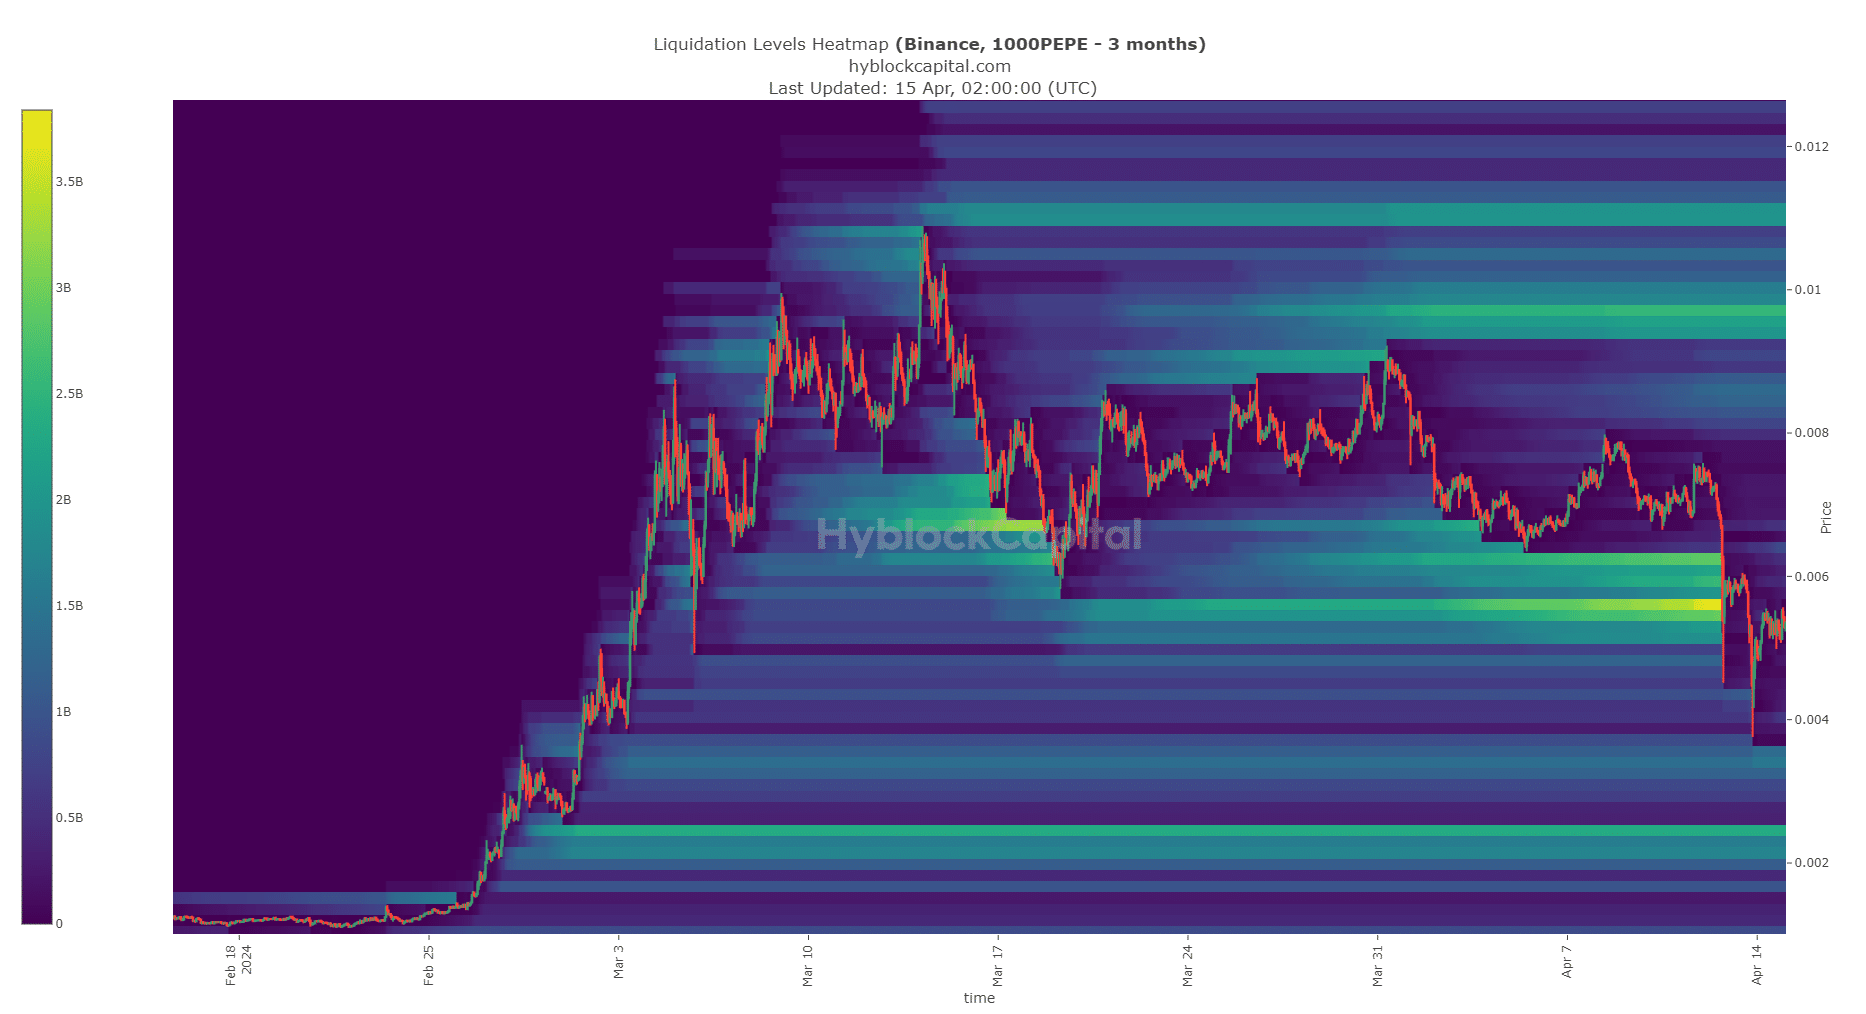
Source: Hyblock
The liquidation heatmap showed sparse liquidation levels above current market prices. To the south, the $0.00000245 was the next magnetic zone for the prices. Yet, if Bitcoin [BTC] has reached a local bottom, PEPE might bounce higher.
Is your portfolio green? Check the Pepe Profit Calculator
Hence, in the short term, the $0.00000955 area was also a magnetic zone. However, it is 85% higher than market prices, which was doubtful given the market uncertainty.
Overall, the metrics suggested that it could be a good short-term buying opportunity for PEPE traders.
![dogwifhat's [WIF] 3-day rally has eyes glued, yet a hidden risk lurks](https://ambcrypto.com/wp-content/uploads/2025/04/Gladys-8-400x240.jpg)