Peter Brandt: Bitcoin’s decline mirrors 2016, here’s what it means now!
Bitcoin’s recovery and potential bull run highlight significant market resilience and future growth possibilities.
- Bitcoin’s rebound post-drop mirrors 2016 bull run patterns.
- RSI and Bollinger Bands suggest potential price correction or shift to the bullish trend.
On 5th August, Bitcoin [BTC] experienced its most significant daily drop since the FTX collapse, plummeting over 16%.
This steep decline was part of a broader crypto rout, with nearly 90% of altcoins also suffering double-digit losses, signaling a severe downturn across the sector.
Bitcoin bounces back after the dip
Despite this dramatic slump, BTC has rebounded strongly, showing a remarkable recovery with an 8% gain in the past 24 hours and trading at $54,791 as per CoinMarketCap.
While many remain cautious amid Bitcoin’s heightened volatility, veteran trader Peter Brandt notes that BTC’s recent decline since the April 2024 halving resembles market patterns observed before the 2016 bull run.
Taking to X he noted,
“Please note that $BTC decline since halving is now similar to that of the 2015-2017 Halving Bull market cycle.”
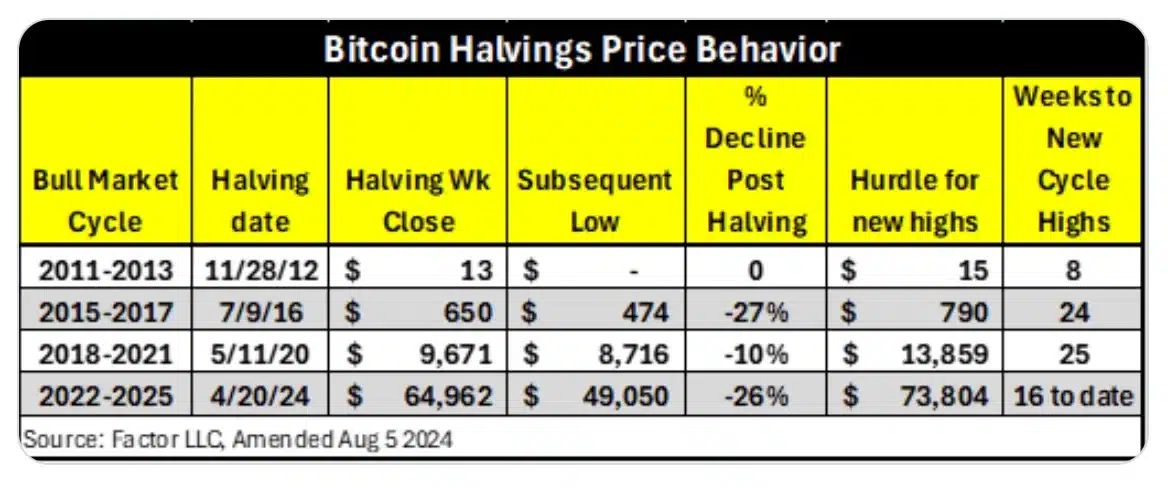
For perspective, in 2016, Bitcoin dropped 27% from its halving price before soaring to new highs.
With a similar 26% drop from its recent halving price, this pattern might indicate a potential for significant gains in the future, mirroring the previous bull run.
What are the technical indicators trying to tell us?
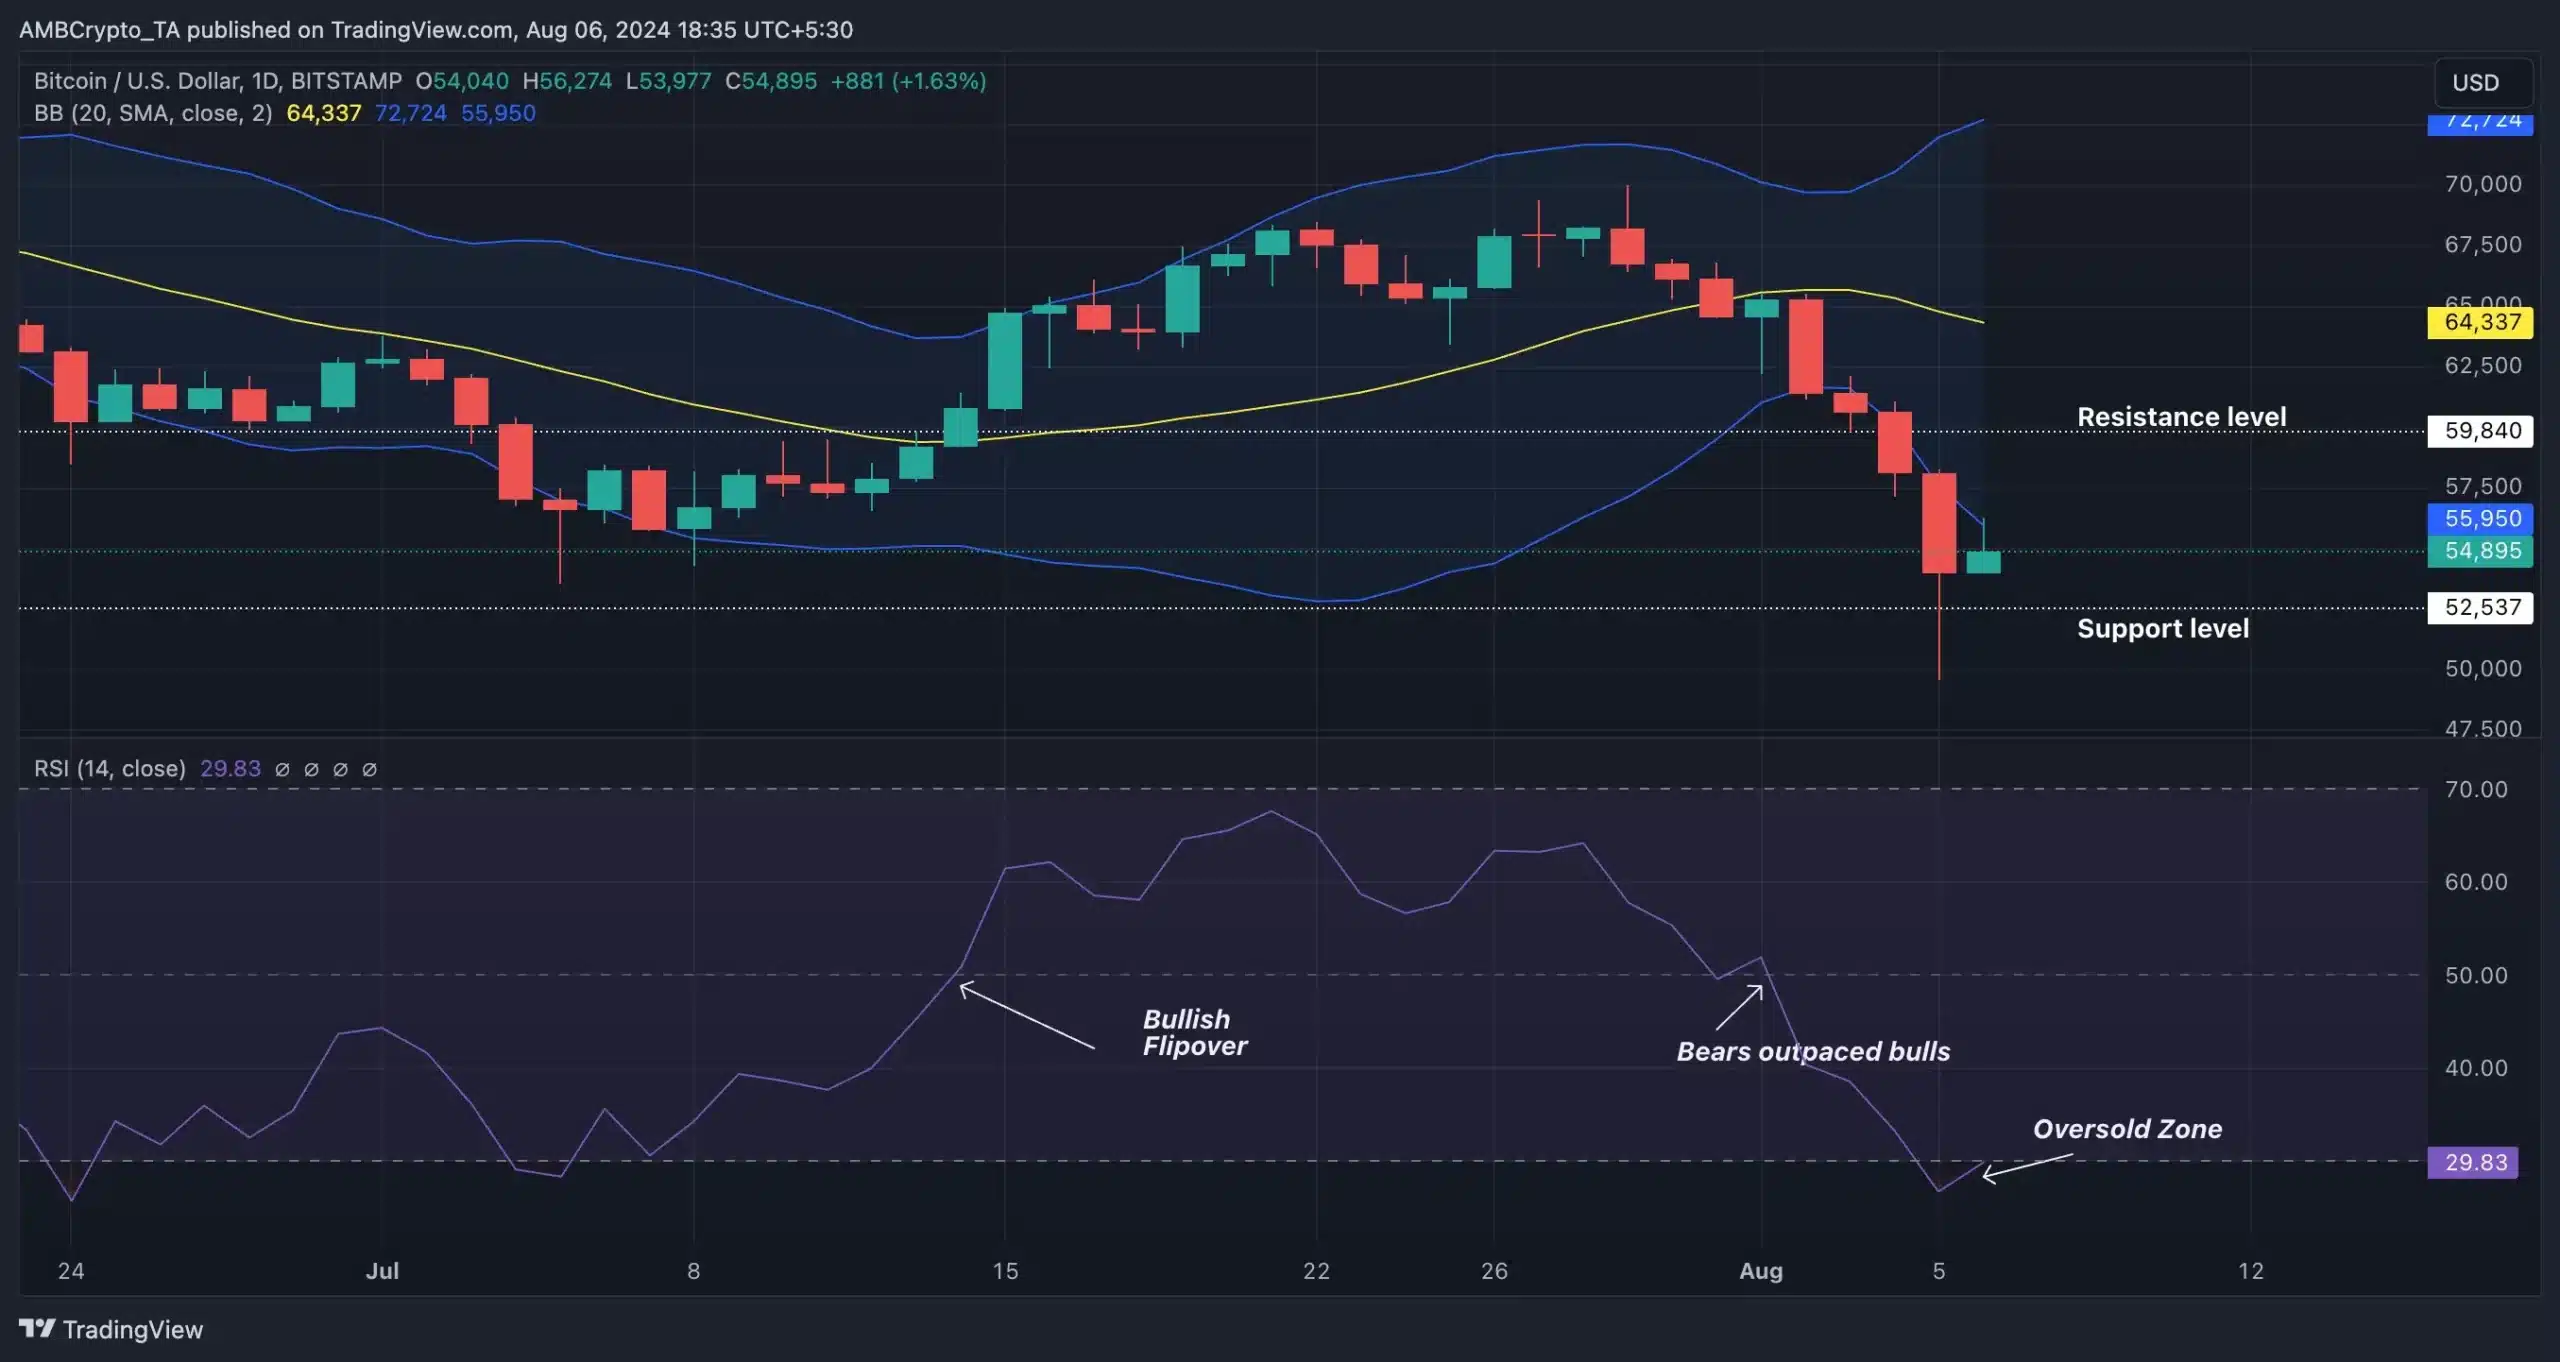
However, despite BTC’s recent price increase, concerns remain as the Relative Strength Index (RSI) sits at a low 29, indicating that sellers still dominate over buyers.
Following a dramatic 16% drop, Bitcoin entered the oversold zone. Historically, such oversold or overbought conditions often signal price corrections.
This view is reinforced by the widening Bollinger Bands, which suggest increased volatility and a potential shift from a bearish to a bullish trend.
Bitcoin’s on-chain metric analysis
To further solidify the upcoming bullish trend, AMBCrypto analyzed IntoTheBlock’s data and found that a significant majority (78.50%) of BTC holders held tokens valued higher than their purchase price at press time, indicating that they were “in the money.”
In contrast, a smaller segment (20.69%) held BTC tokens that were worth less than their purchase price, placing them “out of the money.”
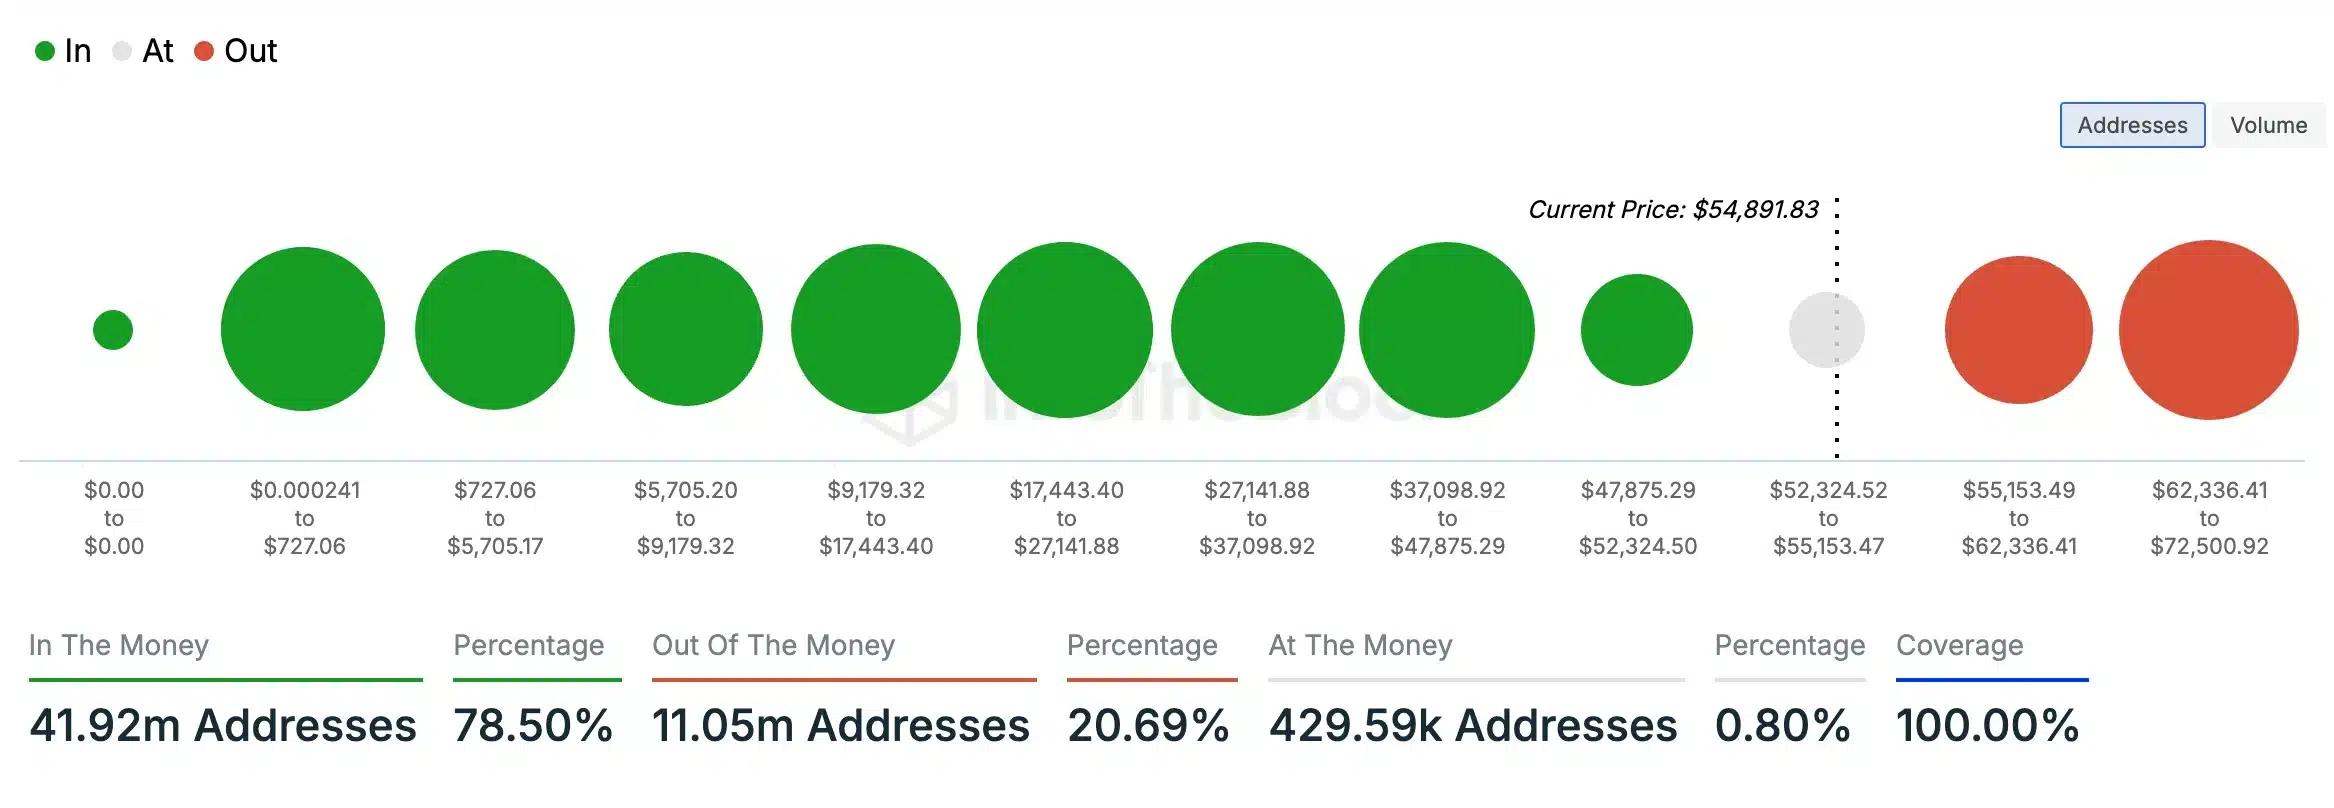
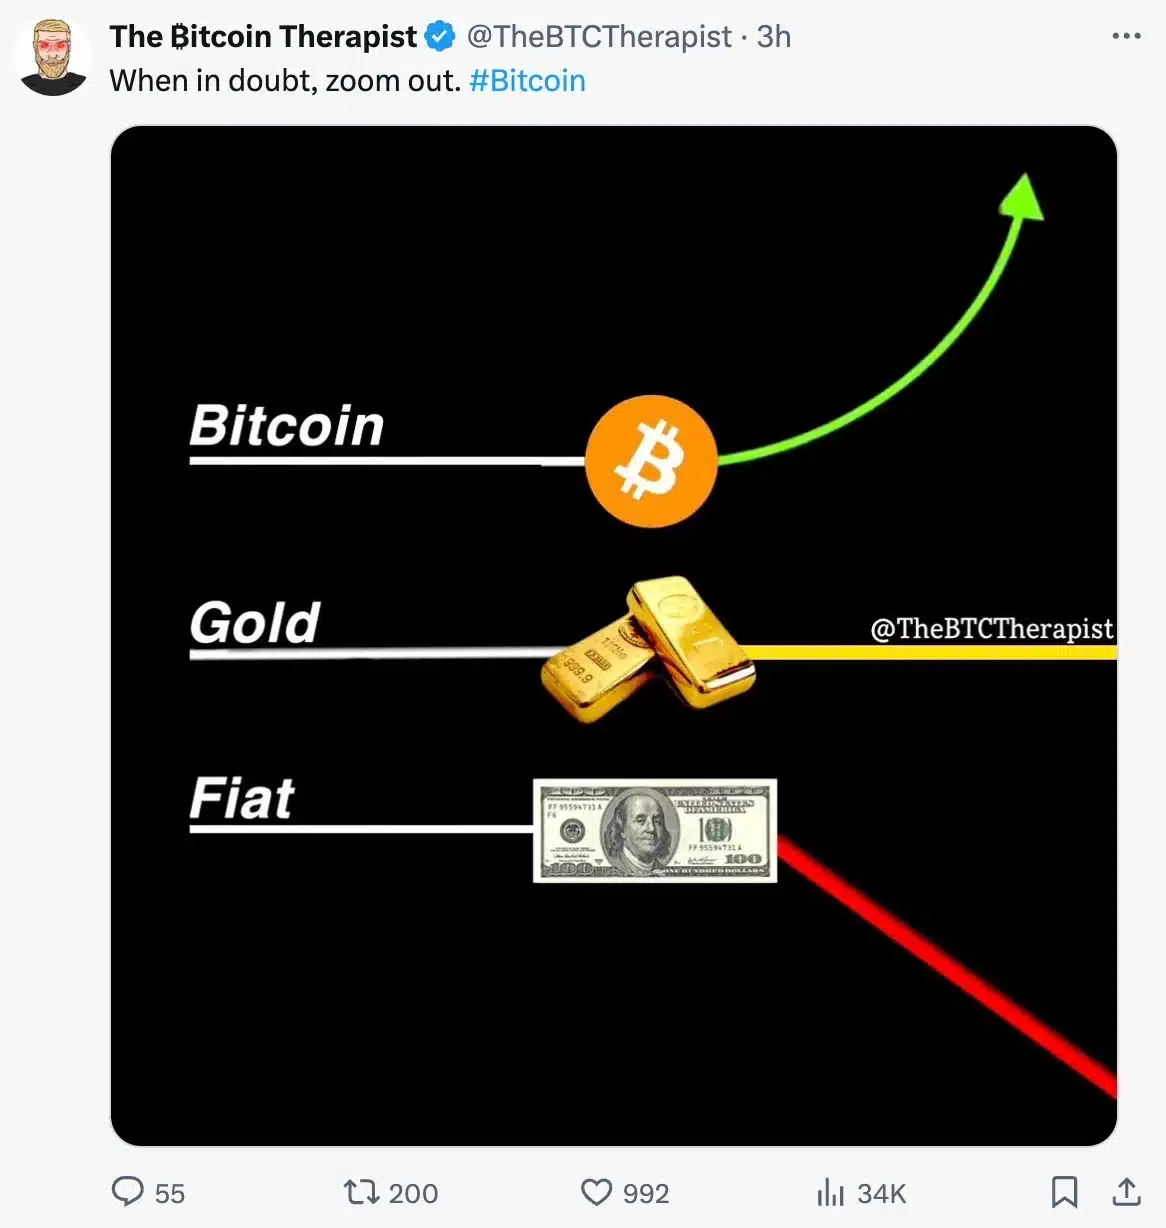
This suggested a bullish sentiment or potential upcoming price surge for BTC. ‘The Bitcoin Therapist’ put it best when he said,