
- Polkadot’s price surged in double digits last week, but the last 24 hours were bearish.
- Most metrics hinted at a price increase, which could result in a breakout from a bullish pattern.
After a week of promising price increases, Polkadot [DOT] bears took control as its price declined in the last few hours. However, there was more to the story as a bullish pattern formed on the token’s price chart.
Let’s have a look at whether DOT can break above the pattern anytime soon.
Polkadot’s upcoming rally
CoinMarketCap’s data revealed that Polkadot witnessed an over 13% price rise over the last week. But the scenario changed in the last 24 hours as its value plunged by more than 5%.
At the time of writing, DOT was trading at $4.57 with a market capitalization of over $6.6 billion, making it the 14th largest crypto.
The negative price action had an impact on its social metrics as its weighted sentiment dropped into the negative zone. This meant that bearish sentiment around the token increased.
Its social volume also registered a gradual decline, reflecting a decline in its popularity.
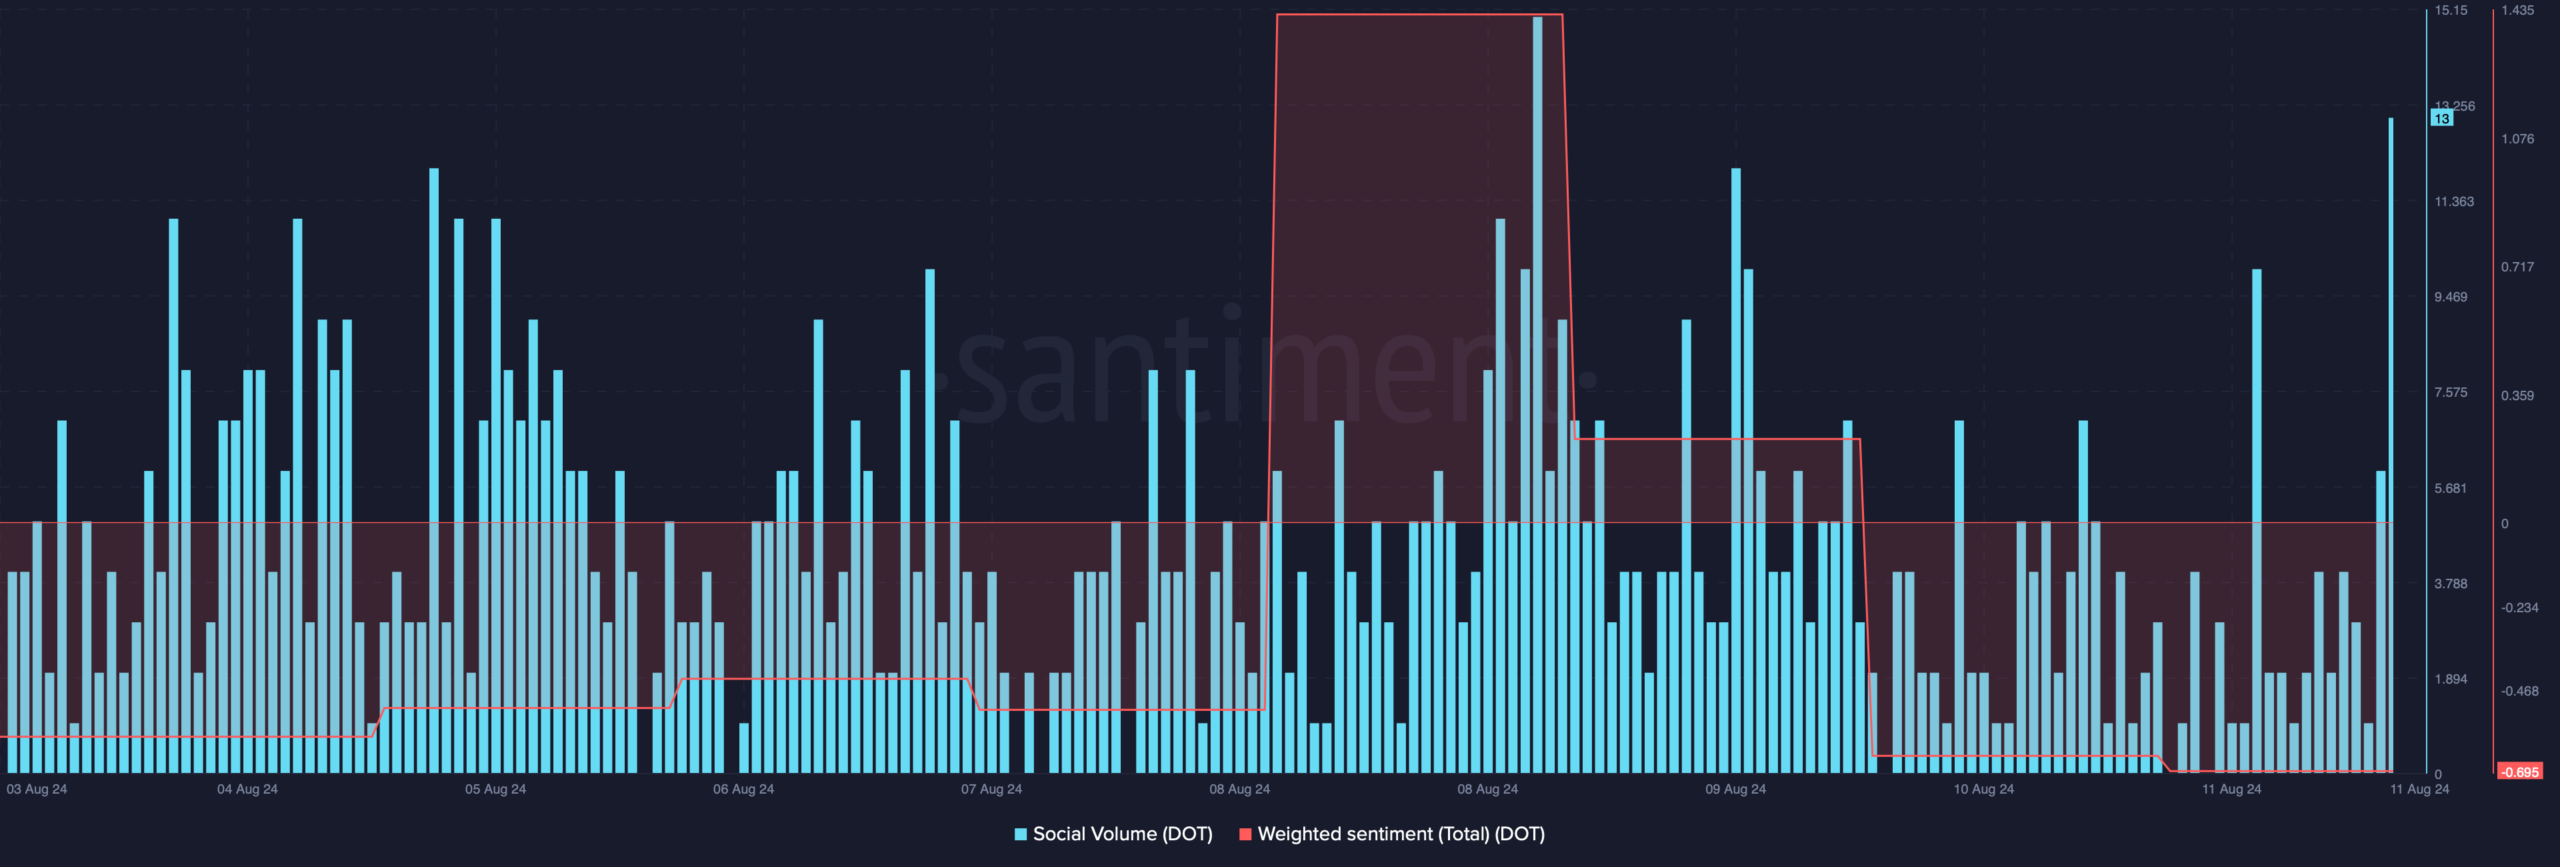
Source: Santiment
Meanwhile, ZAYK Charts, a popular crypto analyst, recently posted a tweet, highlighting an interesting development. As per the tweet, a bullish falling wedge pattern appeared on the token’s 2-day chart.
The pattern appeared in the beginning of 2024, and since then DOT has been consolidating inside the pattern. At press time, it was showing signs of a breakout.
In case that happens, then it might push Polkadot toward $10 in the coming weeks or months.

Source: X
Is a breakout possible?
AMBCrypto then assessed the token’s on-chain data to find out whether a breakout seemed likely. Our analysis of Santiment’s data revealed that DOT’s trading volume dropped along with its price.
This indicated that DOT might soon register greens.
Additionally, its open interest also stopped. Whenever the metric drops, it hints at a trend reversal.
Notable, while the price action remained volatile, DOT’s development activity remained high, a front on which DOT has dominated for several years.
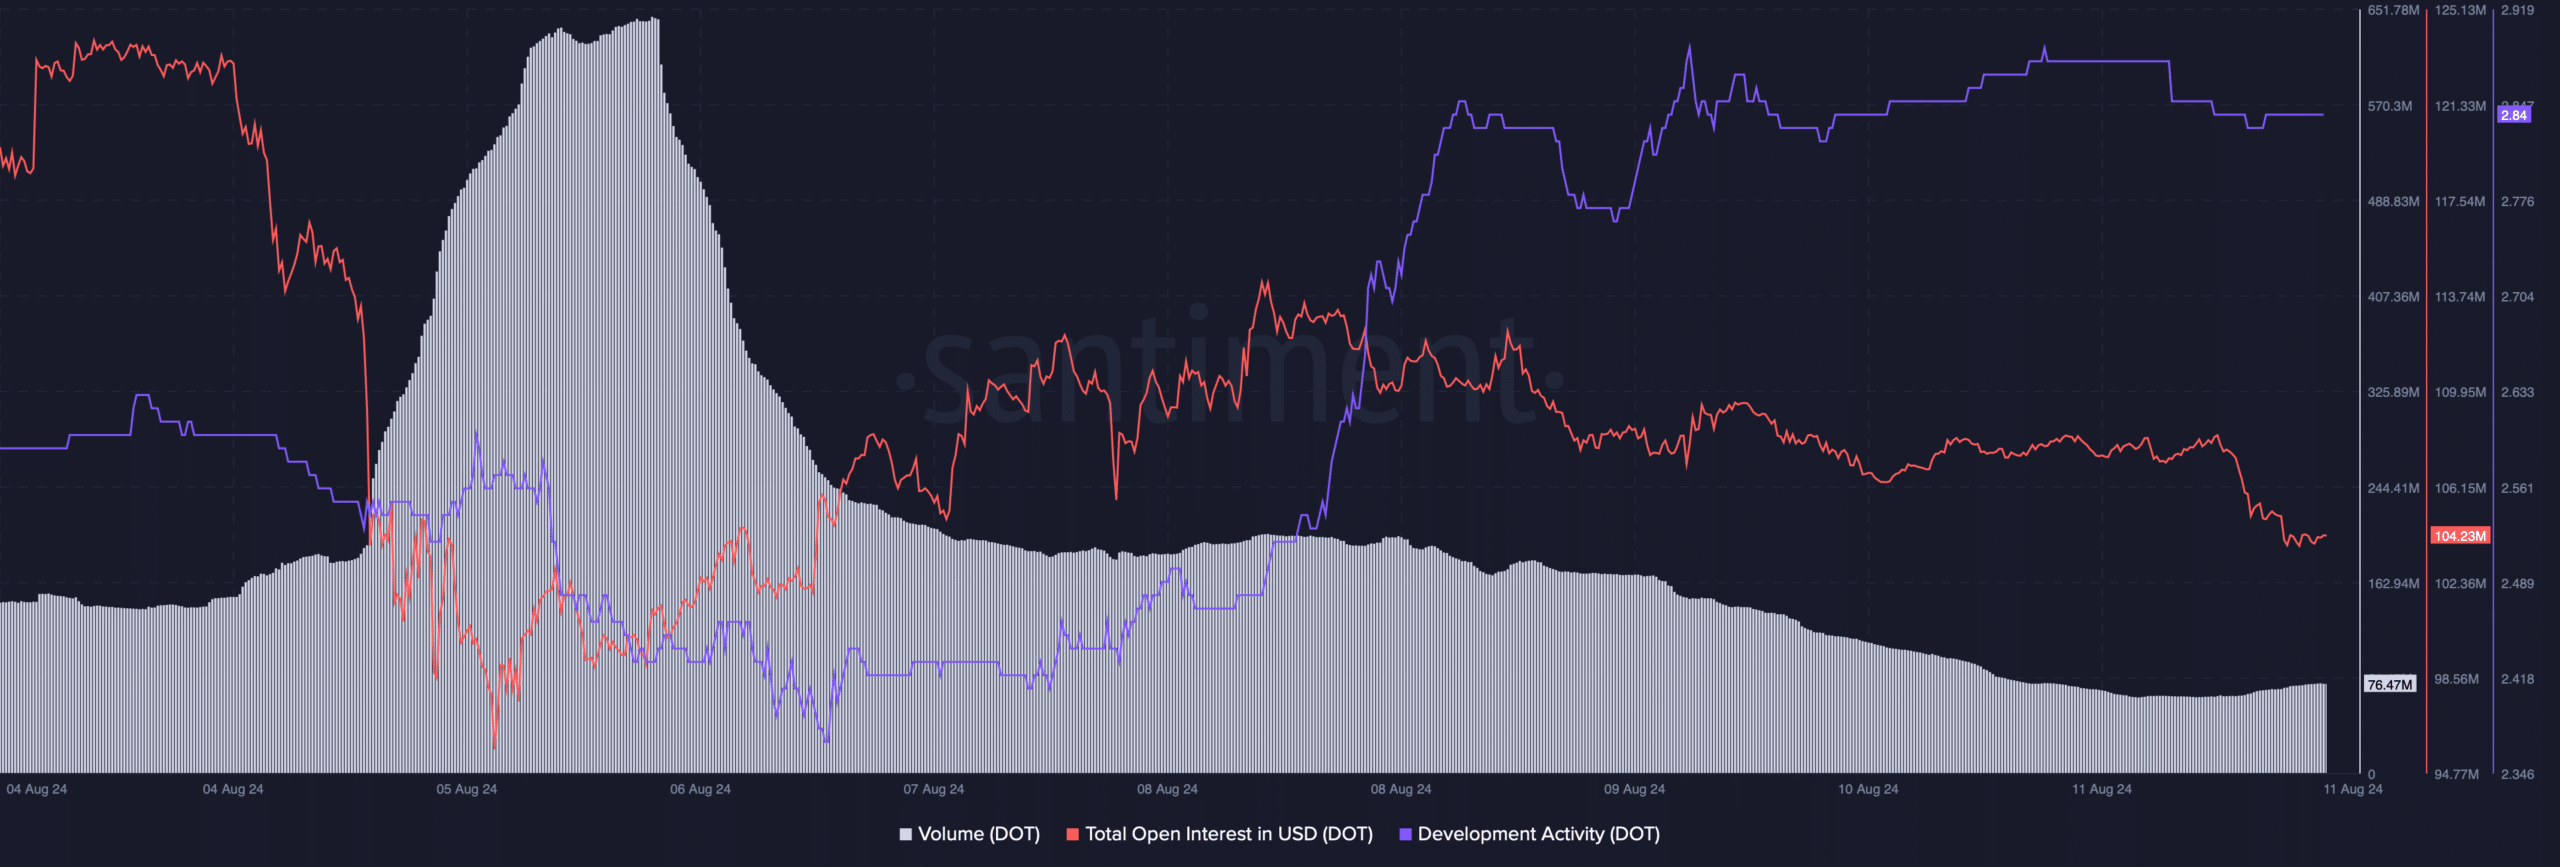
Source: Santiment
On top of that, at the time of writing, Polkadot’s fear and greed index was in a “fear” phase. Whenever that happens, it suggests that the chances of a price increase are high.
Therefore, AMBCrypto checked its daily chart to better understand what to expect. DOT’s price had rebounded after touching the lower limit of the Bollinger Bands.
Read Polkadot [DOT] Price Prediction 2024-2025
Moreover, the Chaikin Money Flow (CMF) also registered an uptick, which looked bullish.
In case the token turns bullish, it first has to test its resistance near its 20-day Simple Moving Average (SMA). A breakout above that level could initiate a rally.
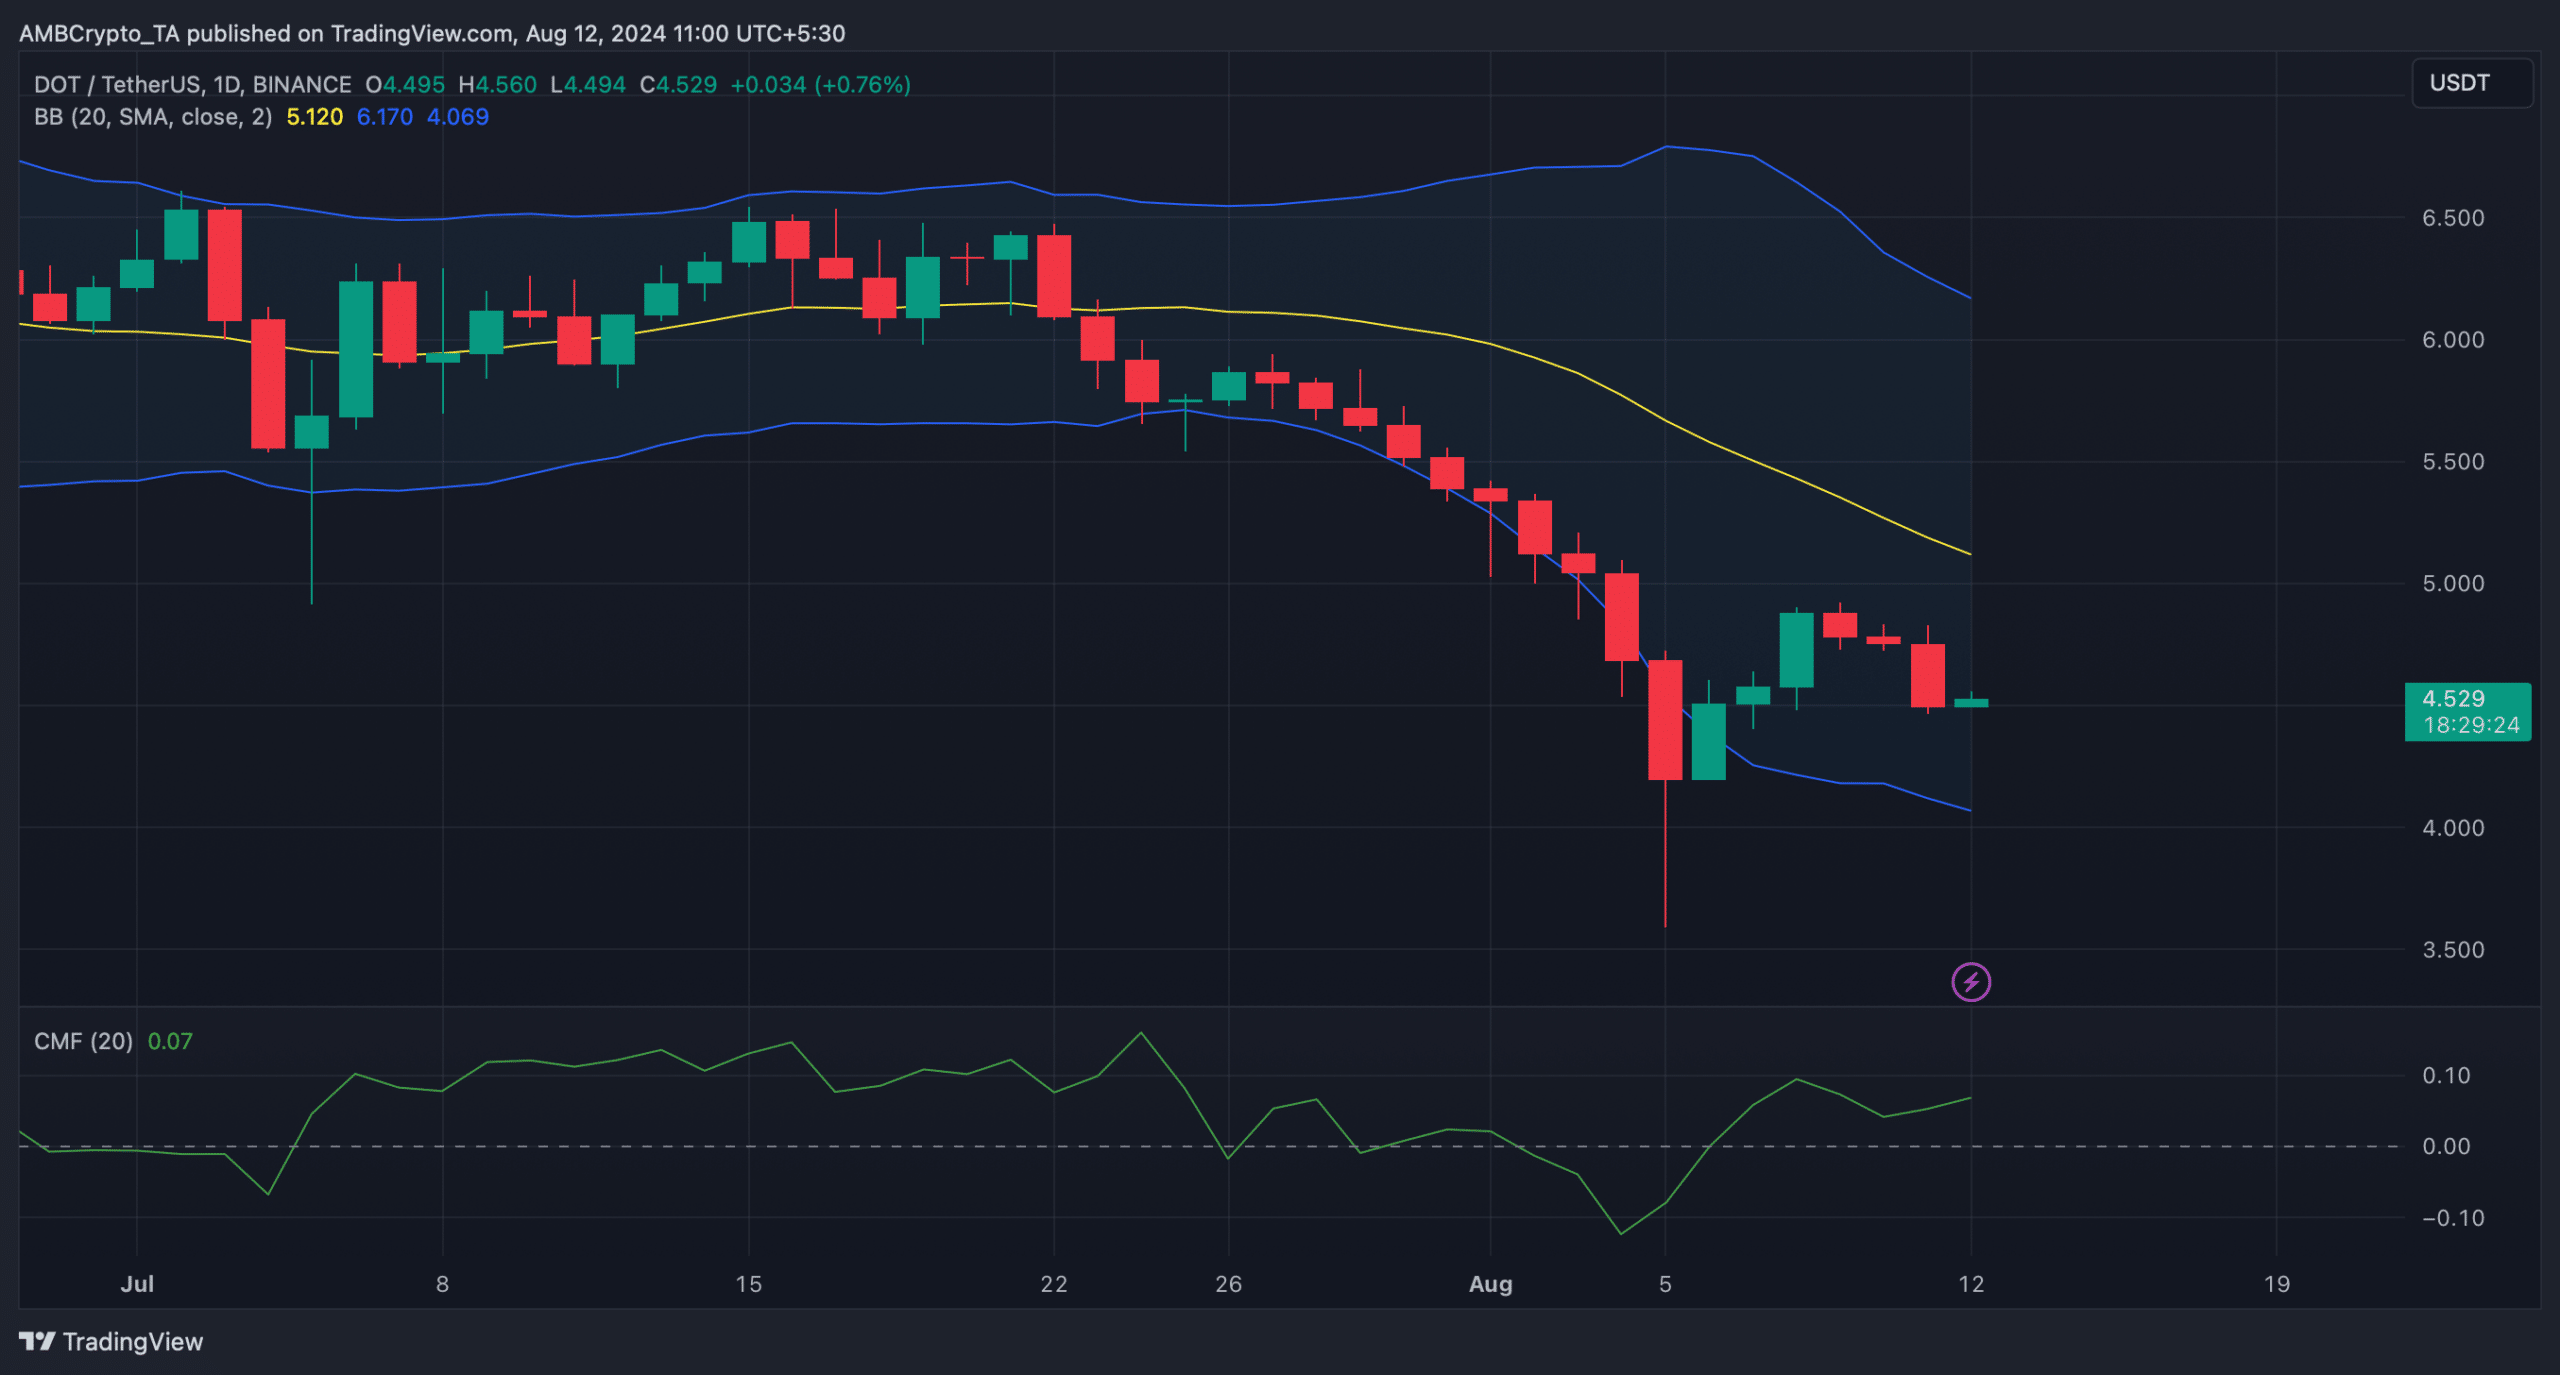
Source: TradingView