Polkadot: Assessing the odds of a bullish run from $4.24
DOT sustaining a bullish trend for the long term could be dependent on flipping the $5.23 resistance to support.

Disclaimer: The information presented does not constitute financial, investment, trading, or other types of advice and is solely the writer’s opinion.
- DOT’s bullish crossover on MACD highlighted growing bullish momentum.
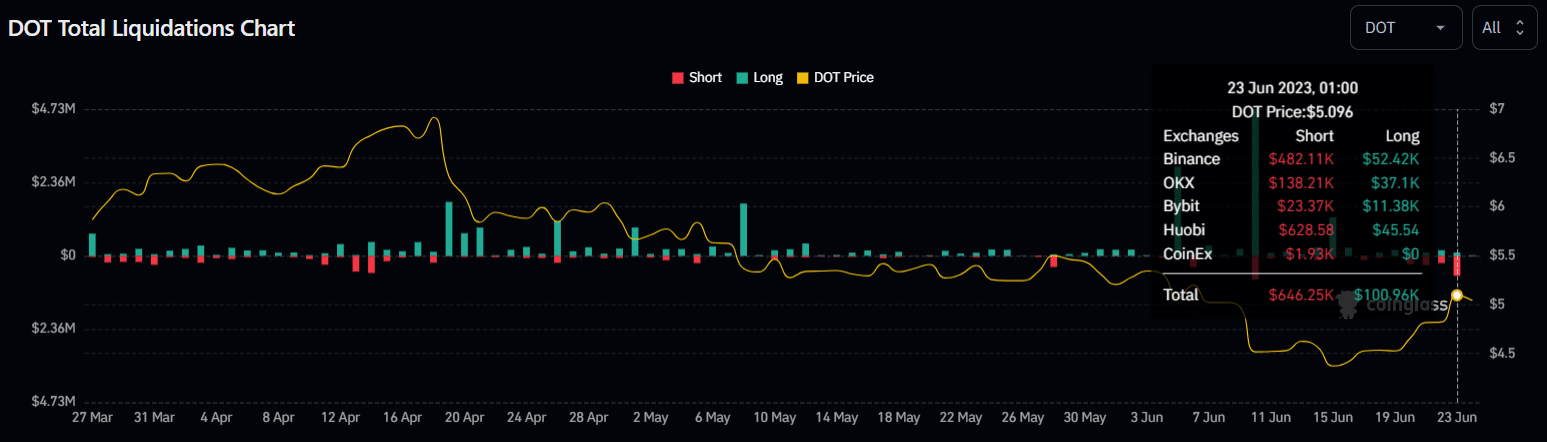
- Market speculators leaned bullish, as $646.25k shorts wrecked in the past 24 hours.
The extension of Polkadot’s [DOT] rally from the $4.24 support reached new heights with price touching the $5 mark. Building on the overall bullish market sentiment, DOT recorded 17.5% gains between 20 June and 23 June.
Realistic or not, here’s DOT’s market cap in BTC terms
With altcoins benefitting from Bitcoin [BTC] hitting $30k again, the bias supported a continuation of the upward momentum for DOT.
What lies next for bulls after hitting $5

The daily timeframe price chart of DOT showed a strong push by bulls from the $4.24 support level on 15 June. This level was last tested in January and it spurred a bullish trend for DOT, leading it to the year-high of $7.90.
While bulls revel in a return to the $5 price zone, a major hurdle lies at the $5.23 resistance level. The bearish flip of this level to resistance was a major low for bulls, as it had been fiercely defended over a month-long period.
Bulls reclaiming the $5.23 level will serve as confirmation of a shift in momentum, with further targets lying at $6.12 and $7.02 levels.
The bullish crossover, along with the green bars above the zero mark on the Moving Average Convergence Divergence (MACD) indicator, highlighted the growing bullish strength. In addition, the Relative Strength Indicator (RSI) stood at 55, hinting at increased buying pressure.
Alternatively, shorts could look to take advantage of a price rejection at the $5.23 level with $4.50 and $4.24 serving as profit-taking levels.
Longs or Shorts: what direction is the futures market leaning?

Is your portfolio green? Check out the DOT Profit Calculator
Despite the major hurdle lying at the $5.23 resistance level, most traders in the futures market leaned toward rising prices for DOT. As per Coinglass, longs held a 52.26% advantage on the long/short ratio. This reflected the increasing dominance of bullish positions.
Also, the liquidation data over the past 24 hours revealed that shorts had suffered 6x more wrecked positions than longs. Combined, it signaled that market speculators were actively betting on a sustained bullish push for DOT.