
- The breakdown from the bearish flag pattern and the failure to reclaim key EMAs suggested that the bears were firmly in control.
- In the coming days, the immediate support range in the $3.79-$4 zone will be essential to watch.
Polkadot [DOT] continued its long-term downtrend, confirming the bearish edge after recently breaking down from its bearish pattern on the daily chart.
This move came as the price struggled to cross the 50-day Exponential Moving Average (EMA) during the past few rallies, which has been a critical resistance level.
At the time of writing, DOT traded at approximately $4.19, down by nearly 0.5% in the last 24 hours. The price action indicated that DOT faced significant bearish pressure, with the 20-day EMA ($4.45), 50-day EMA ($4.91), and 200-day EMA ($6.11) acting as key resistance levels.
DOT bears provoked a patterned breakdown
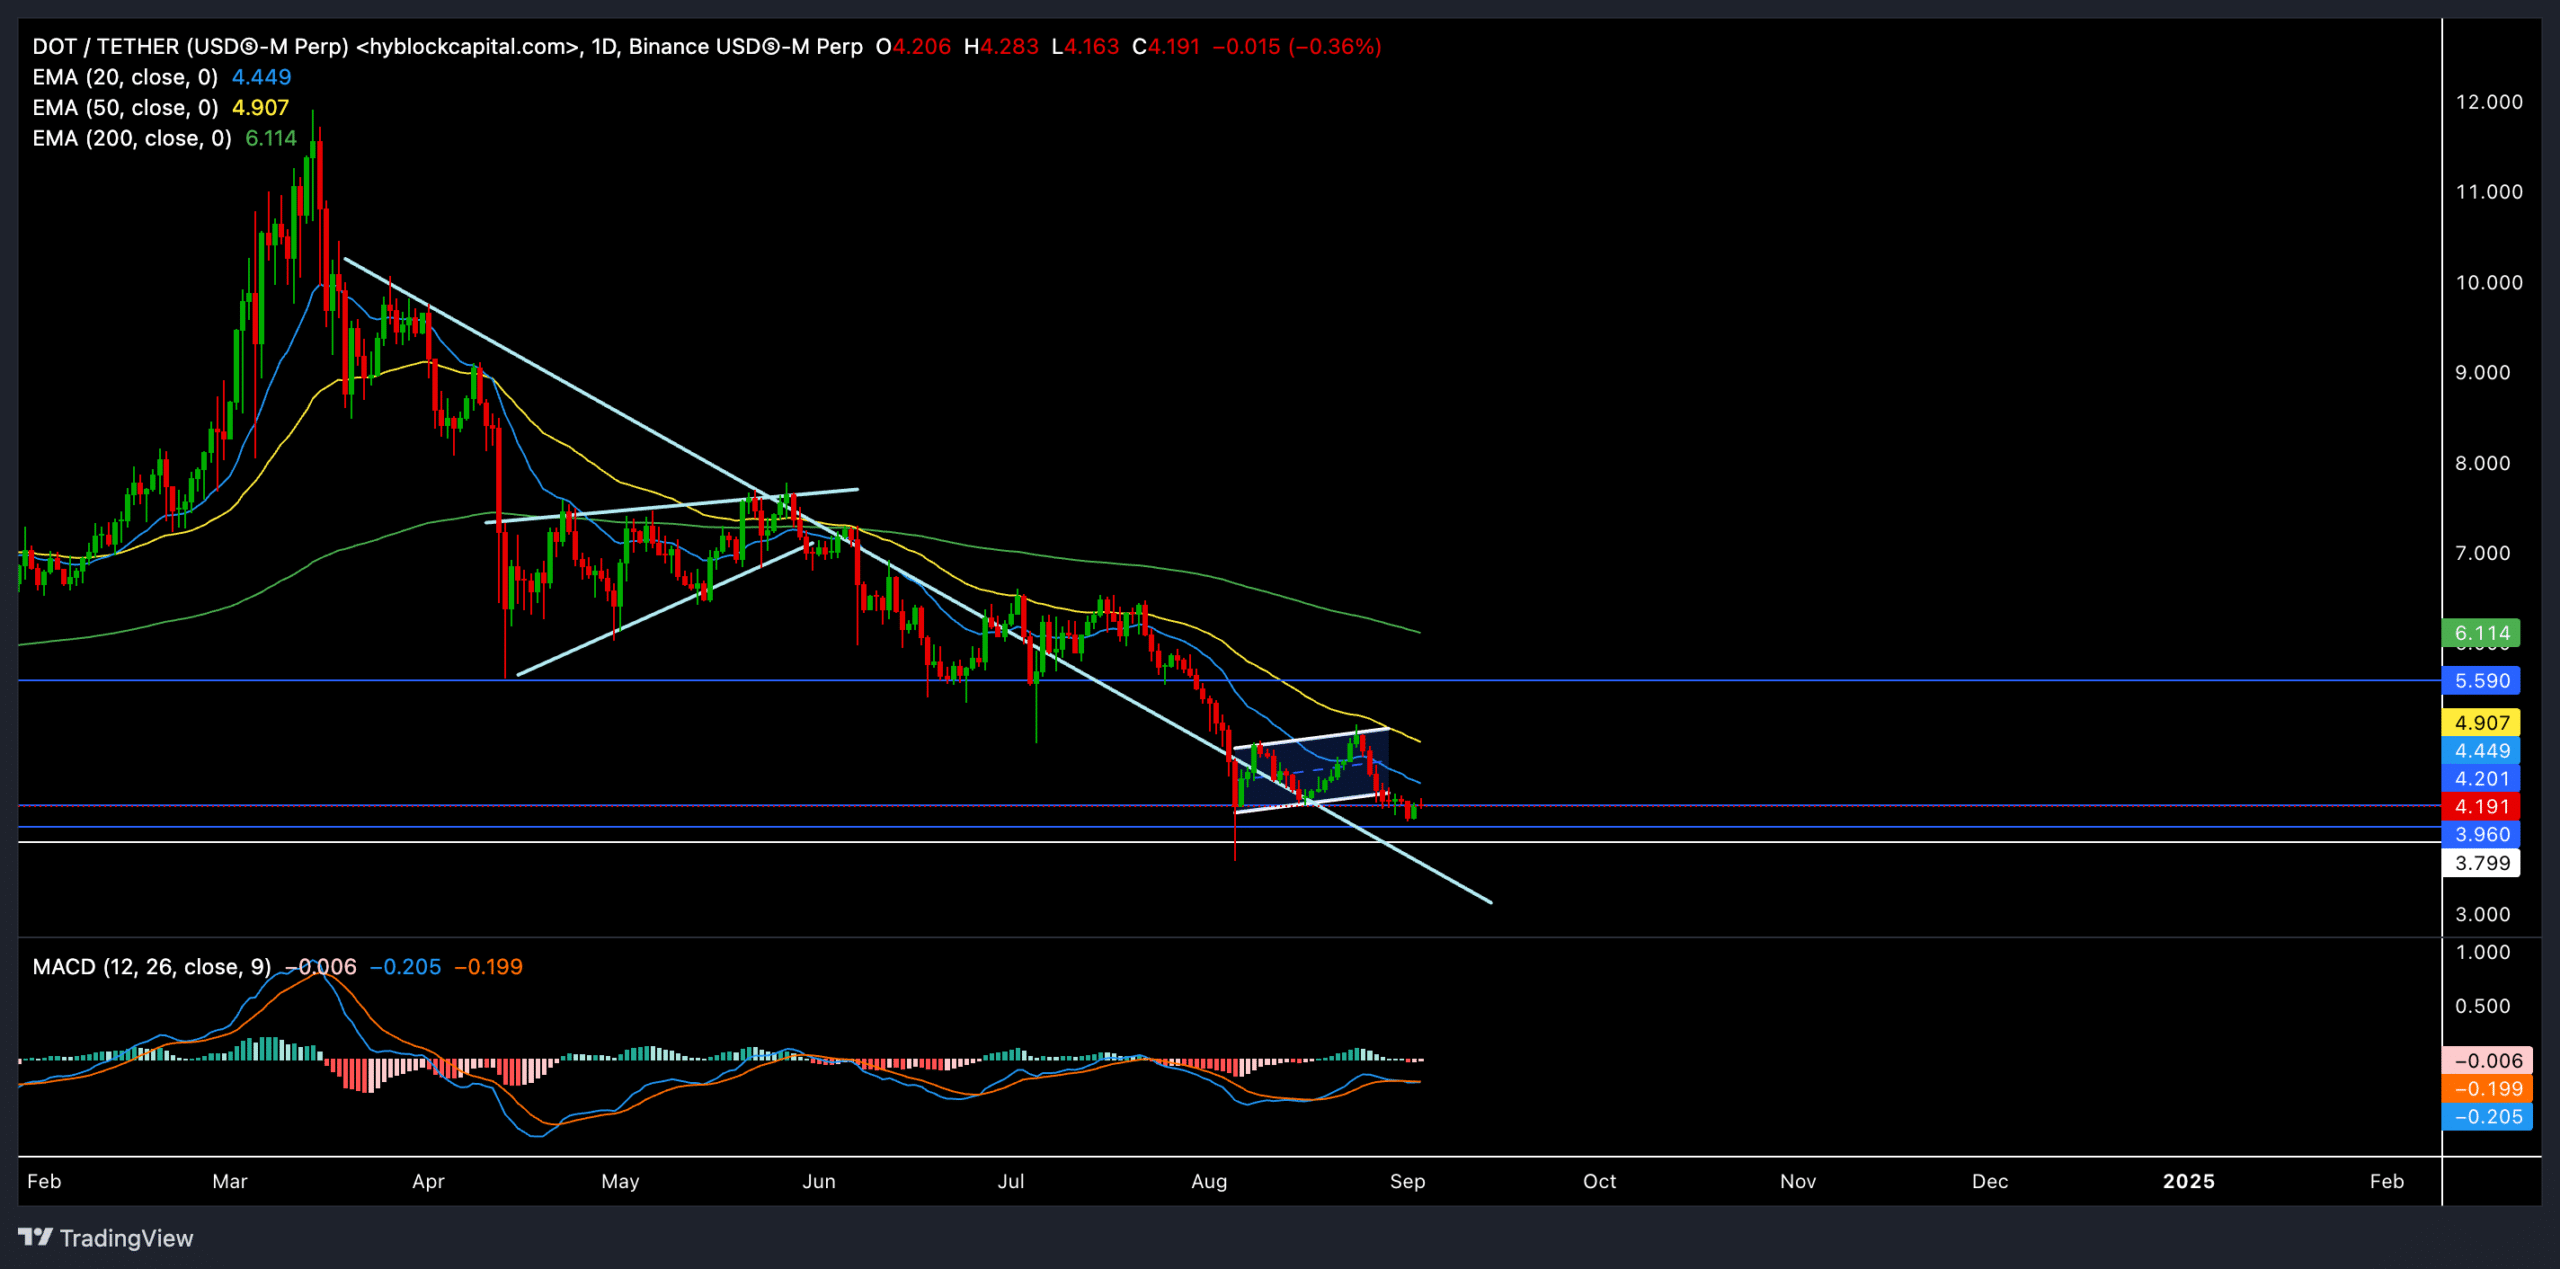
Source: TradingView DOT/USDT
The daily chart showed that DOT recently broke down from a bearish flag pattern, signaling continued downward momentum. The price action has been unable to reclaim the 20-day and 50-day EMAs, further reaffirming the bearish strength in the current market.
The next significant support level lies near $3.8, where a potential reversal could occur if the bears fail to break this level. However, if this support fails to hold, DOT could be on its way to retesting even lower levels, potentially revisiting the $3.6 zone.
Key levels to watch are resistance at $4.45 (20-day EMA), $4.91 (50-day EMA), and $5.5. When it comes to support, the levels to monitor are $3.79, and $3.5.
Given the current market structure, a break below the $4.0 level could accelerate the bearish momentum, pushing DOT toward the $3.79 support. Conversely, reclaiming the 50-day EMA could signal the start of a recovery phase, though this scenario appears less likely given the prevailing bearish sentiment.
Should BTC’s sentiment improve, DOT could retest its 50 EMA after a nearly 17% upside from its press time levels.
The Moving Average Convergence Divergence (MACD) indicator is currently bearish, with the MACD line dipping slightly below the signal line. This suggested that the bearish trend is still intact, and further downside pressure is expected unless a bullish crossover occurs.
Derivates data revealed some hope for bulls

Source: Coinglass
The long/short ratio in the derivatives market was at 1.0239, indicating a slight bullish preference among traders. On Binance, the long/short ratio for DOT/USDT is particularly high at 4.2854, showing a significant number of long positions relative to shorts.
Read Polkadot [DOT] Price Prediction 2024-2025
However, the overall market sentiment appears cautious, with the total open interest increasing by 0.45% to $184.80M despite a 21.52% drop in volume.
Traders should keep an eye on the MACD for any potential bullish crossovers and the broader market sentiment, particularly Bitcoin’s price movements, which could influence DOT’s direction.