Polkadot, Bitcoin Cash, Chainlink Price Analysis: 26 May

Altcoins like Polkadot [DOT] and Chainlink [LINK] have been reporting large gains since the beginning of the year. Even though the recent sell-off brought prices down to February levels, the market has been indicating signs of recovery.
Meanwhile, Bitcoin hard fork coin, Bitcoin Cash [BCH] also noted a bullish turn of events in its market.
Polkadot [DOT]
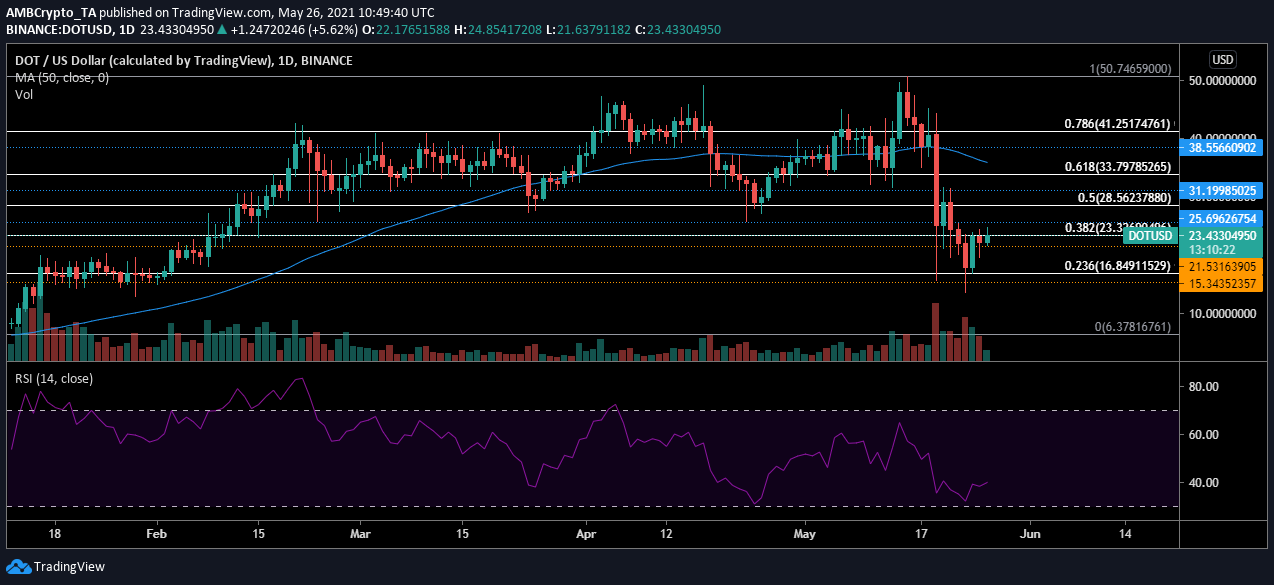
Polkadot slipped down from a peak of $50.74 in mid-May and has been trading lower since. After witnessing a massive 78% drop within eight days, DOT price began recovering and the digital asset was now valued at $23.41. As per the Fibonacci retracement levels, DOT was currently trying to push past the 23.6% trading range.
However, there was resistance at $25.69 and the price could remain between this level and stabilize. The rising buying pressure could help the price hit this resistance. Relative strength index suggested that the asset had reached the oversold zone, but as the market progresses, buying pressure was rising and currently, DOT was approaching equilibrium, where the buying and selling pressures were even.
Bitcoin Cash [BCH]
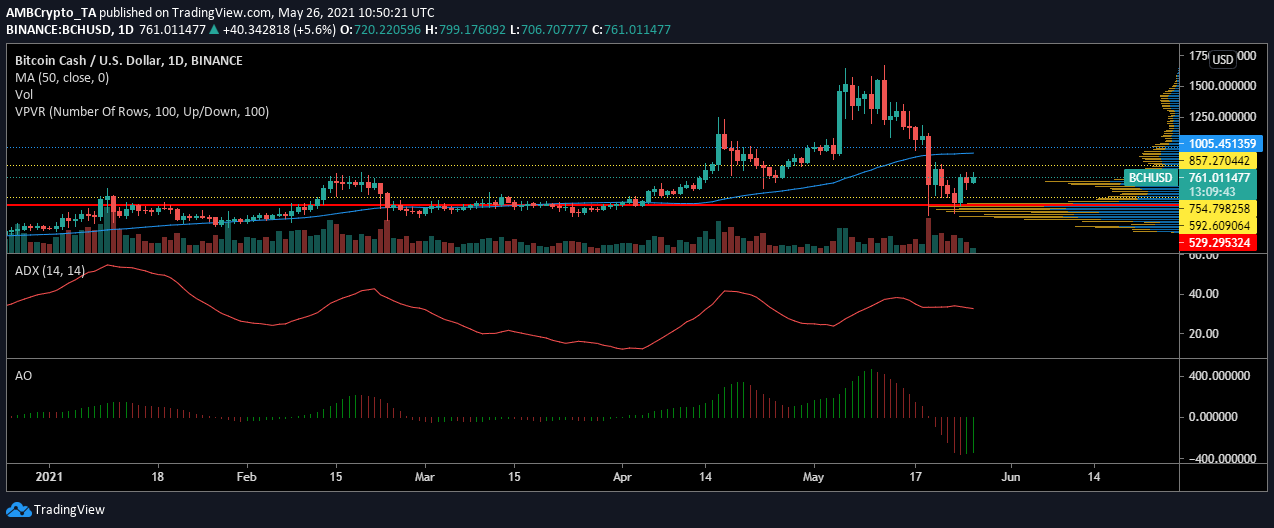
As the price crumbled due to massive selling on 19 May, the trend in the Bitcoin Cash market changed. The price crossed under the 50 moving average which was a bearish beginning for the BCH market. However, as seen in the above chart, the price bounced back.
The Visible range indicator also noted that maximum trading has taken place $529 in the current period. After $529, BCH traders have been highly trading at $754 and the price has remained close to this level. As the price held onto $773, ADX remained at 32 which meant that the current trend was receiving strength.
Meanwhile, the awesome oscillator was suggesting a rising bullishness in the market. However, momentum was still in the negative and could be at a cusp of a trend reversal.
Chainlink [LINK]

Chainlink and its oracles have received great adoption over the past year. The success of the decentralized finance project also helped its price to grow by 127% year-to-date. LINK experienced a downward curve in price but was quick to recover. LINK has been witnessing three consecutive days of growth but has hit resistance at $33.57.
As LINK traded at $32.65, the market was suggesting more bullishness to come. Markers of the Parabolic SAR indicators are aligned under the candlesticks which was the sign of an upward trending price. This rising price was also seeing ample volume supporting it.
Meanwhile, Stochastic RSI had just entered the normal trading range after remaining in the oversold zone. At 42, Stoch RSI suggested the LINK market was experiencing a higher buying pressure.