Polkadot, Bitcoin Cash, Solana Price Analysis: 30 May

Polkadot presented targets at $24.7 and $29 to trigger another bull run. Bitcoin Cash traded within a symmetrical triangle and awaited a breakout. Finally, Solana needed to reclaim $40-45 to enable a faster recovery.
Polkadot [DOT]
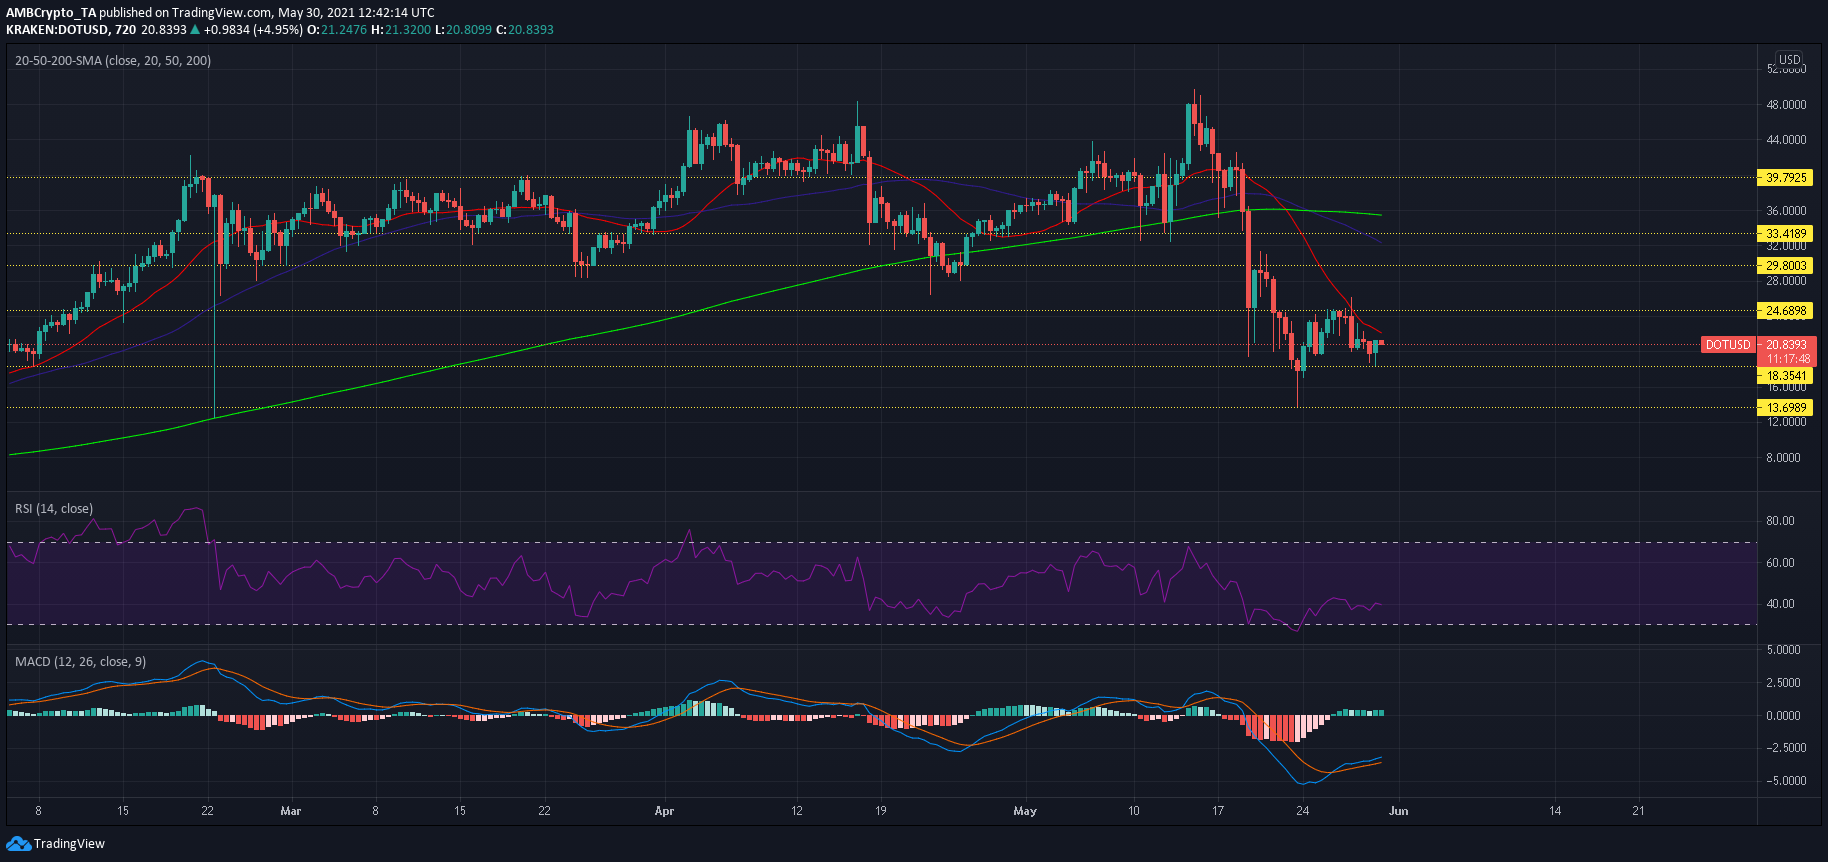
Polkadot presented key zones to reclaim between $24.7 and $29.8. Another important region rested at $33.4. These areas clashed with the 50-SMA (blue) and 200-SMA (green) and breaking above them could inject bullish sentiment for another price rally. On the other hand, bearish pressure would likely be countered between $13.7 and $18.35.
While MACD line was above the Signal line, DOT was yet to flip its bear market conditions. MACD’s move above the half-line would help in switching market dynamics. Similarly, RSI was also in bearish territory below 45.
Bitcoin Cash [BCH]
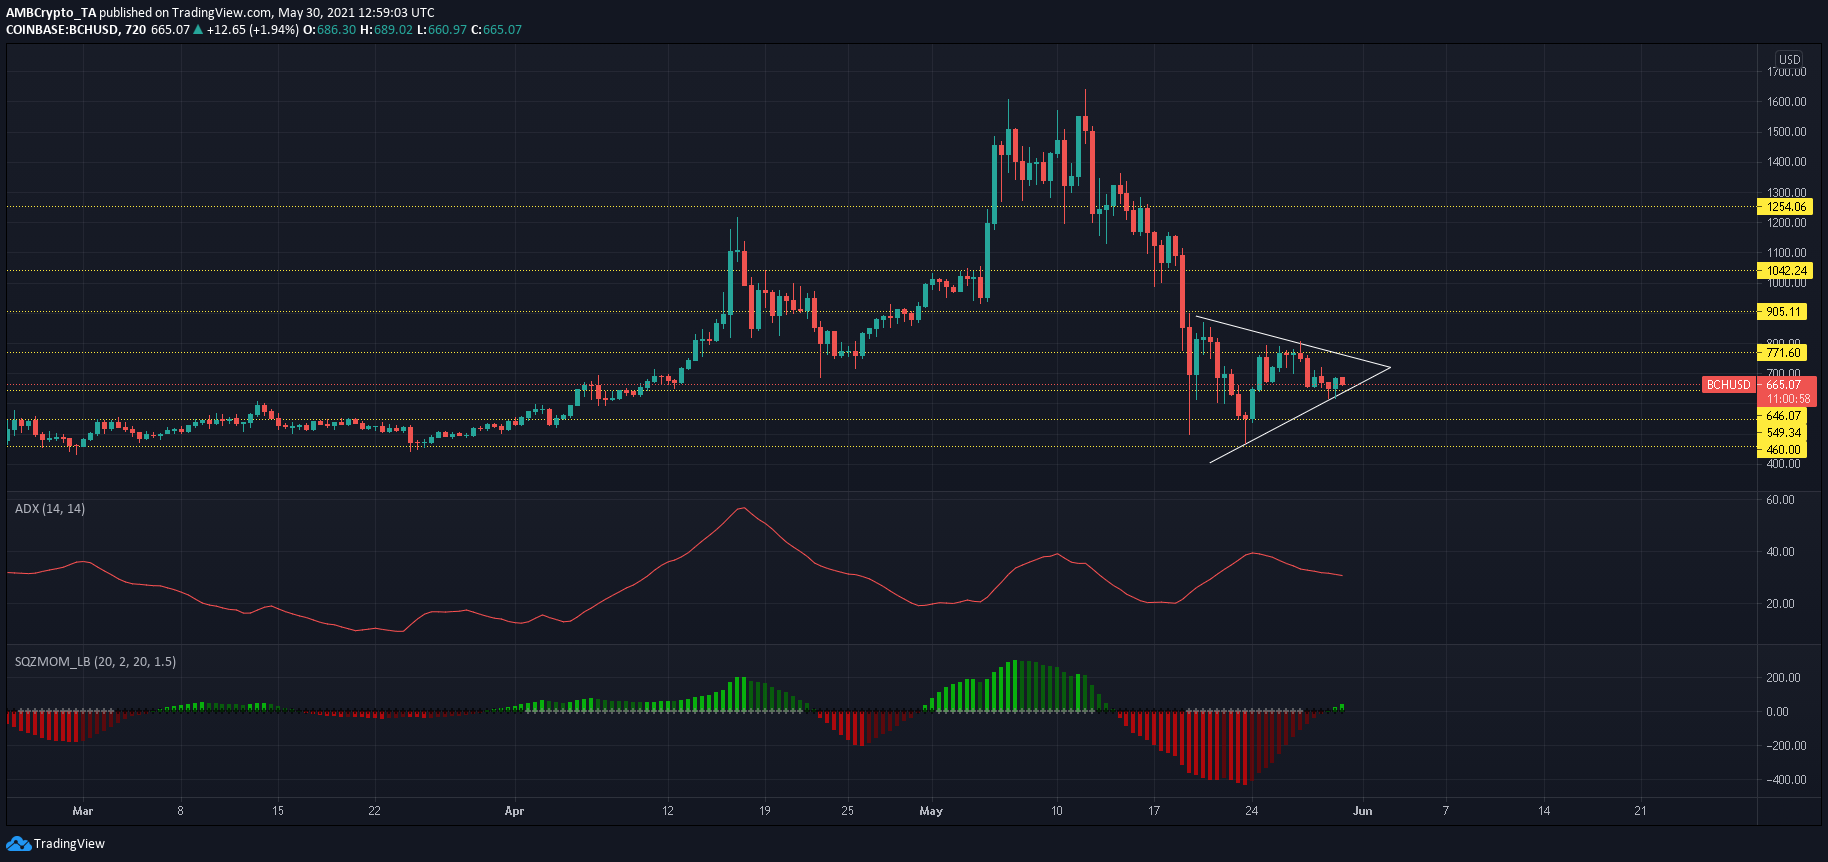
Bitcoin Cash formed a symmetrical triangle on its 12-hour chart and the direction of a breakout hinged on broader market cues. In case of a northbound break, BCH could see a 40% jump towards $1,024. A bearish outcome could see LTC drop towards $460- representing losses of 33%. According to ADX’s downtrend, the market was becoming less directional and this meant that BCH could oscillate within its pattern a while longer before a breakout.
Squeeze Momentum Indicator registered consecutive green bars but signs of low volatility were visible. This also meant that bulls could defend the lower trendline for a few more sessions.
Solana [SOL]

Solana’s Supertrend Indicator flashed a sell signal at the current price of $28.5 and placed a stop-loss between $40-45. Digging a little deeper into that area showed a confluence between the 50-SMA (blue) and resistance lines. Hence, this area remained key for the bulls moving forward. Support provided by 200-SMA (green) added some extra buffer around $25.1-support and chances of a breakdown were slim, barring bearish cues from the broader market.
MACD showed a bit of equilibrium between buyers and sellers at the time of writing. A bullish crossover and jump above half-line would certainly tilt the market in favor of the buyers.


