Polkadot: Can this metric aid with DOT price prediction
Polkadot’s nakamoto coefficient reached a value of 92. However, the token’s price action remained bearish.

- DOT was down by more than 3% in the last 24 hours alone.
- Liquidation was high, and market indicators looked bearish.
Polkadot [DOT] has maintained its streak of sitting on top of the list of key metrics that signifies the degree of decentralization. This can generally be perceived as a positive update, and the blockchain technology’s core value is decentralization.
But will this be enough for the token to register gains on its price chat?
Polkadot is getting more decentralized!
Polkadot Insider recently posted a tweet highlighting the blockchain’s nakamoto coefficient.
For starters, the metric indicates the minimum amount of work required to disrupt any specific blockchain. Whenever the metric increases, it clearly indicates that it is more difficult to break a blockchain, making it more decentralized.
https://twitter.com/PolkadotInsider/status/1735559440169079123?ref_src=twsrc%5Etfw
Coming back to the tweet, Polkadot Insider revealed that DOT’s nakamoto coefficient stood at 92. This was commendable, as back in April 2023, DOT’s metric was only at 70.
Apart from DOT, other notable blockchains that made it to the list include Mina Protocol [MINA], THORChain [RUNE], Avalanche [AVAX], and Solana [SOL]. However, decentralization alone might not be enough for DOT to make its investors profitable.
DOT’s bears have buckled up
Like several cryptos, DOT has also witnessed a price correction in the recent past. To be precise, in the last 23 hours alone, the token was down by over 3%.
As per CoinMarketCap, at the time of writing, Polkadot was trading at $7.13 with a market capitalization of over $8.9 billion.
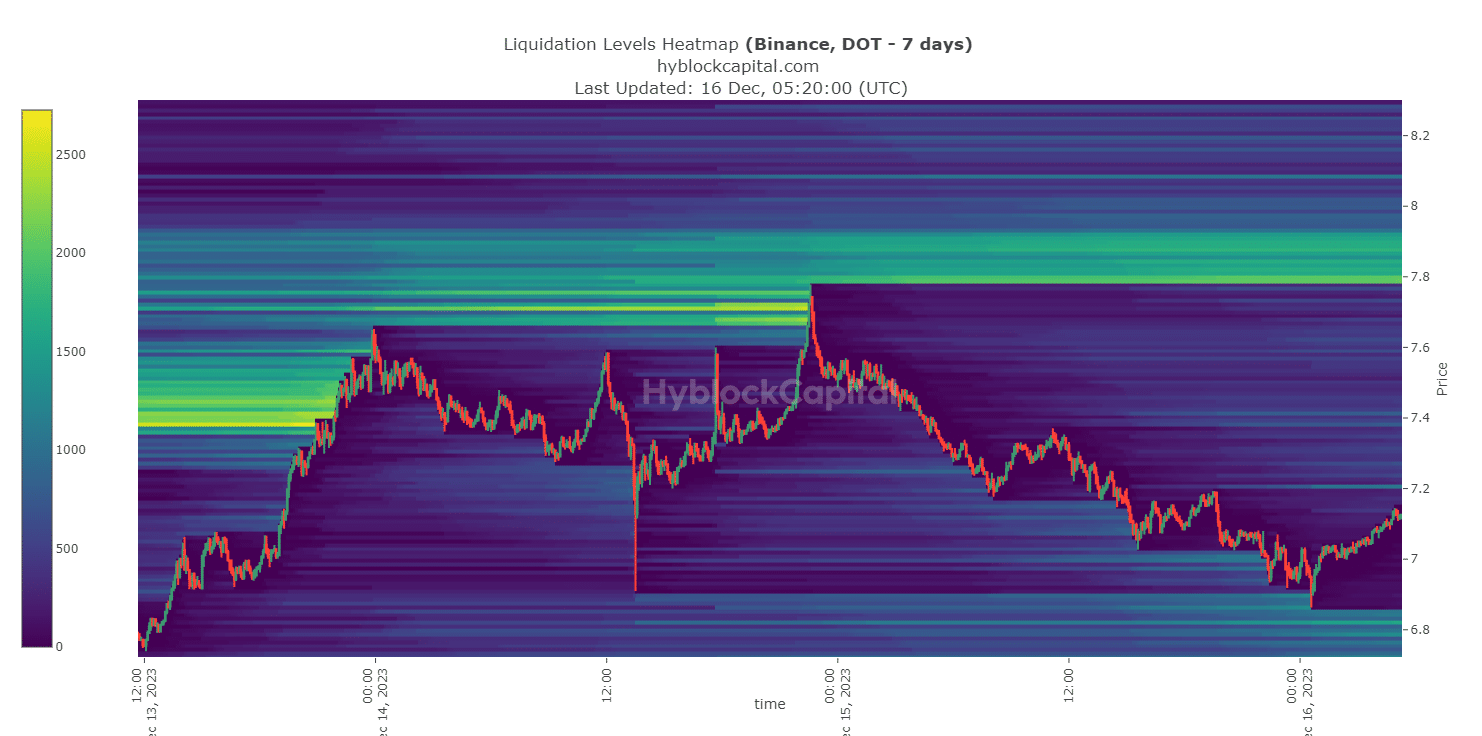
To see what went wrong, AMBCrypto took a look at the token’s liquidation levels.
Upon checking, we found that DOT failed to go above a key resistance level in the recent past. The token experienced a substantial hike in liquidation when its price reached $7.77, which resulted in a price correction.
It will be interesting to watch when the market revives and how soon DOT will be able to go above that level.
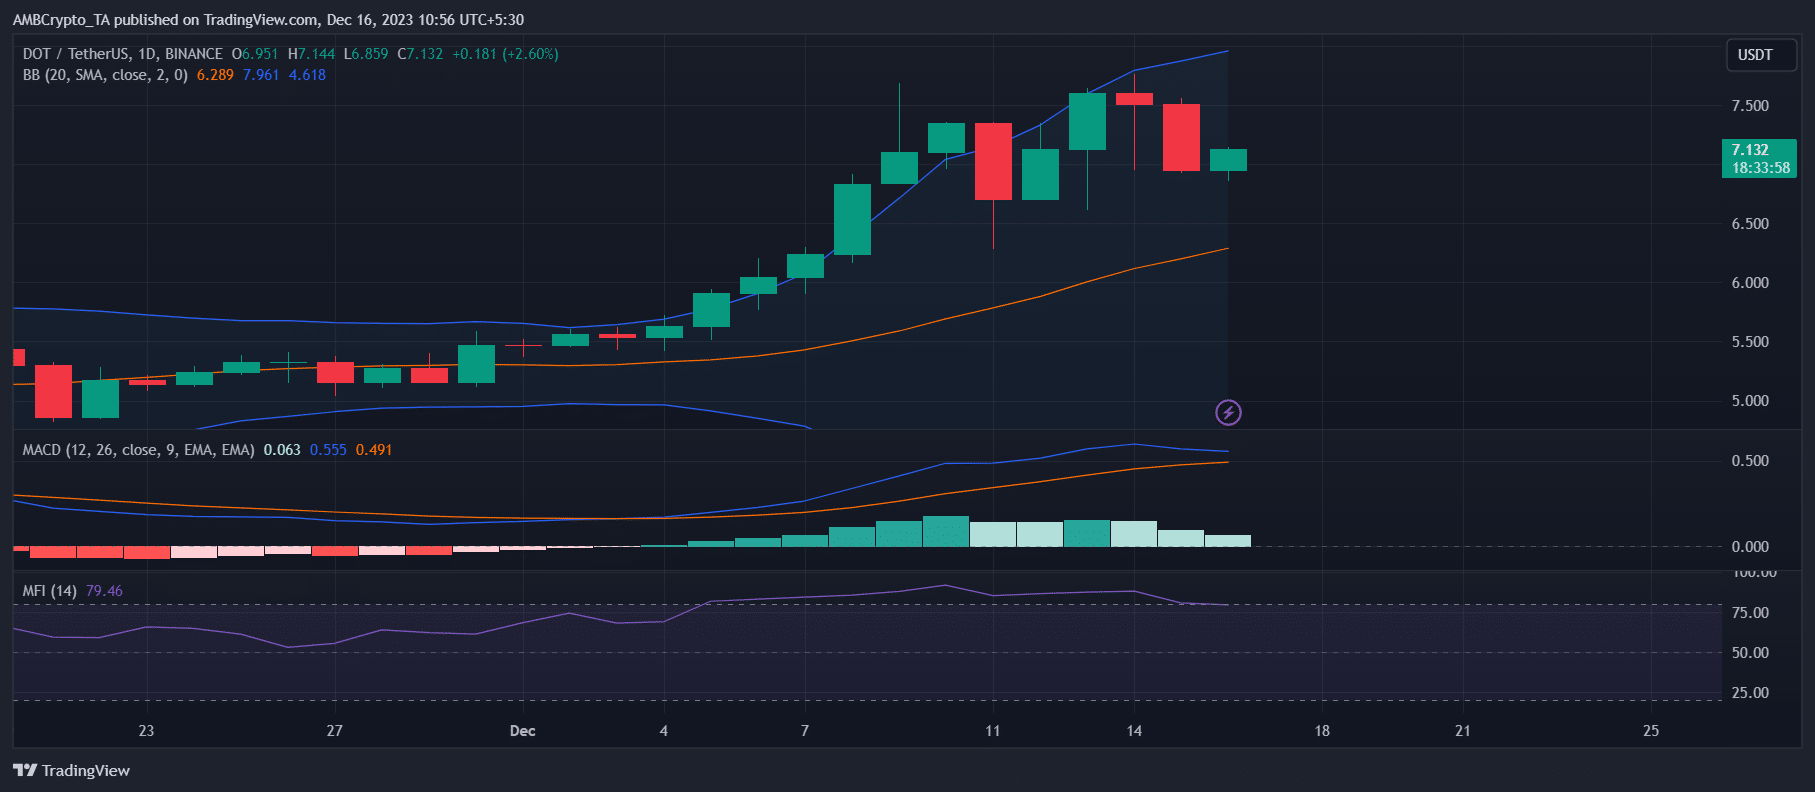
Therefore, AMBCrypto checked DOT’s daily chart to understand what to expect from Polkadot in the near term. Polkadot’s MACD displayed the possibility of a bearish crossover soon.
Read Polkadot’s [DOT] Price Prediction 2023-24
Its Money Flow Index (MFI) also registered a slight downtick from the overbought zone, meaning that selling pressure on the token was high.
The possibility of a further drop in price was pointed out by another indicator. DOT’s price touched the upper limit of the Bollinger Bands, which generally results in a price correction.