

The last 7 days have been very interesting, to say the least, for the crypto-market. While for most of the week the market seemed destined for more consolidation, Bitcoin bucked the trend after the Musk-driven hike yesterday. While the world’s largest cryptocurrency was back at square one at press time, it should be noted, however, that many of the market’s altcoins didn’t register corresponding hikes of their own. The price charts of Polkadot, Compound, and Algorand are a case in point.
Polkadot [DOT]
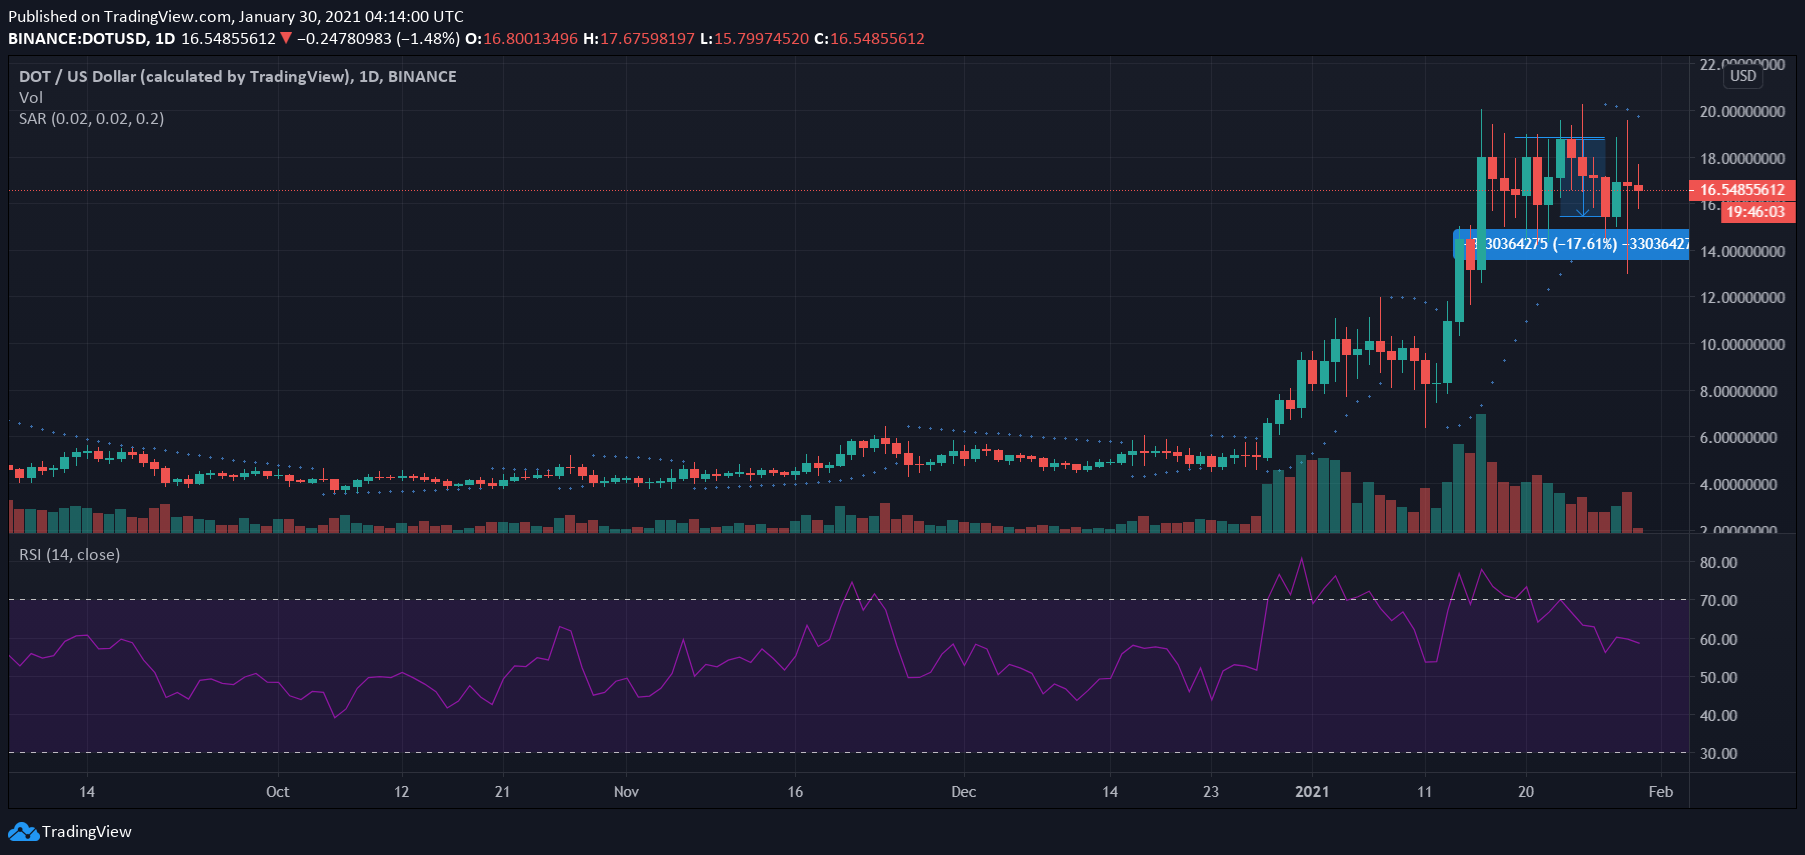
The market’s fourth-largest cryptocurrency at press time, DOT has recorded exponential growth over the past 45 days, especially in the month of January. Like most of the market, however, DOT didn’t record too many gains on the price charts. In fact, soon after DOT hit its ATH, corrections set in, with the crypto falling by almost 18%.
It should be noted though that the last few green candles seemed to suggest that recovery was afoot, with the crypto likely to climb again.
Interestingly, such optimism wasn’t shared by the crypto’s indicators as the Parabolic SAR’s dotted markers were well above the price candles and suggested bearishness, the Relative Strength Index was falling from the overbought zone. If the RSI continues to fall and ends up near or in the oversold zone, a sustained downtrend might be seen on DOT’s charts.
The cryptocurrency was in the news recently after it was revealed that crypto-asset manager Grayscale had incorporated a Polkadot trust.
Compound [COMP]

Contrary to the movement of most of the market’s altcoins, Compound has been surging on the charts lately, with the token climbing by over 52% in a week, at press time. It should be noted, however, that despite the said hike, the token was still well away from its June 2020 ATH of $372.
COMP’s performance, and the fact that it was backed by substantial trade volumes, was supported by the bullishness exhibited by the token’s technical indicators. While the mouth of the Bollinger Bands continued to expand to suggest that more near-term price volatility was likely, the Awesome Oscillator’s histogram flashed green and highlighted bullish market momentum.
Algorand [ALGO]
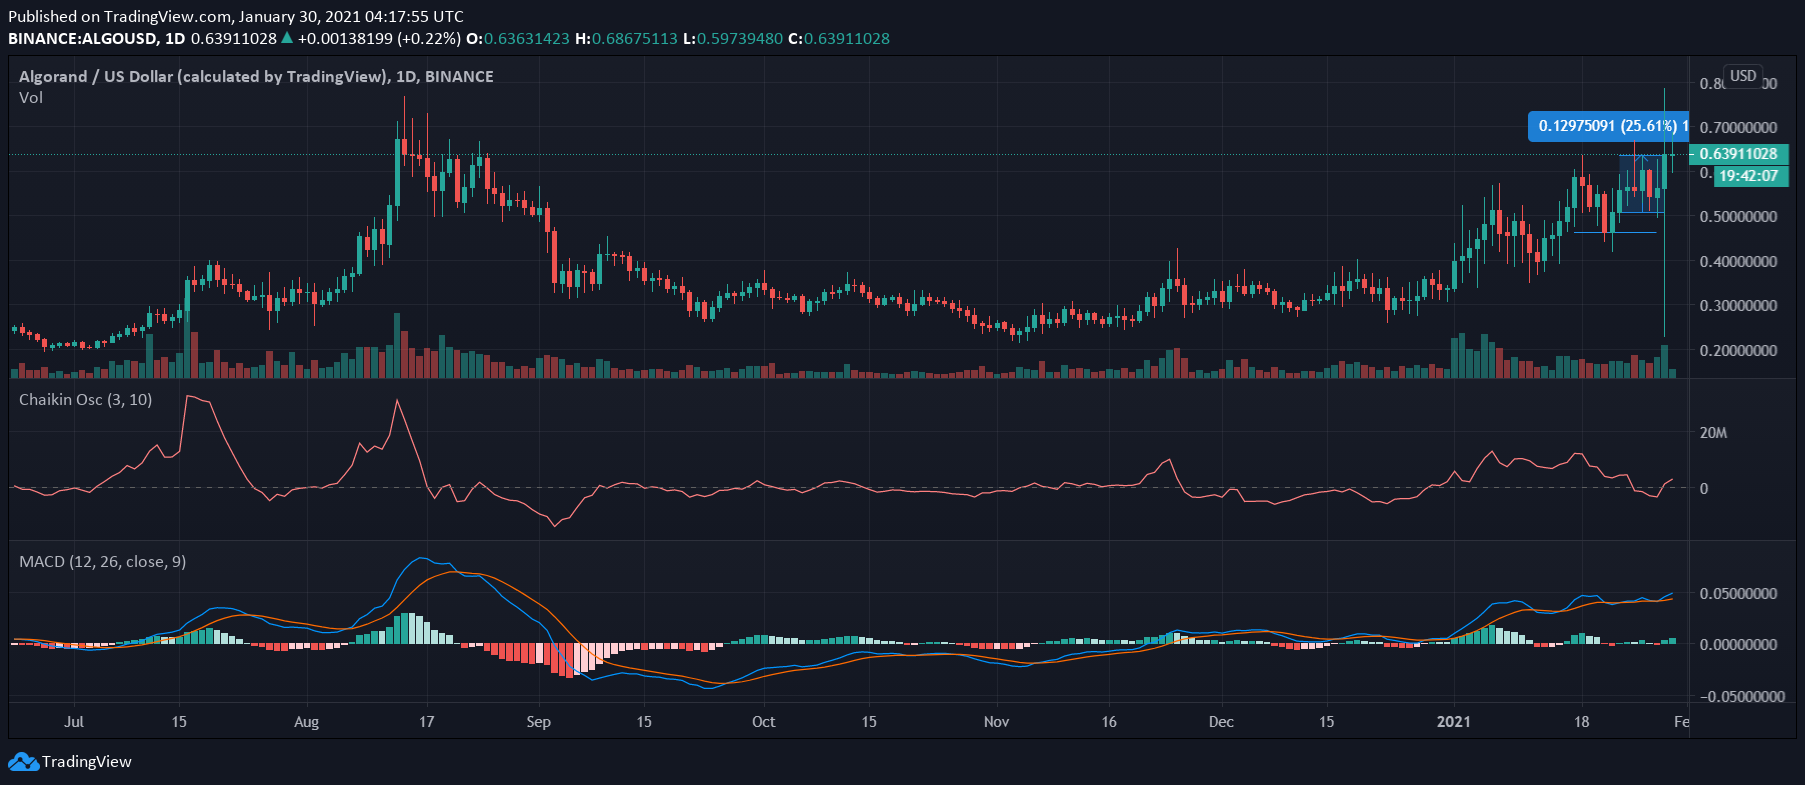
Like COMP, Algorand too has been on an uptrend in the month of January. While its own hike wasn’t as significant as the one registered by COMP, ALGO was still up by over 25% on the weekly timeframe. Oddly enough, one of the wicks on ALGO’s latest price candles fell to its November 2020 levels, before recovering.
It should also be noted that while that general market sentiment was bullish, the trade volumes in ALGO’s market at press time were significantly lower than the ones noted when the year began.
As far as the indicators were concerned, while the Chaikin Oscillator was well above zero, the MACD line was climbing past the Signal line after a bullish crossover.
Algorand made headlines recently after it teamed up with Curv to provide “trusted DeFi.”