Polkadot, Cosmos, Gala Price Analysis: 10 March

In the past few days, there has not been a clear trend for the crypto market. The trend has been bearish but when Bitcoin broke above the $39.4k, the near-term outlook appeared to have shifted to a bullish bias. Now, BTC was trading at $39.2k at the time of writing, and certain altcoins like Polkadot and Gala exhibited a range formation for the past few days. Will the range lows be revisited and are bulls strong enough to exert some buying pressure?
Polkadot (DOT)
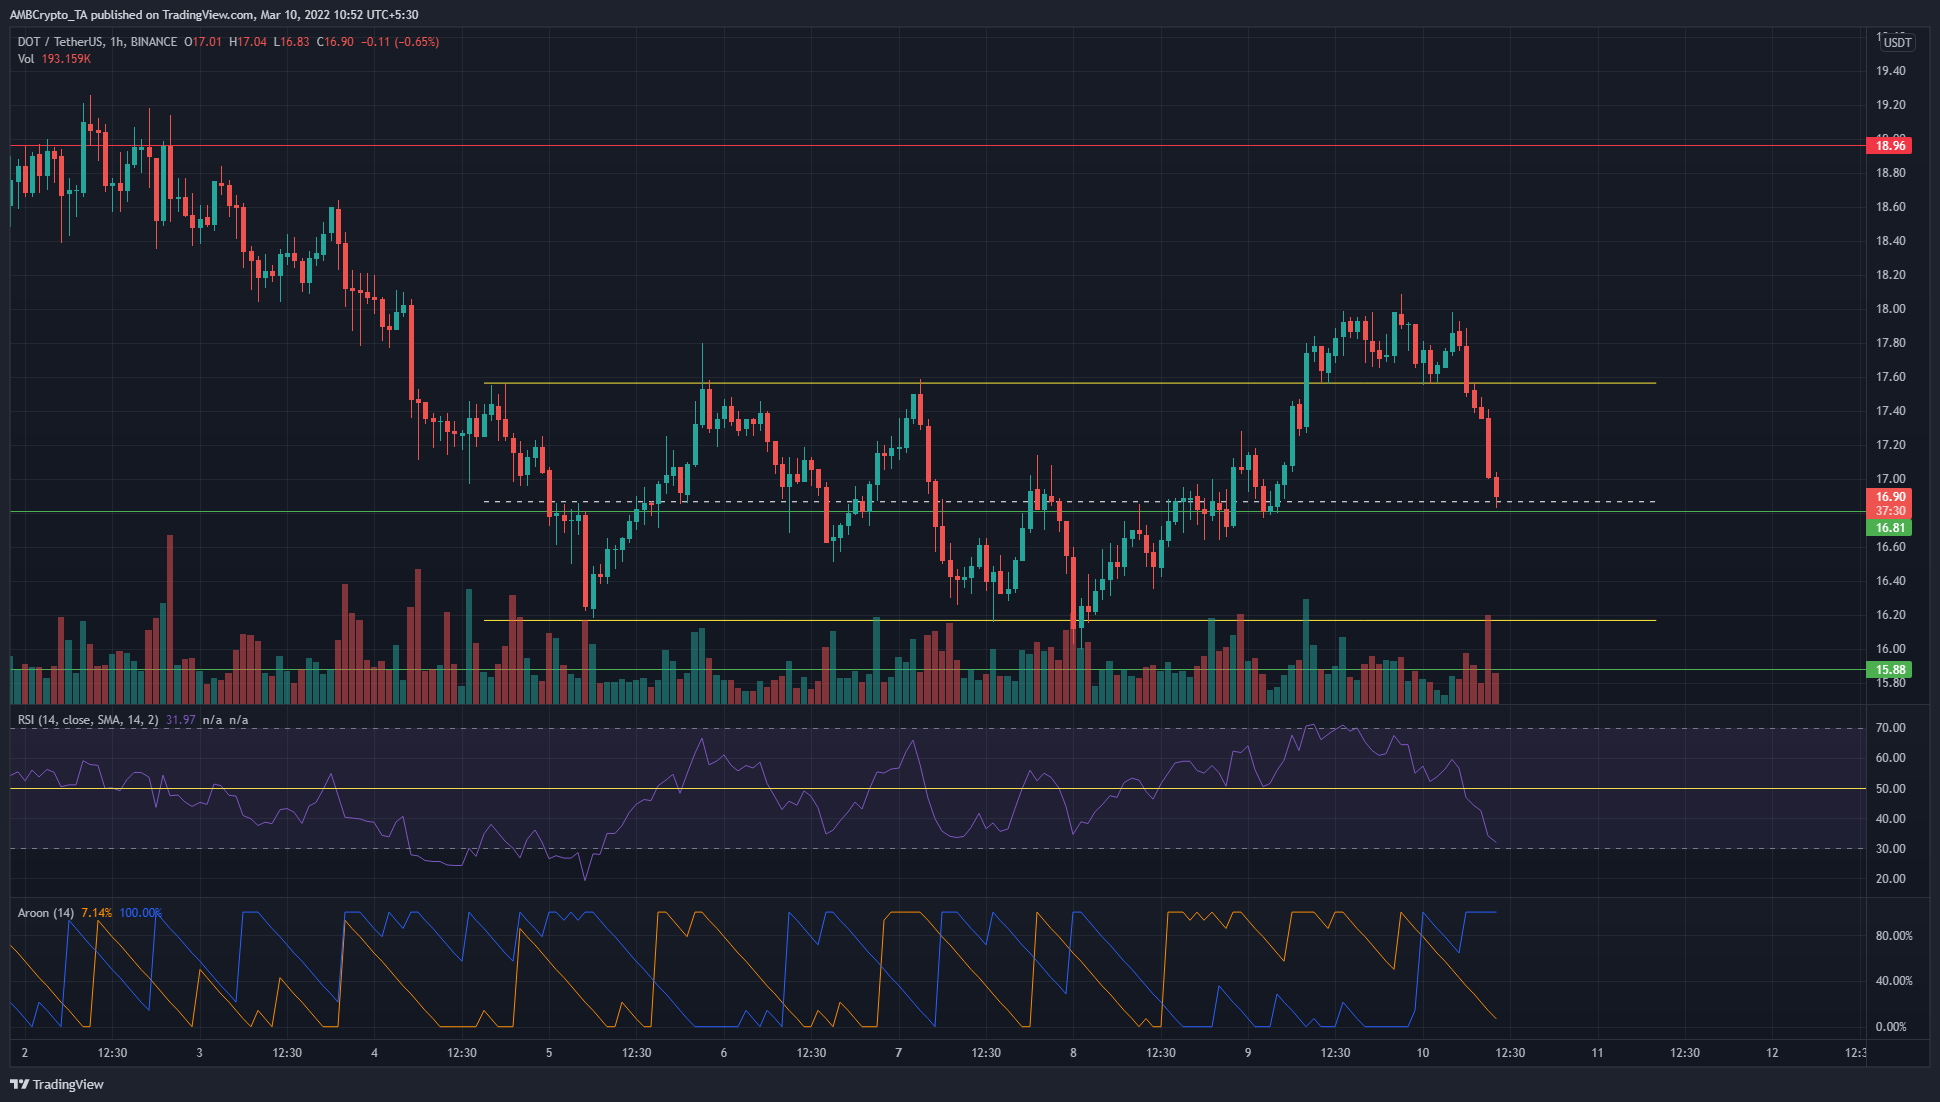
DOT formed a range (yellow) between $16.17 and $17.57 in the past few days. It appeared to flip the range highs at $17.6 to support in the past 24 hours but has since experienced heavy selling. It traded at $16.9, just above the $16.81 support.
The RSI dived below neutral 50 and the Aroon Indicator showed that the bullishness of the past couple of days had ended. The mid-point and the range lows could offer support for DOT in the next few hours.
Cosmos (ATOM)
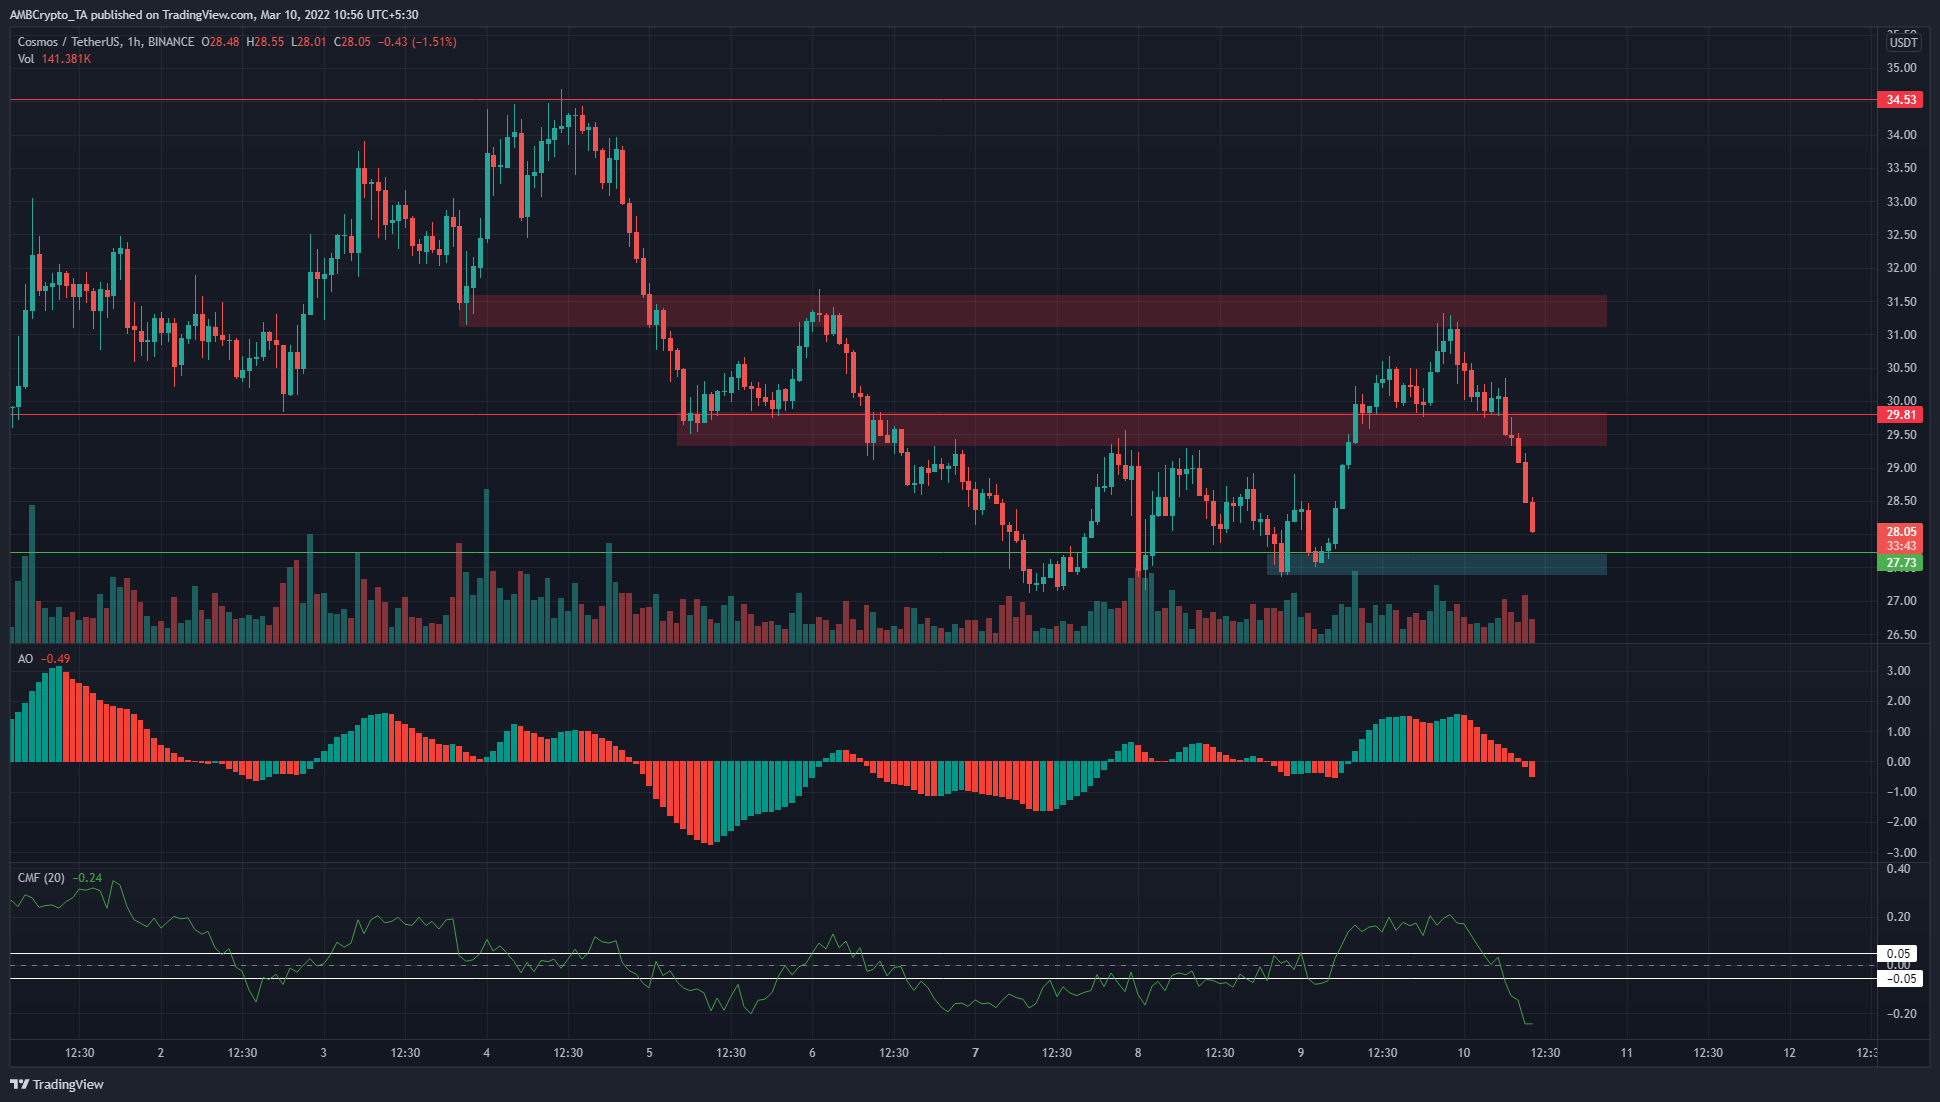
For Cosmos, there have been three levels of importance in the past week. These were the $27.7 support area, and the $29.8 and $31.5 resistance zones. In the past couple of days, ATOM found demand at $27.7 and had an impulse bullish move to $31.5. It was expected that $29.8 had been flipped to support.
Yet the recent selling forced price to move back toward the $27.7 demand zone. The Awesome Oscillator crossed over beneath the zero line to show bearish momentum, while the CMF stood at -0.24 to show significant capital flow out of the market.
Gala (GALA)
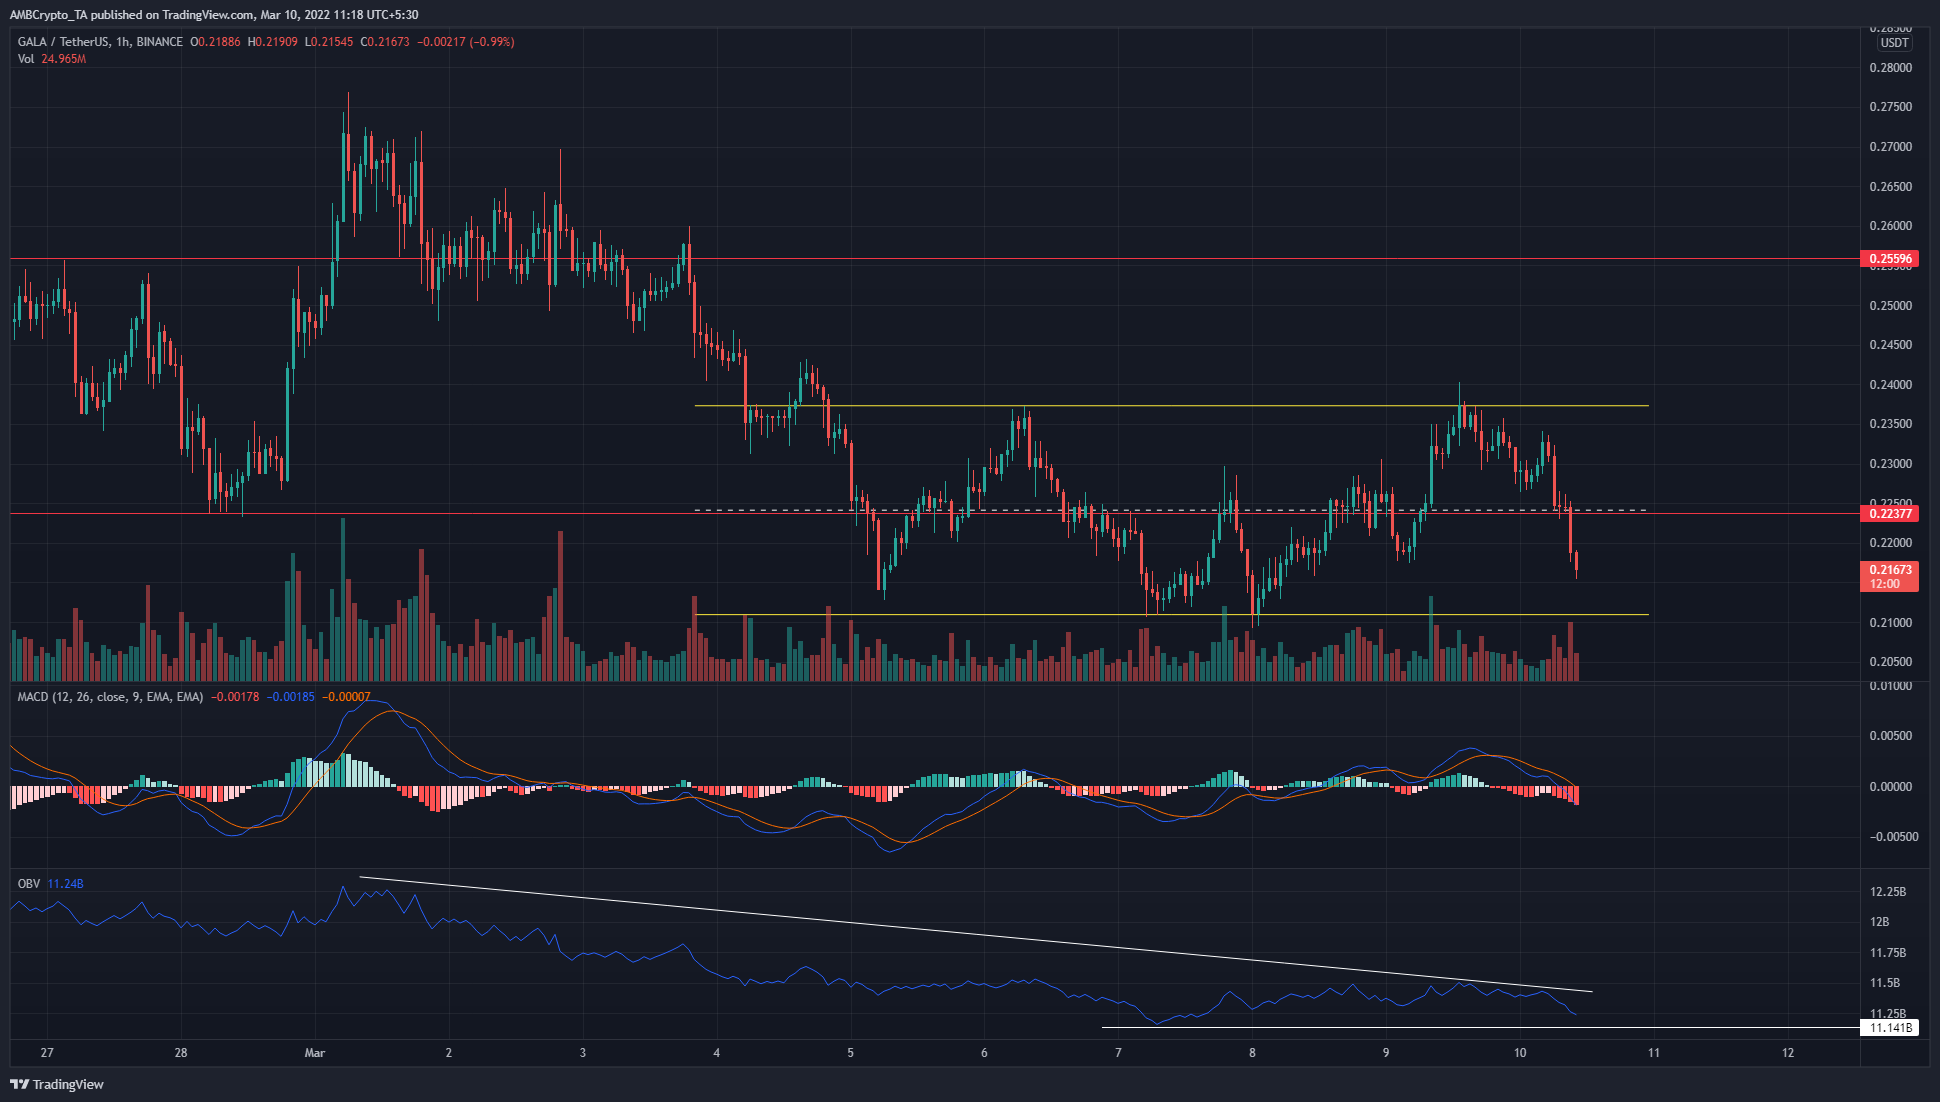
GALA also formed a short-term range (yellow) on the charts. At the time of writing, it had fallen below the $0.223 level. The OBV showed that sellers have been dominant in the past week. There was some pushback from buyers in the past couple of days, which saw the MACD climb past the zero line as GALA rose from the range lows at $0.21 to $0.235.
Once more, the range lows could be retested by the price. The MACD was below the zero line once again as bearish momentum solidified.