Polkadot, Cronos, FTX Token Price Analysis: 18 May

The overall market structure reshaped itself into a low volatile, compression phase in the last few days. As a result, Polkadot, Cronos, and FTX Token witnessed short-bodied candlesticks after approaching their high liquidity areas. Thus, hitting a near-term plateau on their charts.
The bulls still needed to inflict an uptick in the buying volumes to prevent the ongoing bearish tendencies in the market.
Polkadot (DOT)
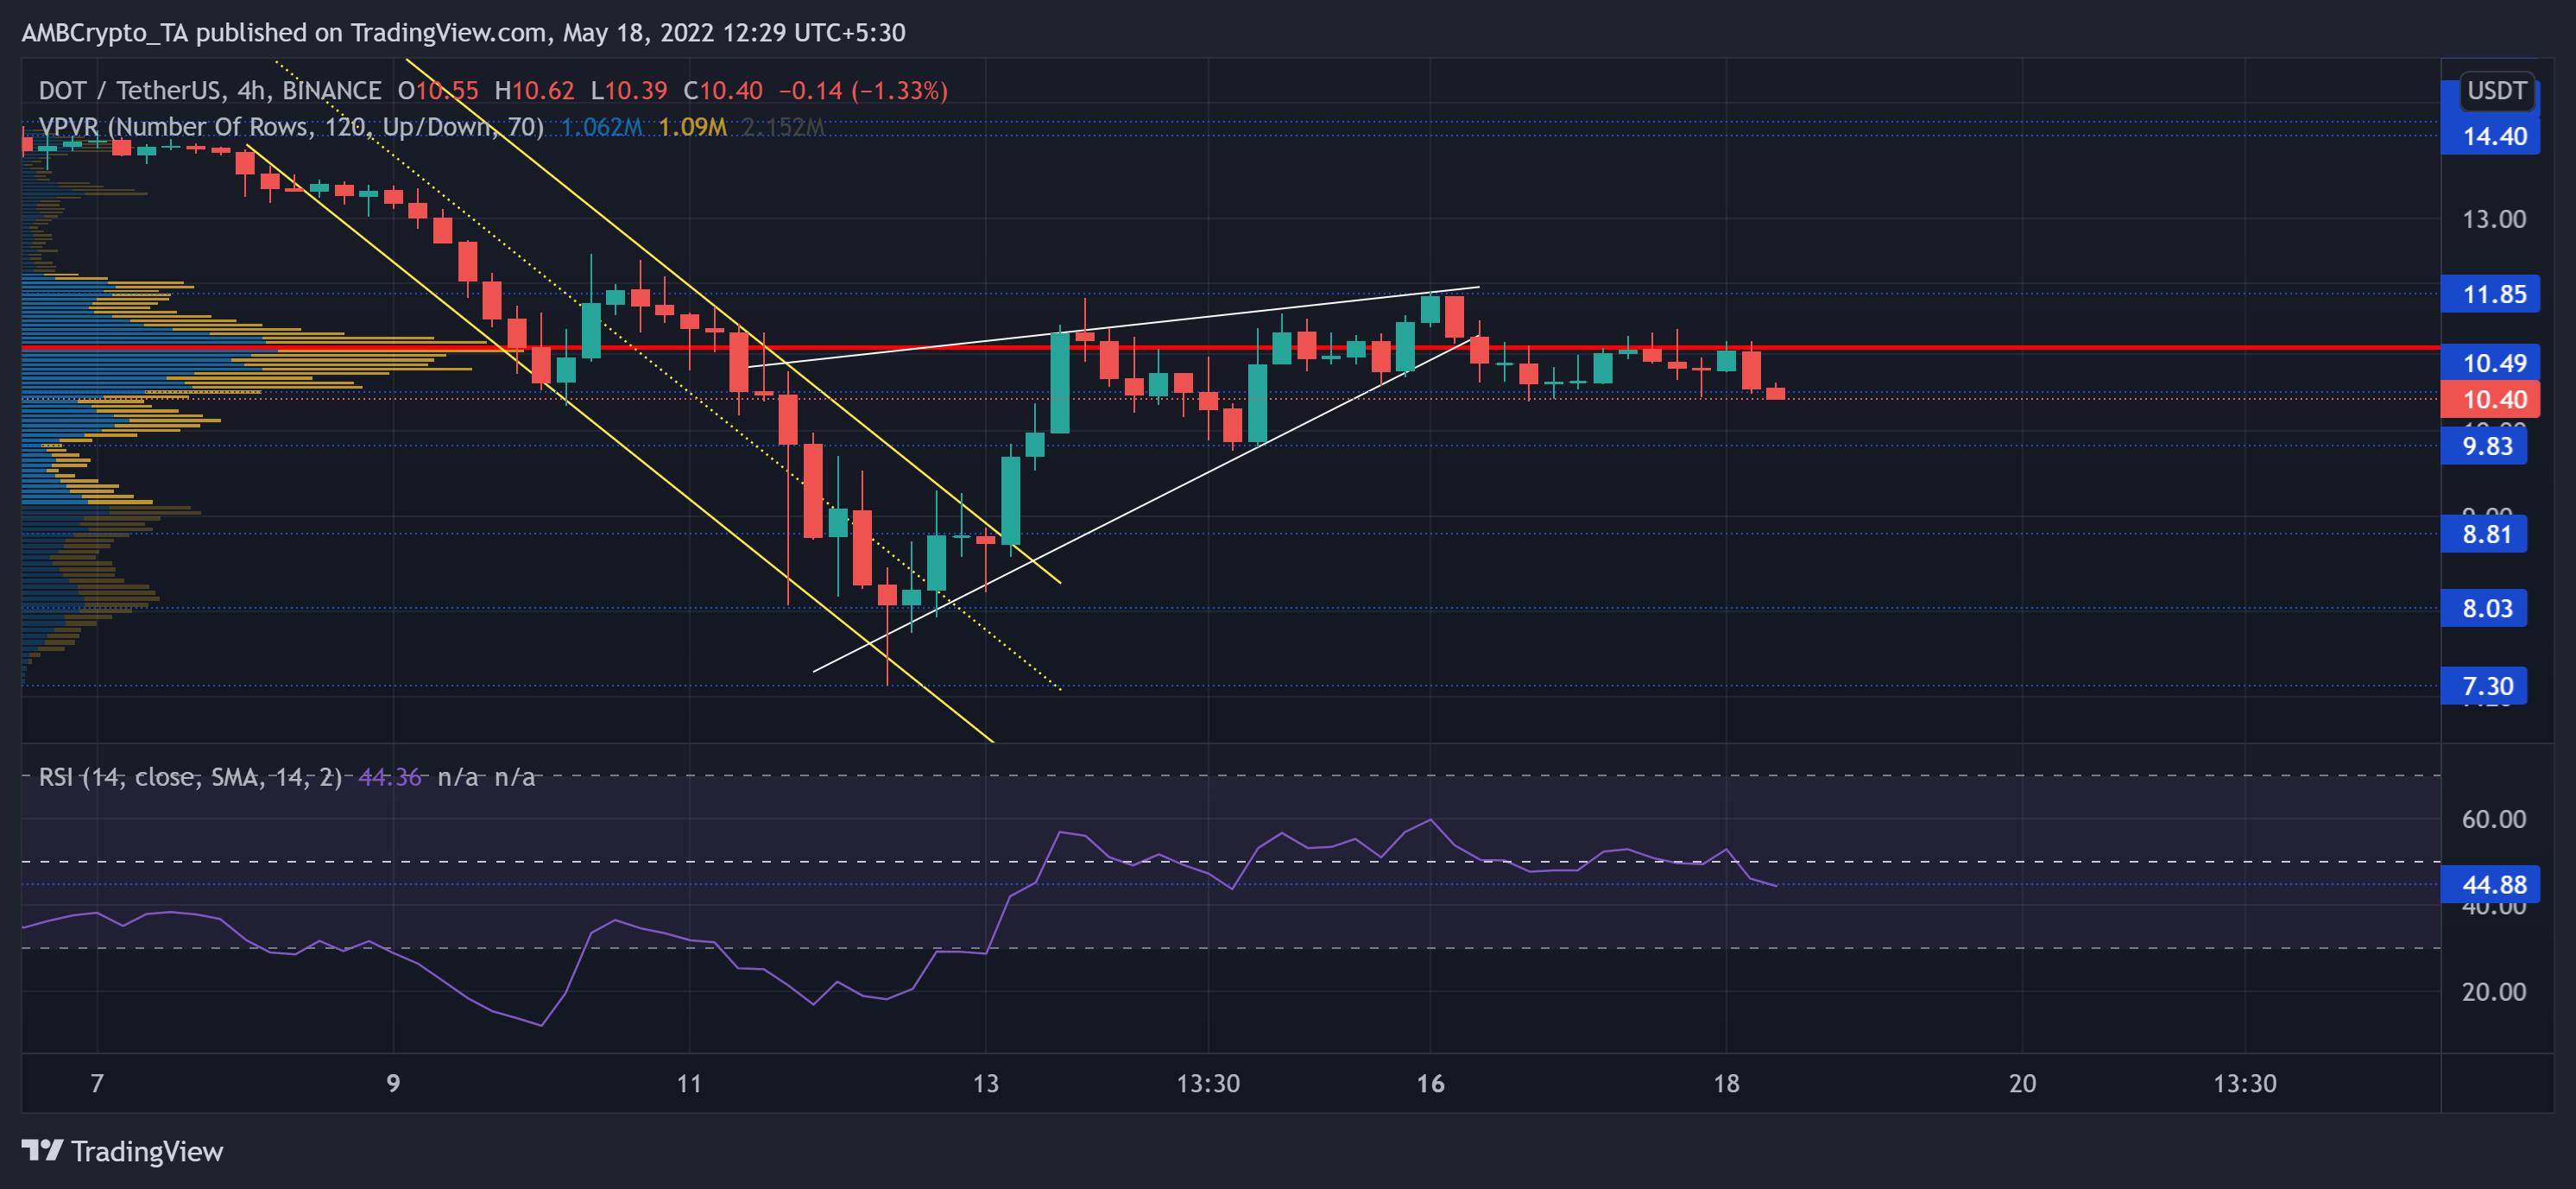
For over ten weeks, DOT sellers strained the $14.4-boundary by testing the bullish resistance. The recent liquidations opened up prospects for the sellers to pull the altcoin down to its multi-monthly lows.
Looking at the near-term movements, the bearish pull from the $14.4-level led the alt to lose more than 48% of its value. As a result, the altcoin slipped to its 16-month low on 12 May. In tune with the broader market trajectory, DOT picked itself up from its record lows while marking a bearish rising wedge. Post an expected breakdown, the price has been hovering near its Point of Control (red). A sustained close below the $10.4-level could pave a path for a short-term downswing.
At press time, DOT was trading at $10.4. After sailing near the mid-line and exhibiting a neutral view, the RSI dipped to test the 44-mark support. A robust close below this mark could be detrimental to the immediate recovery chances.
Cronos (CRO)
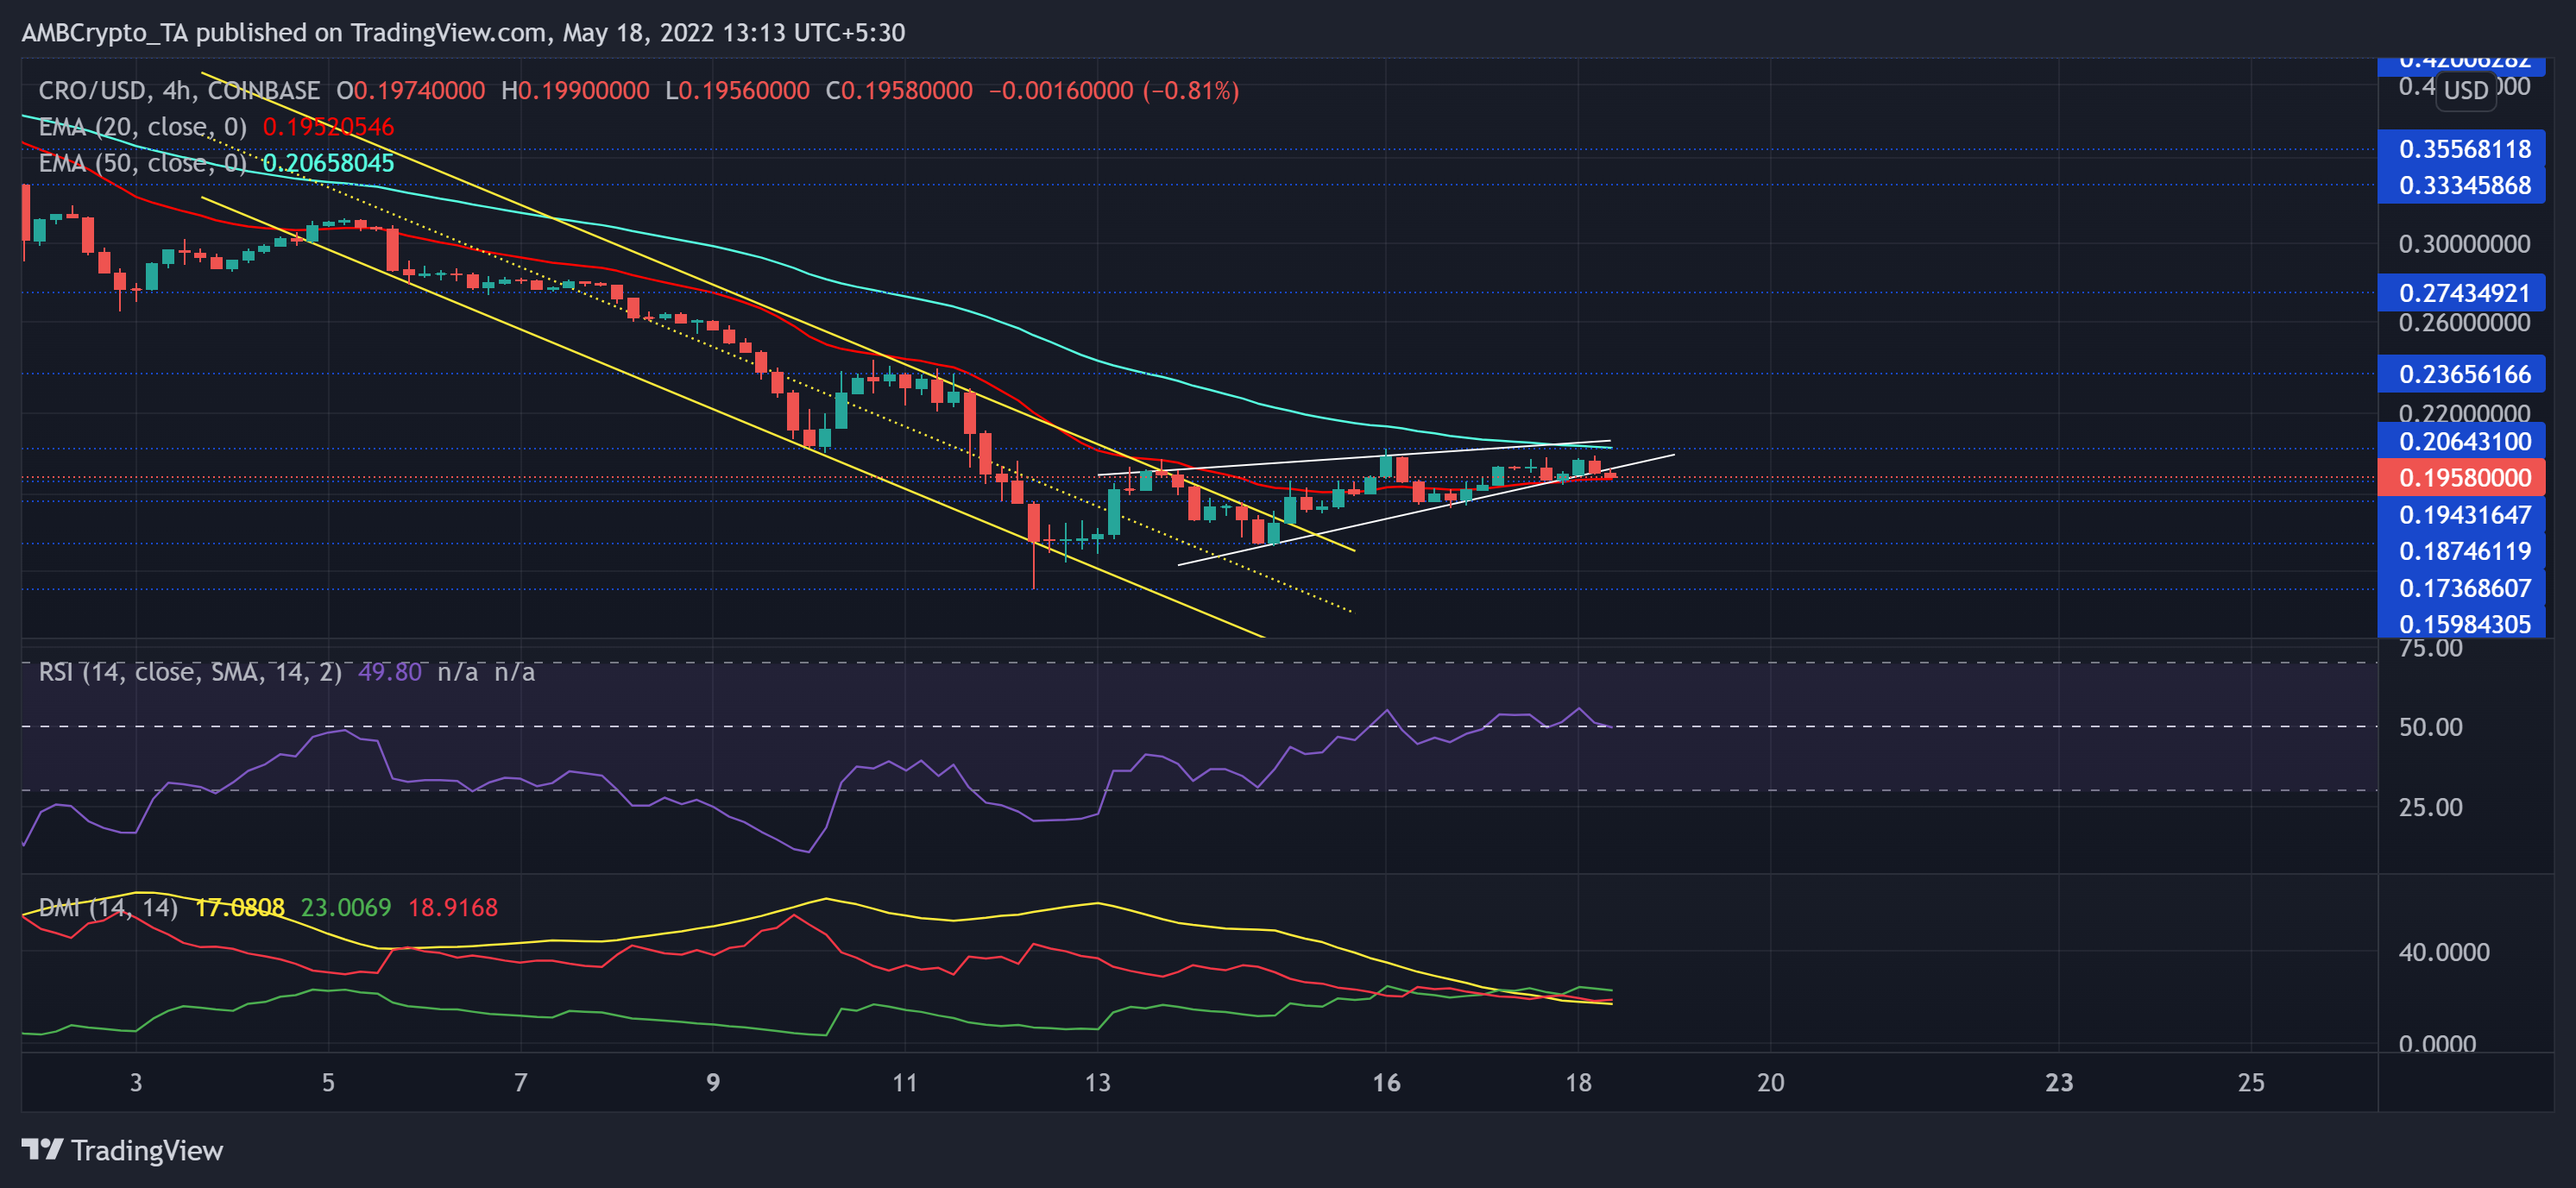
After ensuring a range-bound oscillation for over three months between the $0.33 and $0.53 range, the sellers breached the long-term floor.
While doubling down on the southward journey, CRO shed over half of its value (since 1 May) and plunged to poke its seven-month low on 12 May.
While the $0.17-level offered the bulls enough comfort to provoke a down-channel breakout, the price struggled to break the chains of its 50 EMA (cyan).
At press time, CRO was trading at $0.1958. The sellers were on a quest to sustainably breach the midline of the RSI. Any close below this mark would delay the recovery on the charts by revealing a bearish edge. Despite a slight bullish edge on the DMI readings, the ADX displayed a substantially weak directional trend for the alt.
FTX token (FTT)
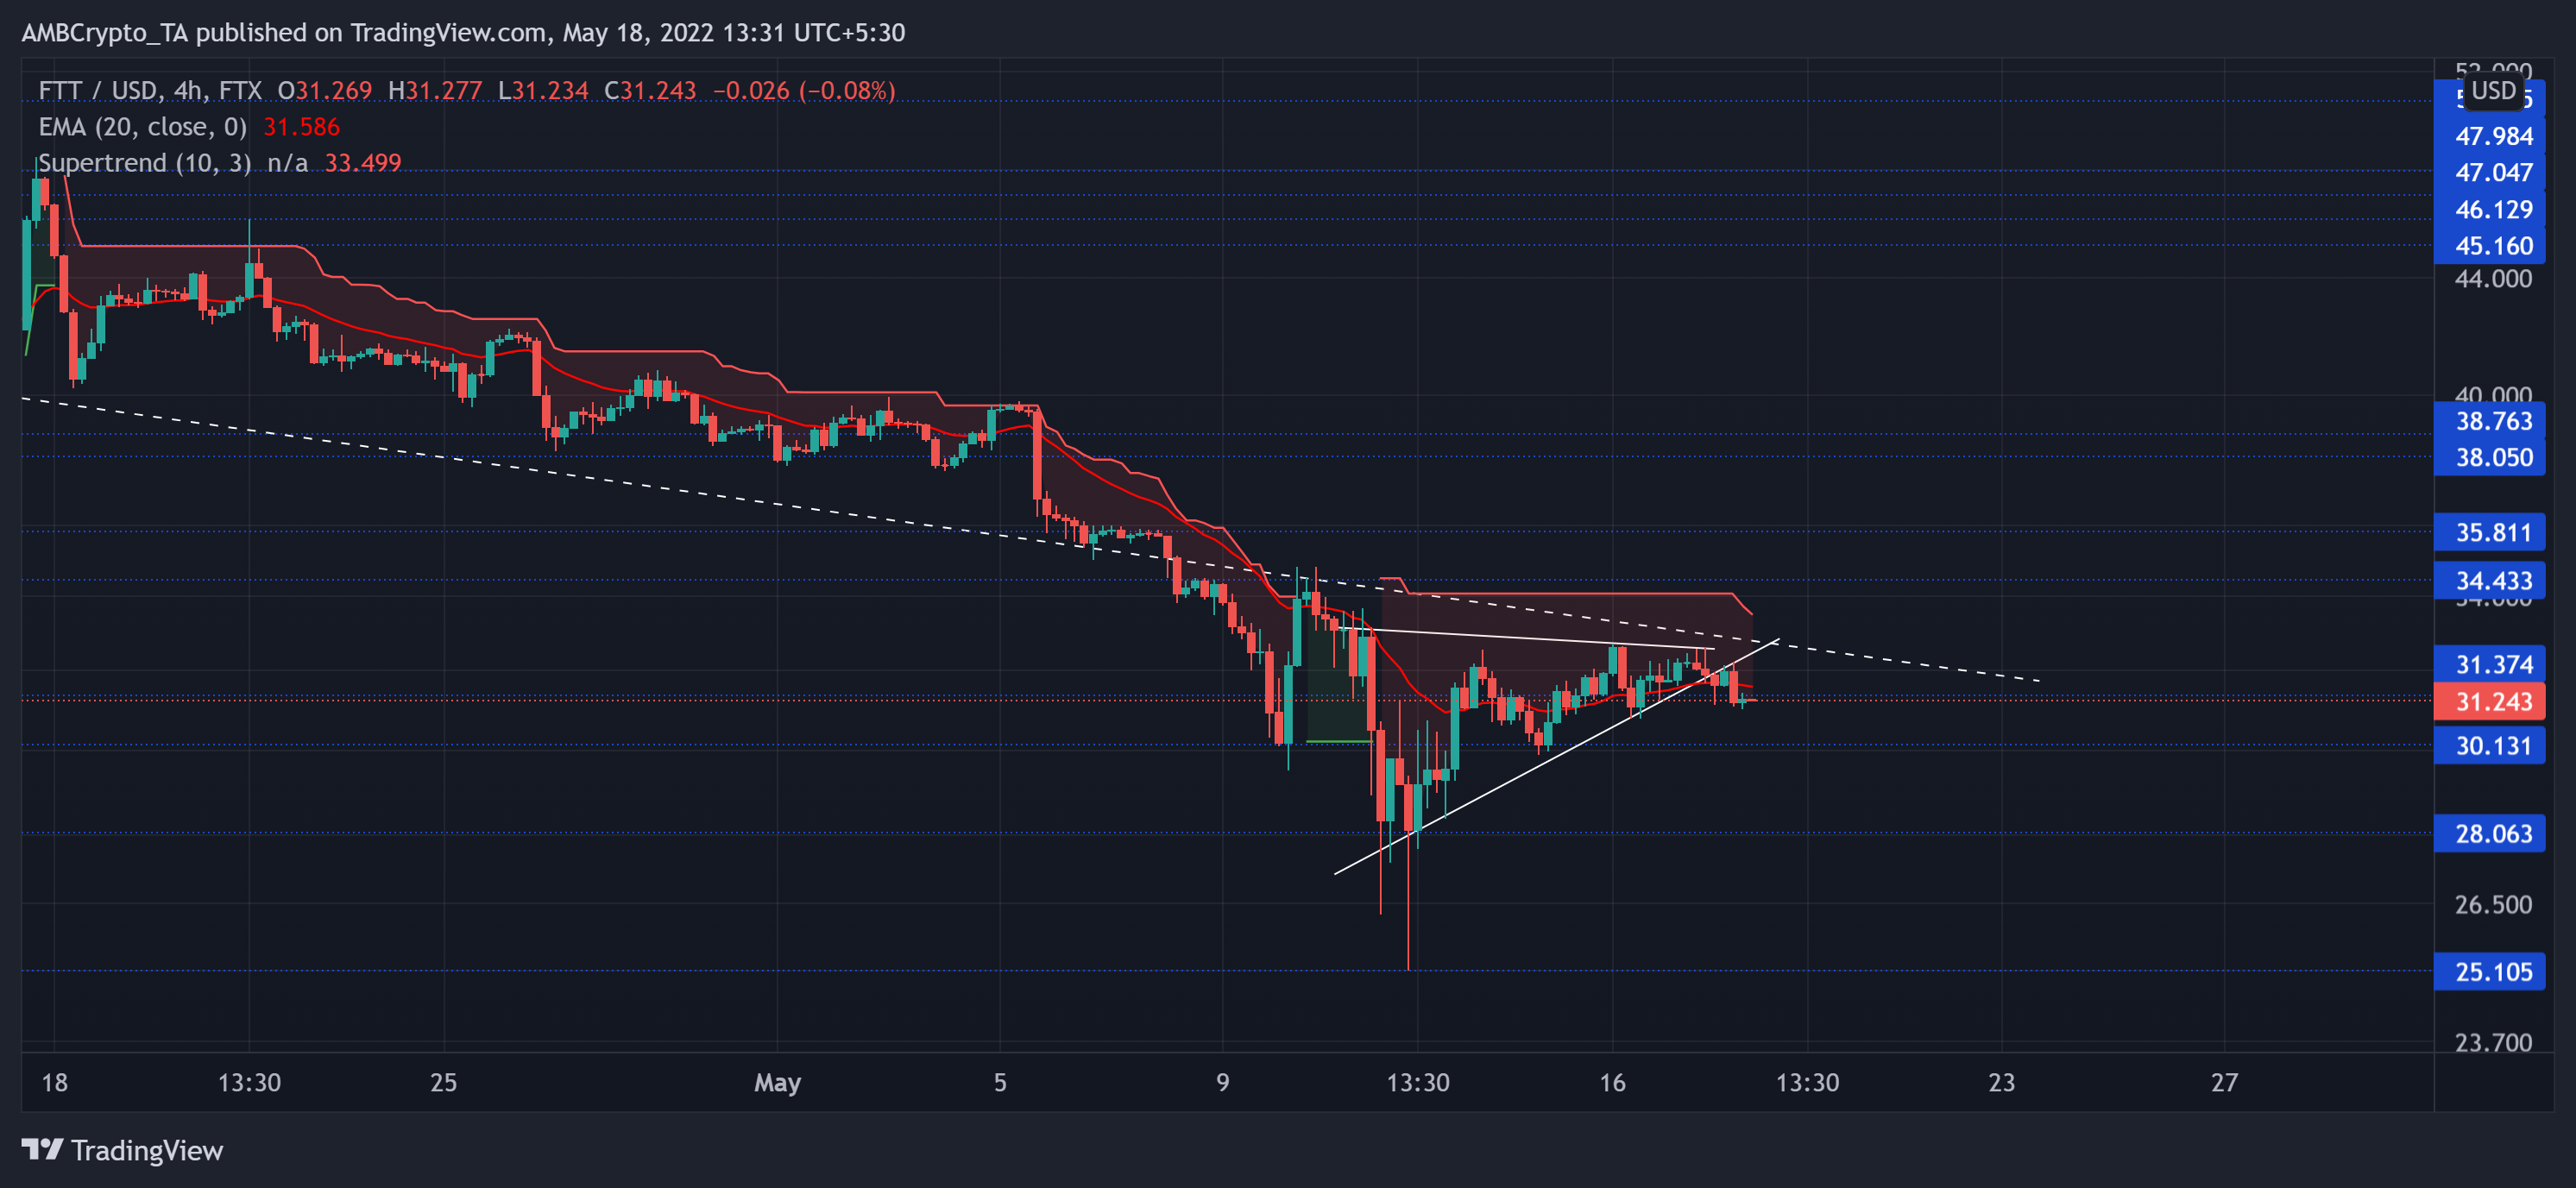
After an unshackled 37-day-long selling spree after the up-channel (yellow) breakdown, FTT rested on its nine-month baseline at the $28-level. This level propelled a reversal that halted at the two-month trendline resistance (white, dashed).
The recent revival finally bagged in decent gains. But the Supertrend stayed in the red zone while favoring the sellers, especially after breaking down from its bearish pennant-like pattern. At press time, FTT traded at $31.243, down by 3.29% in the last 24 hours.


