Polkadot, Dogecoin, Bitcoin Cash Price Analysis: 03 January

With Ethereum snapping off its immediate resistance at the $3,700-mark over the past day, Polkadot saw a 1.5% 24-hour gain at press time. Even so, the 38.2% Fibonacci resistance stood as a hindrance to Polkadot and Bitcoin Cash’s recovery phase.
On the other hand, Dogecoin continued its consolidation with slight bearish tendencies.
Polkadot (DOT)
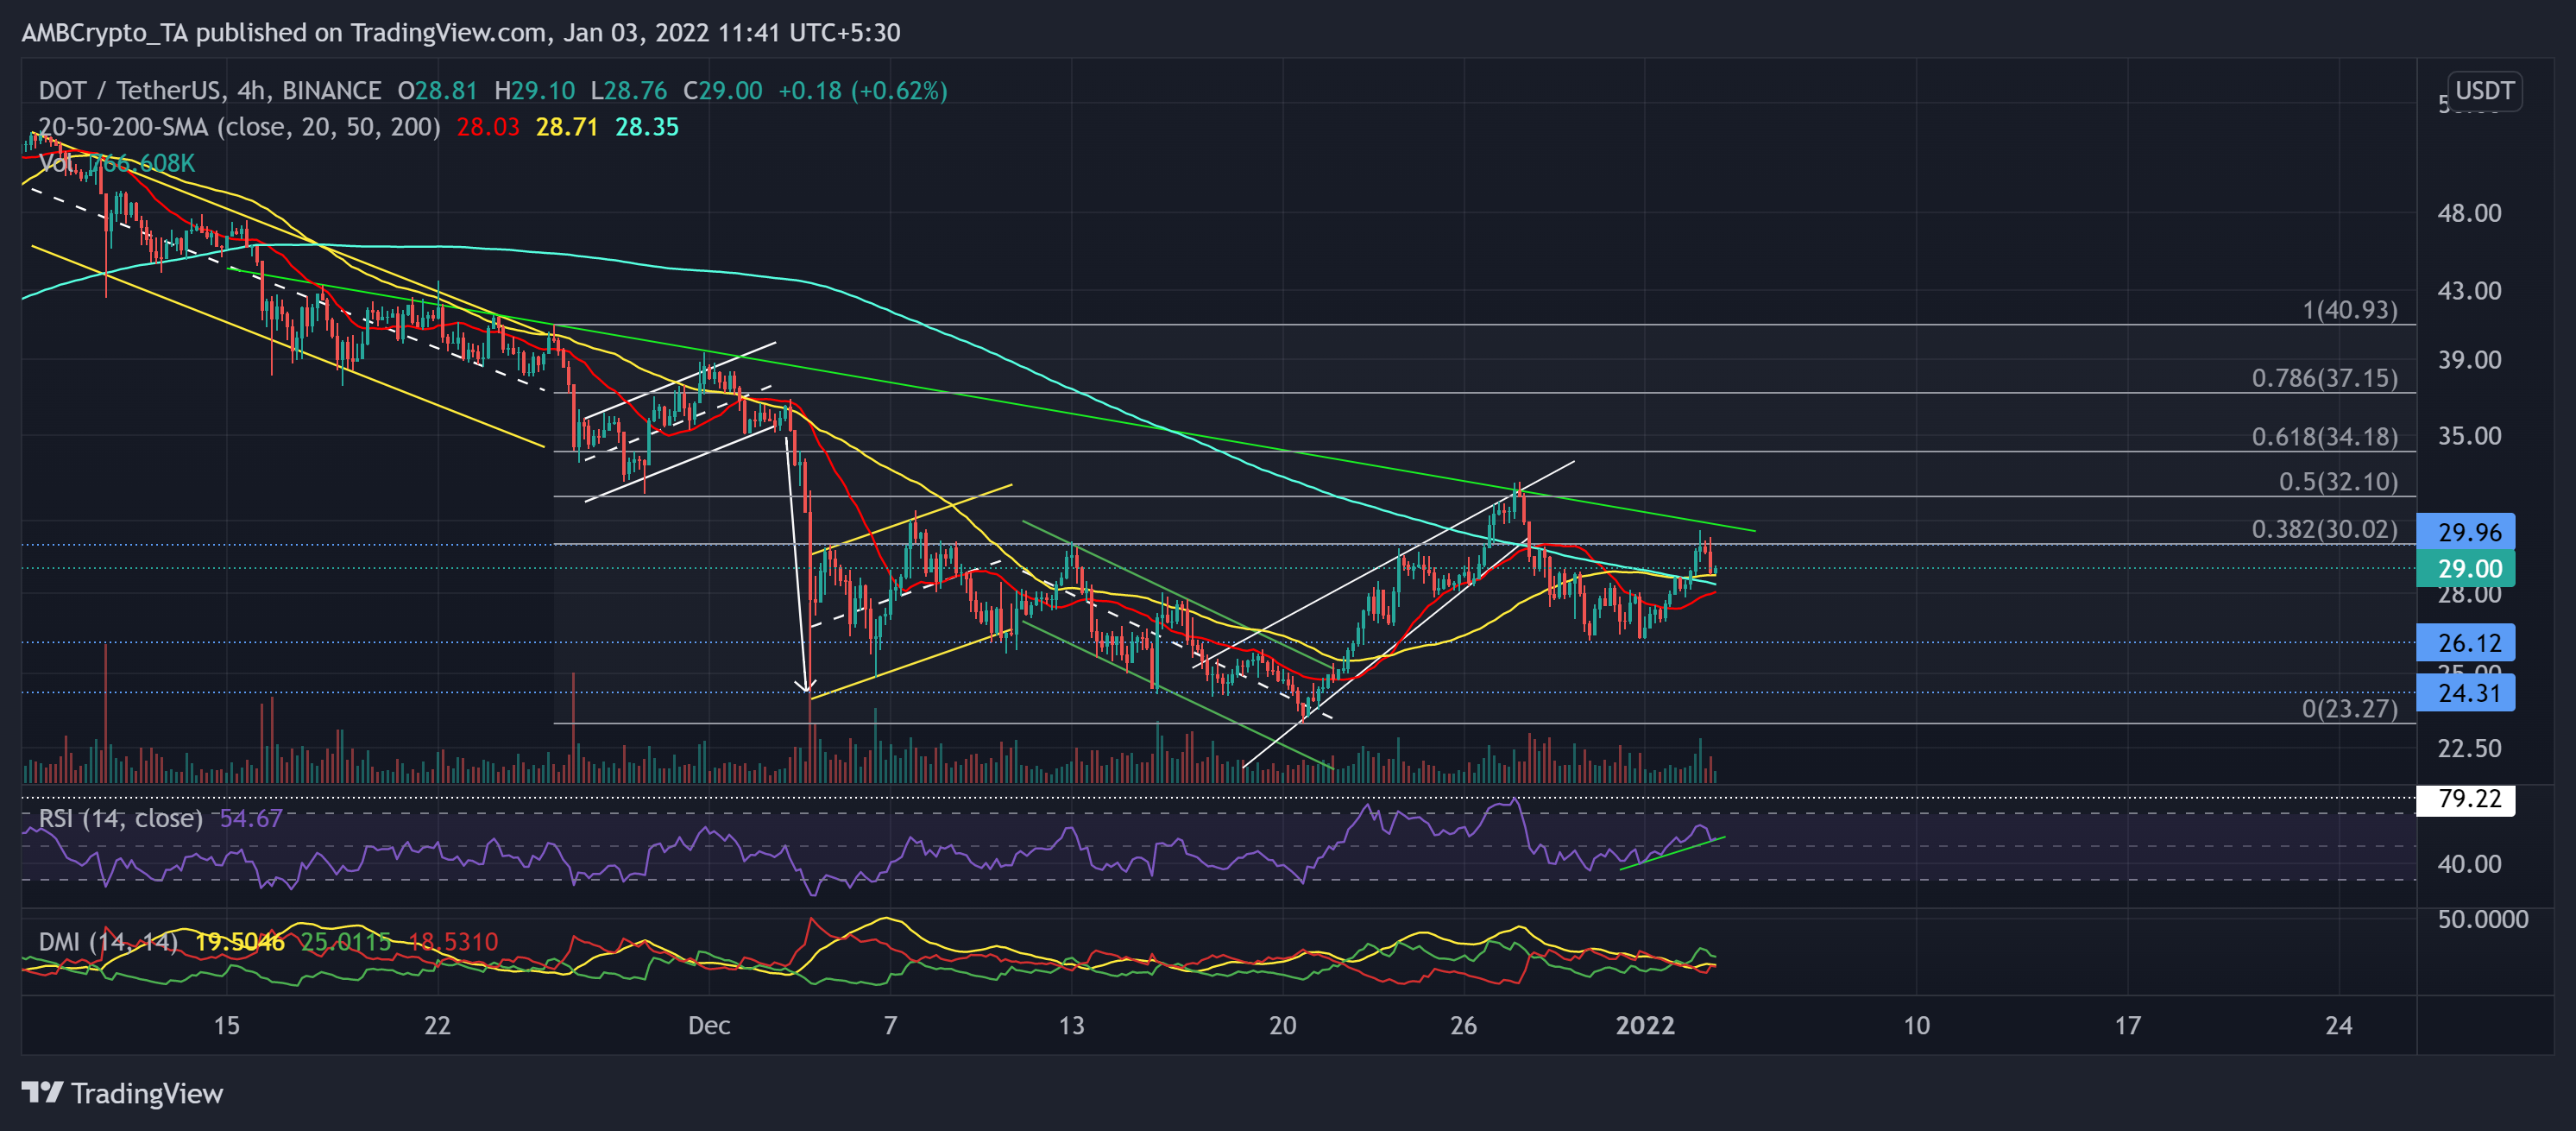
Although DOT noted a rising wedge (white) incline of nearly 40%(from 20 December low), it marked lower peaks since 16 November. Then, the 19.95% retracement after the three-week high on 27 December found immediate support at the $26.12-level.
After retesting it thrice over the past five days, the 38.2% resistance stood strong. However, as the alt jumped above its 20-50-200 SMA, the distance 50 SMA (yellow) crossed the 200 SMA (cyan), hinting at bullish tendencies.
In terms of the strength of its recovery, the volumes saw a 75.9% 24-hour jump. This indicated a healthy recovery.
At press time, the alt traded at $29 after noting a 10.75% ROI in just three days. The RSI saw a solid recovery and managed to find a close above the half-line. Also, the DMI hinted at a bullish vigor while the ADX displayed a weak directional trend.
Dogecoin (DOGE)
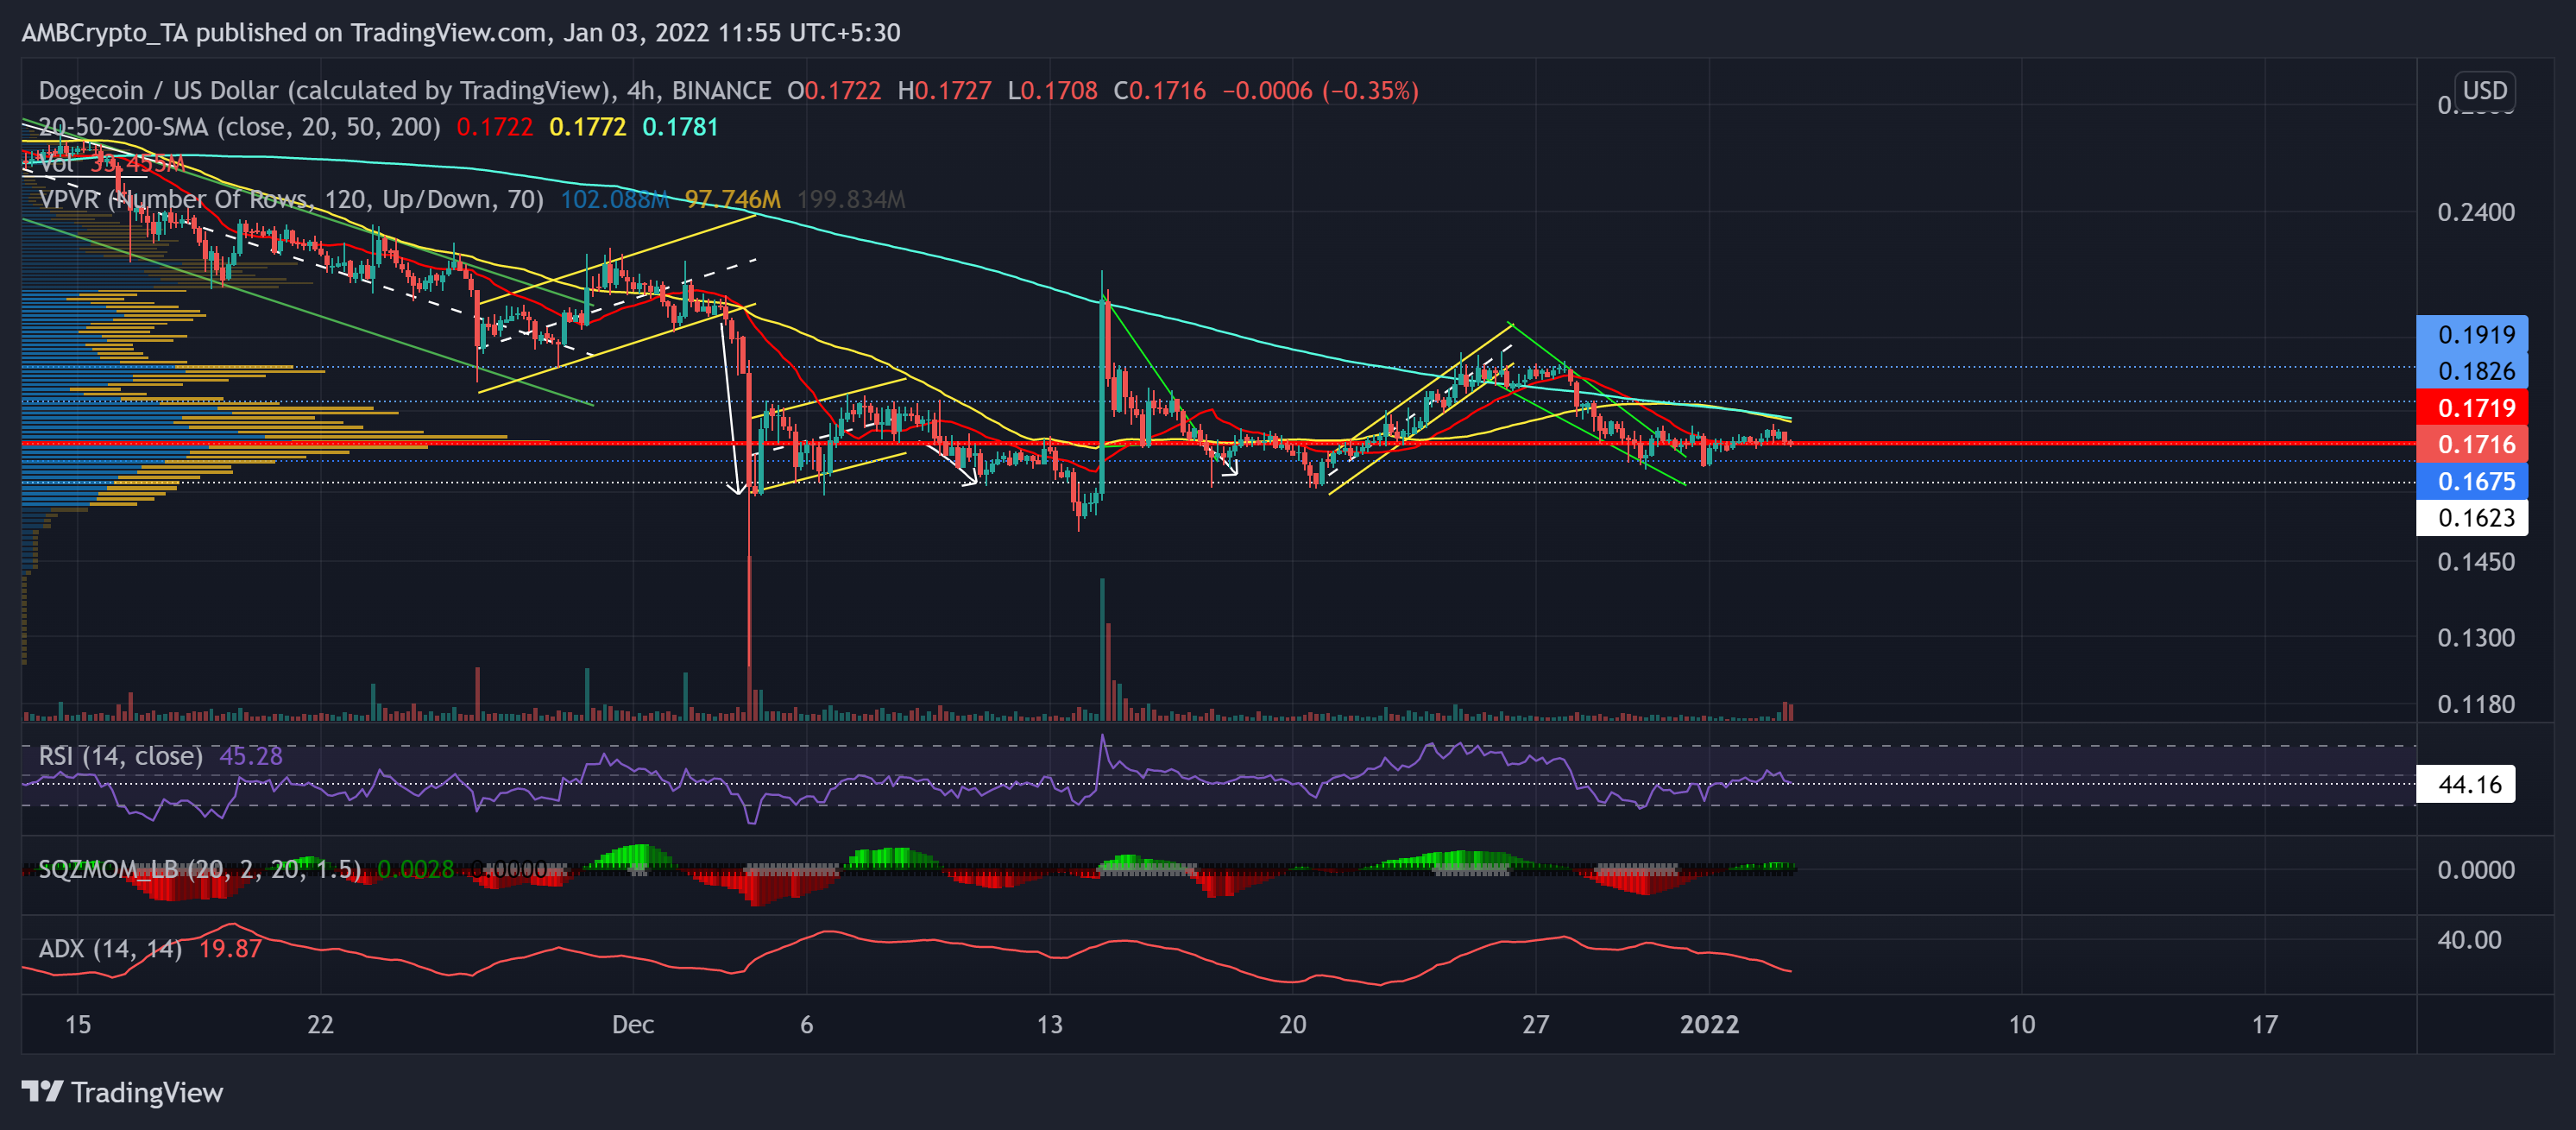
DOGE consolidated after the falling wedge (green) breakout on its 4-hour chart. The latest red candlestick witnessed substantial pullback volumes, indicating a strong bearish move. Post an up-channel (yellow) breakdown, DOGE bears have ensured the $0.1919 and $0.1675-mark oscillating range.
Further, the Squeeze Momentum Indicator flashed black dots while hinting at a low volatility phase. Now, any further pullback should find testing support at the $0.1675-level.
Additionally, it traded near its Point of Control that offered the highest liquidity for nearly the last two months. At press time, DOGE traded at $0.1716. The RSI plunged below the equilibrium and found support at the 44-point level. Besides, the ADX was in a downtrend and displayed a weak directional trend for the alt.
Bitcoin Cash (BCH)
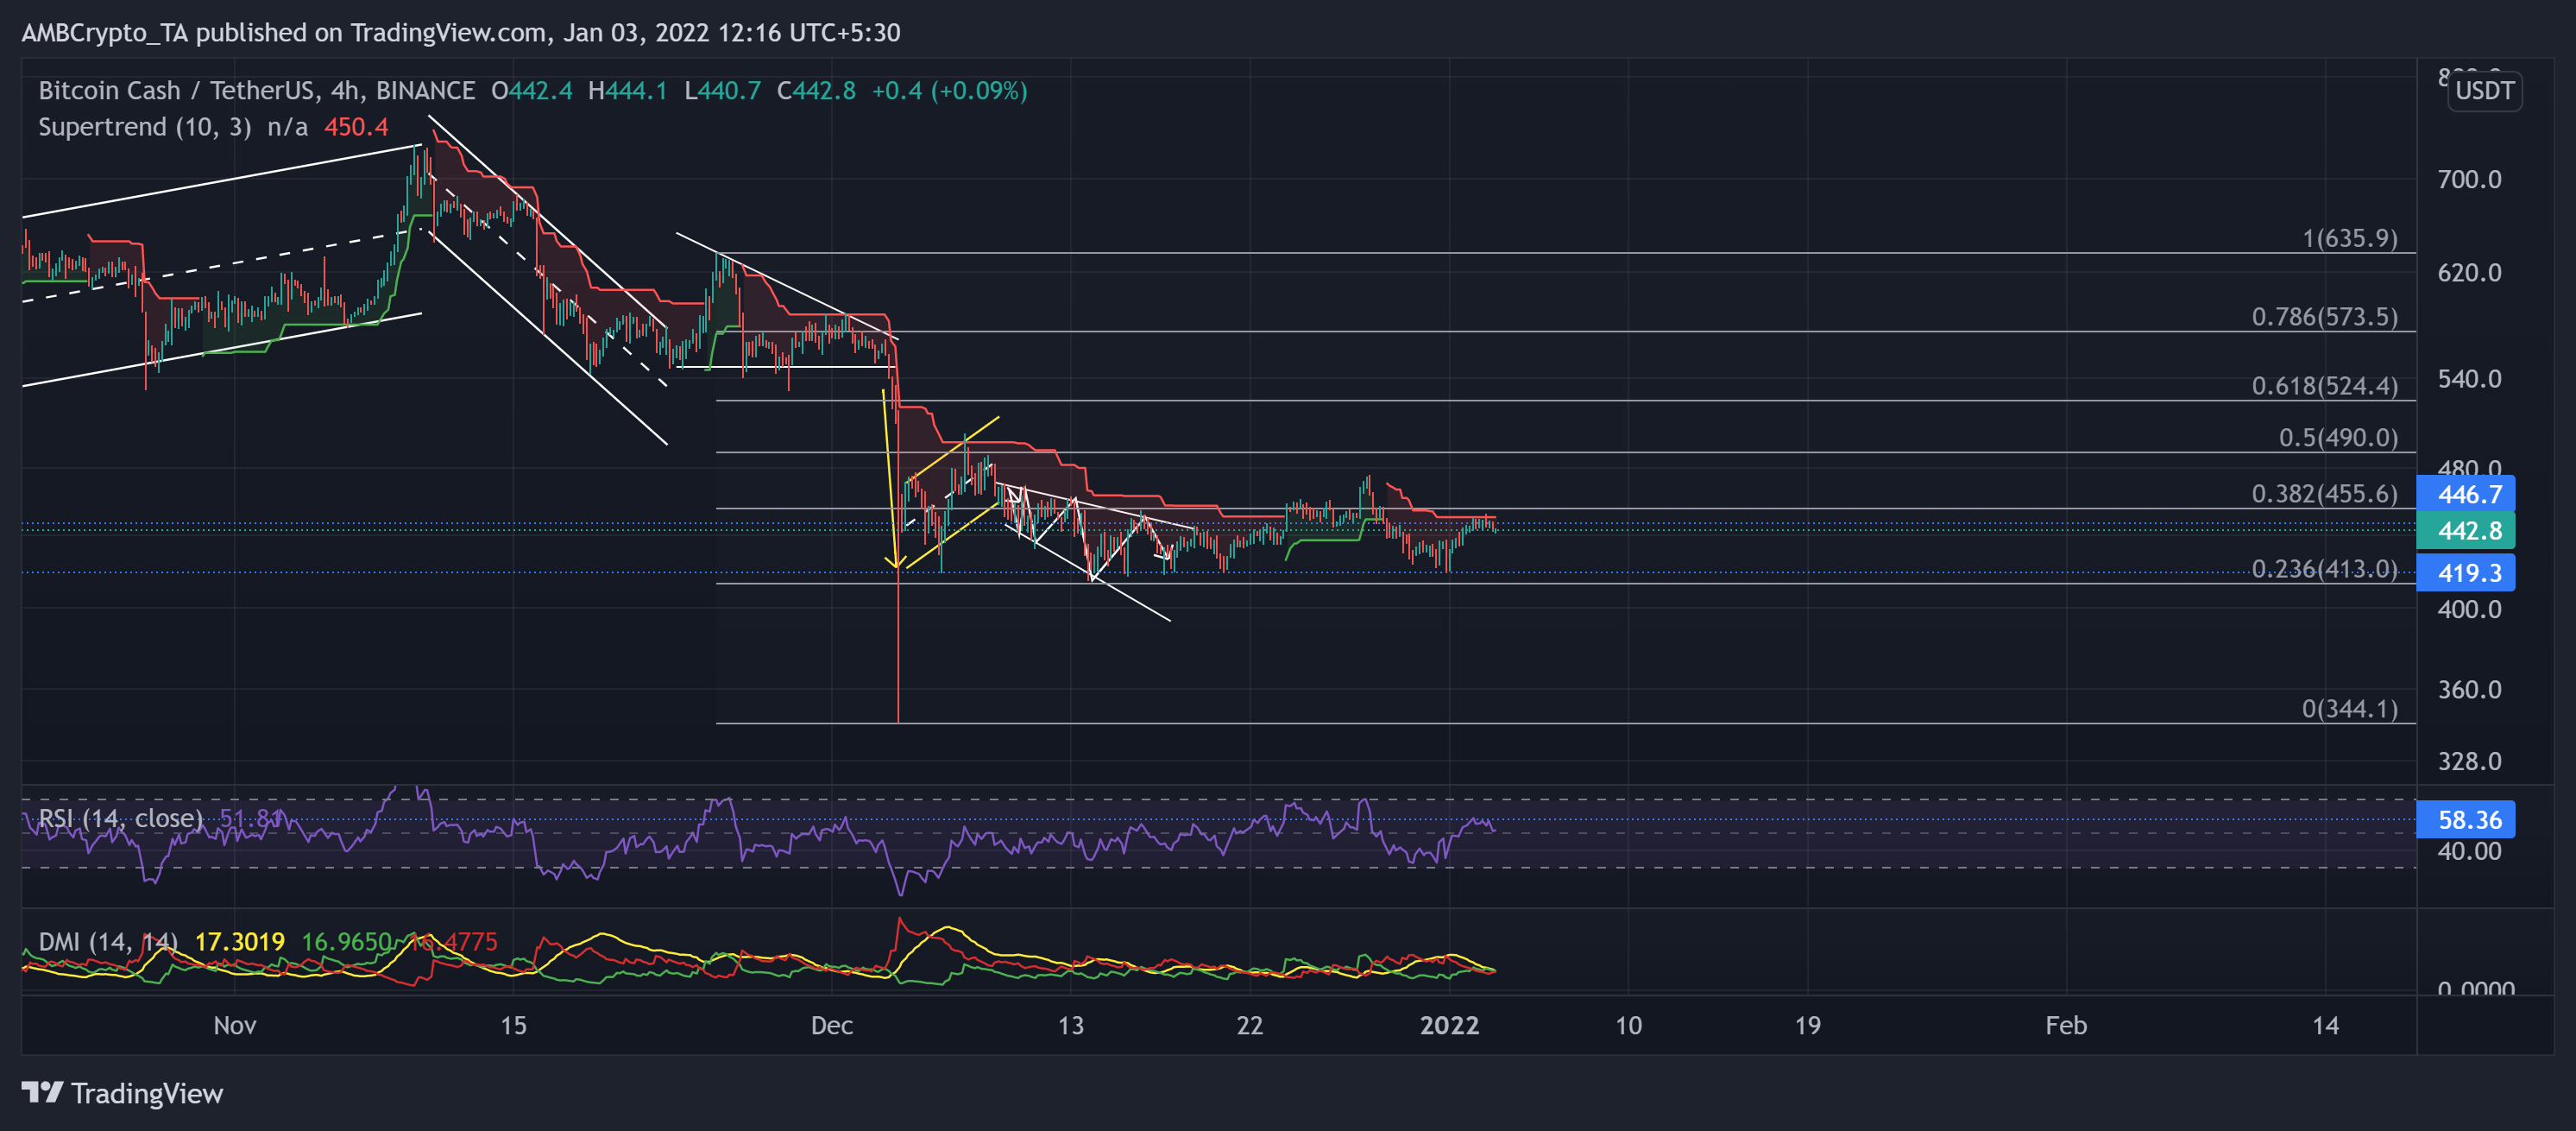
The bearish flag (yellow) breakdown pushed DOT’s price below the 38.2% resistance. The bulls ensured the 419-mark while bears retested it multiple times over the past year.
Thus, the alt consolidated between the above two levels for over three weeks now. Meanwhile, the Supertrend yet again flashed a sell signal. At press time, the alt traded at $442.8.
The RSI stood at the 52-mark after showing some revival signs. A sustained close above 58 could ignite the chances of breaching the 38.2% Fibonacci level. While the DMI lines were on the verge of a bearish crossover, the ADX displayed a weak directional trend for the alt.