Altcoin

Polkadot [DOT]: A different kind of ‘hike’ on the cards means this for the alt’s price
Posted:
editors

DOT’s performance last week was pretty sluggish as it fell by nearly 10% in just 7 days. In fact, while several positive developments with the potential to push the altcoin’s price transpired, not everything went according to plan. At the time of writing, DOT was trading at $7.03 with a market capitalization of $7.8 billion.
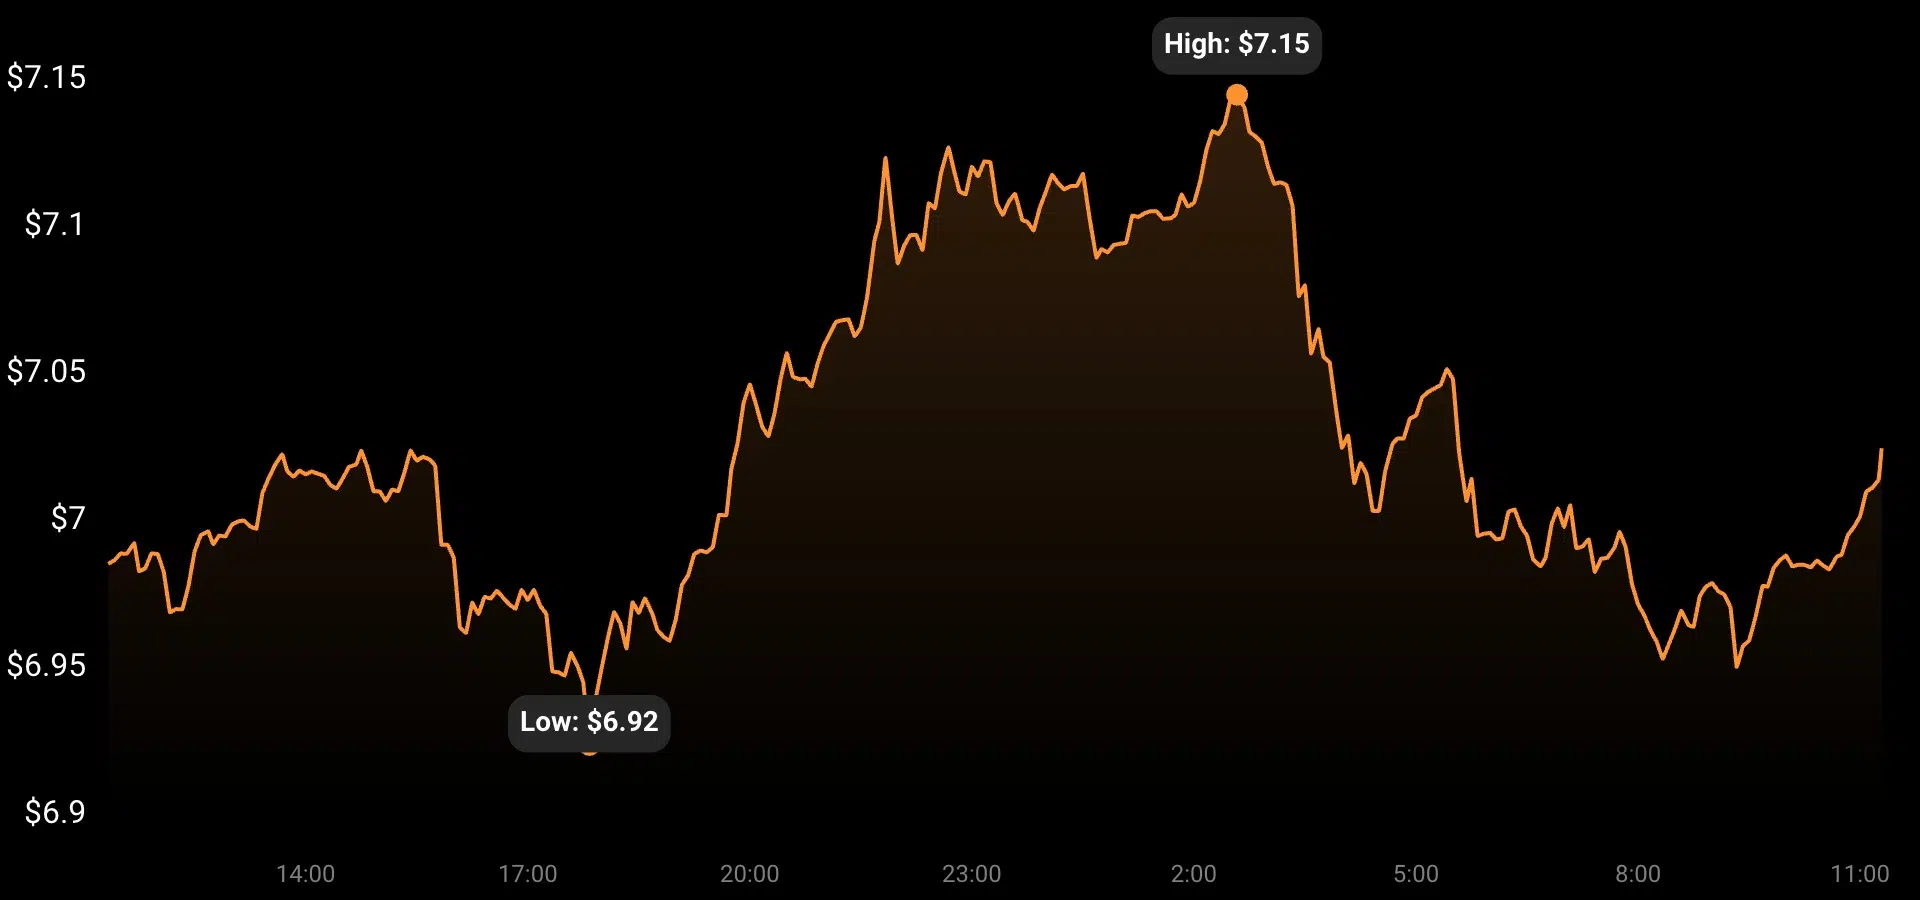
Source: Coinstats
What’s going on?
Recently, Scallop, a popular crypto-exchange platform, mentioned in a tweet that DOT was among the top three most trending coins on its platform. This seemed to be a positive development as it reflected the popularity of the coin. The other two altcoins that made it onto the list were MATIC and BNB.
We are back with this week's Top Weekly Trending Coins on #ScallopExchange ??
This week?
1️⃣ @binance $BNB
2️⃣ @Polkadot $DOT
3️⃣ @0xPolygon $MATICBuy NOW?
Buy $BNB ?https://t.co/F6OqApxBmU
Buy $DOT ?https://t.co/ghnMLTHQKm
Buy $MATIC ? https://t.co/hcaJW6NY2J pic.twitter.com/3T5OHeLnLg— Scallop (@ScallopOfficial) September 16, 2022
Moreover, CoinEX Global also named Polkadot as one of the top 5 Financial Income Cryptos, which further added value to the blockchain.
Simply put, while the altcoin received recognition from several players in the crypto-market, its social position remained pretty stagnant. The same was pretty evident when Santiment’s charts were looked at.
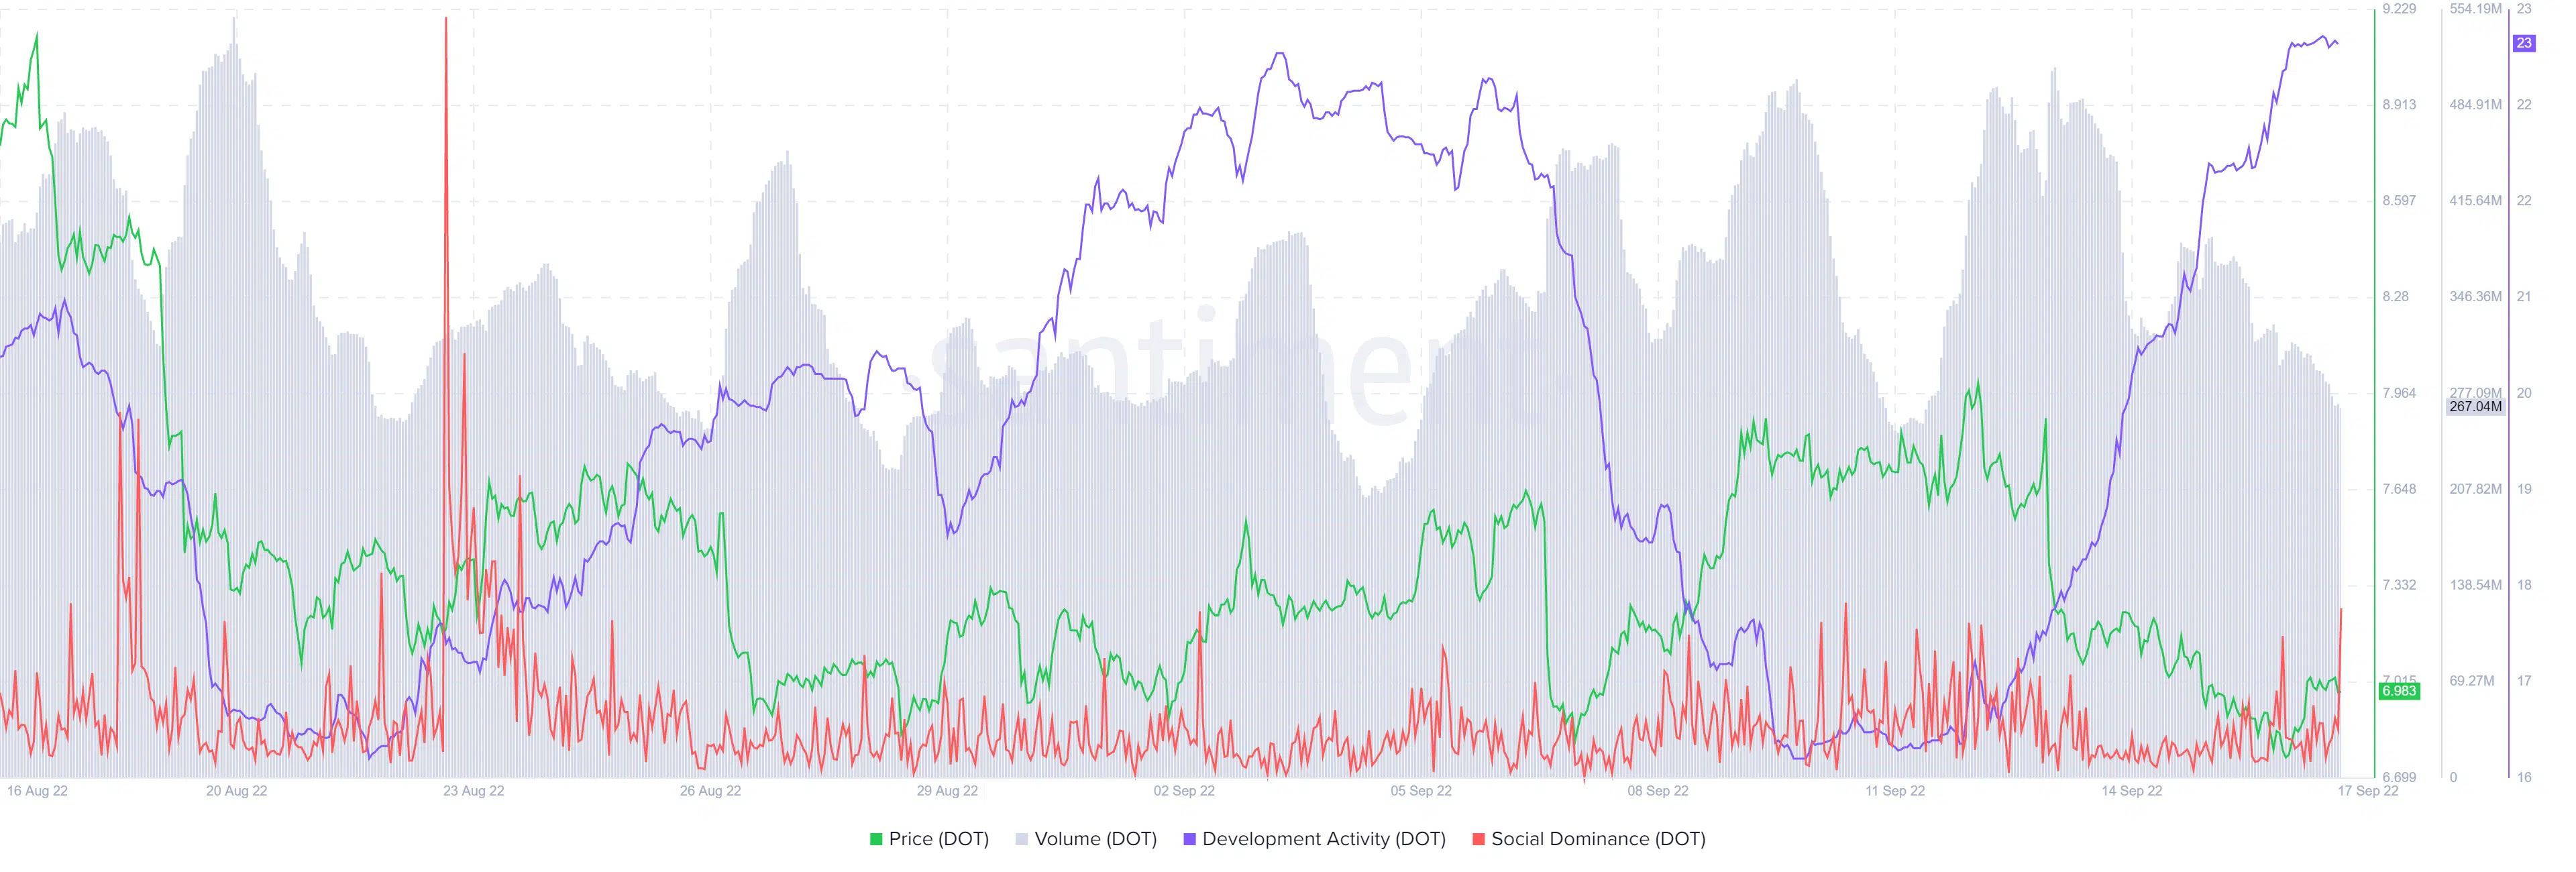
Source: Santiment
Interestingly, when DOT’s price declined on the charts, a massive surge in its development activity happened. This is unusual as an increase in development activity is generally a positive signal for a blockchain. The fact that developers were working hard to improve the blockchain was also supported by a recent interview by Polkadot’s Co-founder.
The Co-founder recently claimed,
“The crypto-space, especially technologically, is still quite early. We’ve embraced the idea that it’s time for experimentation less so than standardization.”
Needless to say, the exec’s statements have been in line with Polkadot’s on-chain updates and developments.
The road ahead will be…
DOT’s daily chart also did not share a clear picture of what to expect in the days to come, as a few market indicators were bearish while others were bullish.
For instance, the Exponential Moving Average (EMA) Ribbon revealed that bears had an upper hand in the market as the 20-day EMA was below the 55-day EMA. Additionally, the MACD also registered a bearish crossover, further minimizing the chances of a northbound breakout in the short-term.
However, the Relative Strength Index and Chaikin Money Flow registered upticks, giving some hope for a price surge in the near-term.
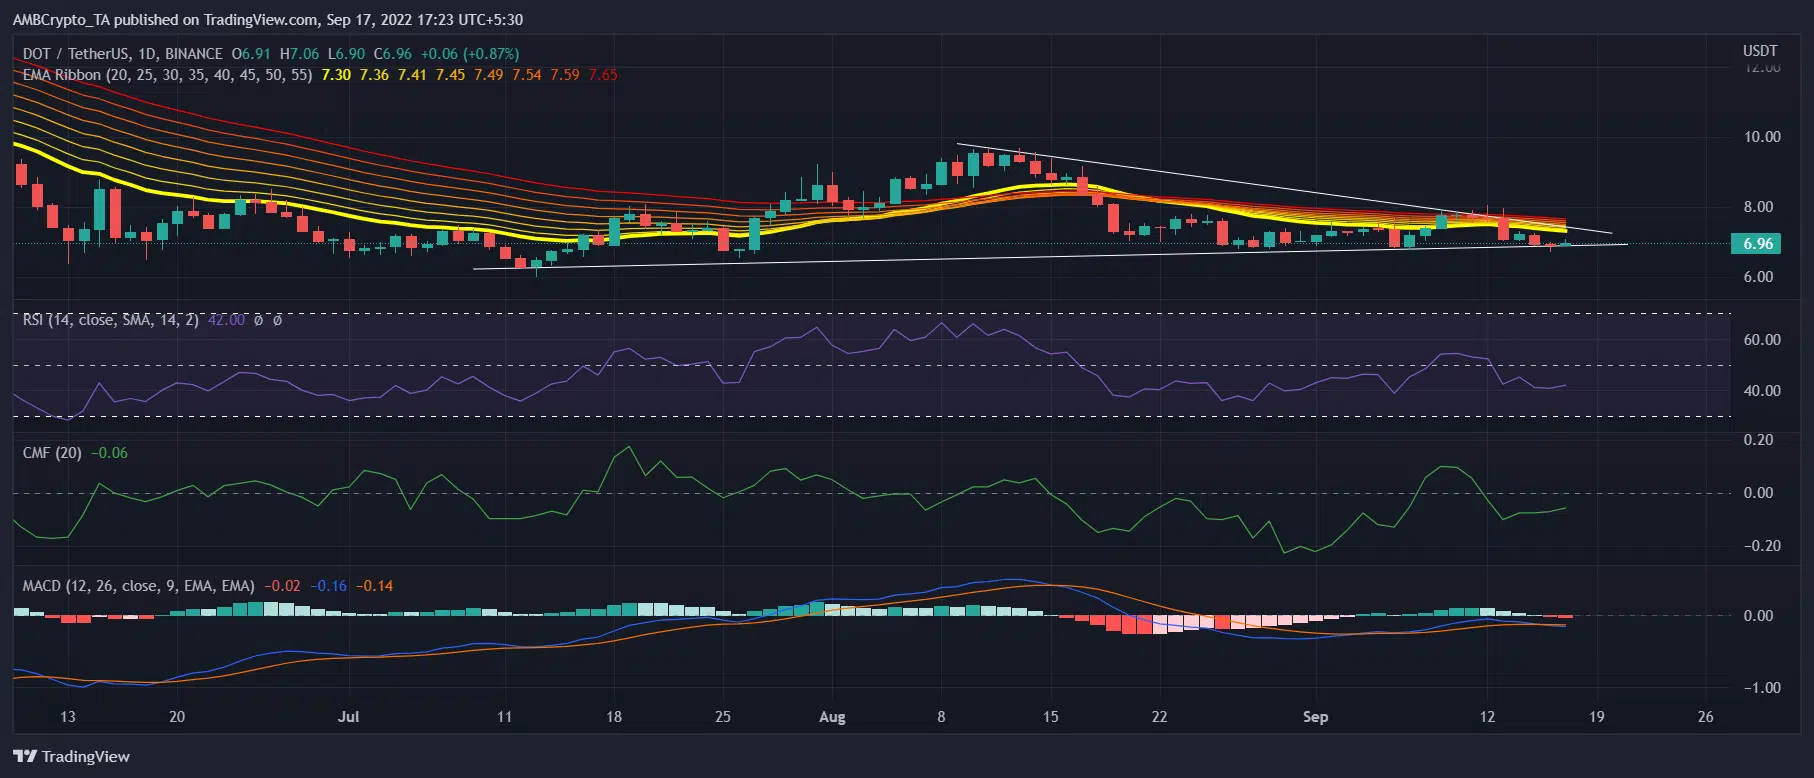
Source: DOT/USDT, TradingView


![Why Chainlink [LINK] and Polygon [MATIC] are more similar than you realise](https://ambcrypto.com/wp-content/uploads/2024/04/Chainlink_and_Polygon-1-400x240.webp)

