Polkadot [DOT] at Value Area Lows; traders can put a stop-loss just above…

Disclaimer: The findings of the following analysis are the sole opinions of the writer and should not be considered investment advice.
In the time since the Terra crash and the fear that gripped the market on 12 May, Polkadot prices have stabilized somewhat as the token established a range around the $10 mark. However, this was a long way from the $50 highs it once traded at.
The relentless downtrend held firm on higher timeframes and seems to have begun to move DOT prices lower on the lower timeframes as well.
Can Polkadot see a rally from the range lows, or was this an early sign that further pain was likely for Polkadot investors?
DOT- 1 Hour Chart
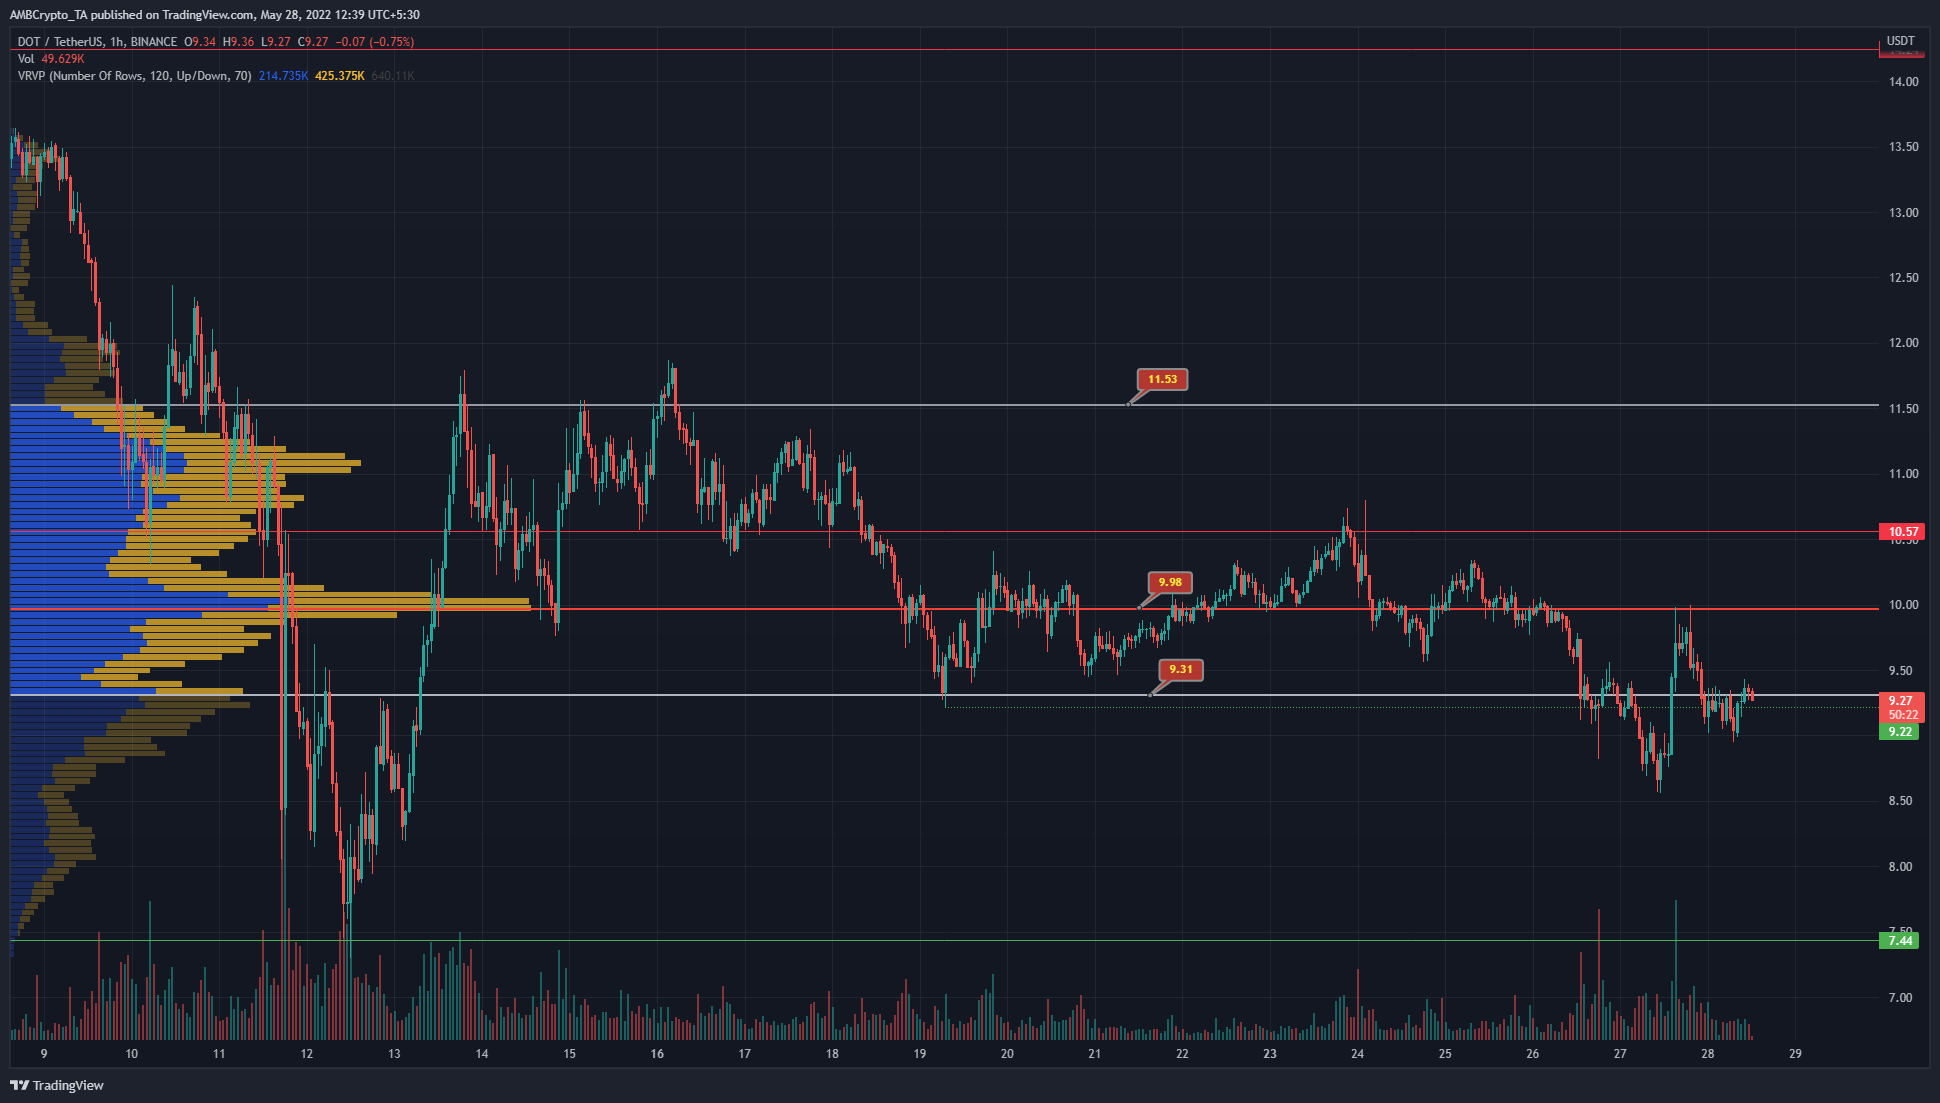
The Volume Profile Visible Range tool was used on the hourly chart of DOT. It showed the Point of Control to lie at $9.98 and denoted the level where the largest portion of trading has occurred in the visible range on the chart. Moreover, the Value Area Highs and Lows were shown to lie at $11.53 and $9.31 respectively. These levels, respectively, are places to look to sell and buy a range-bound asset.
Polkadot was trading within a range from $10.57 and $9.27 in the past ten days, but at press time, the price looked likely to slip beneath the $9.2 support area once more. The weekend generally has lower trading volume, hence a sharp drop can not be ruled out.
Since the market structure was bearish, a move further south would be the expectation until DOT can close a session above the $9.98 mark.
Rationale
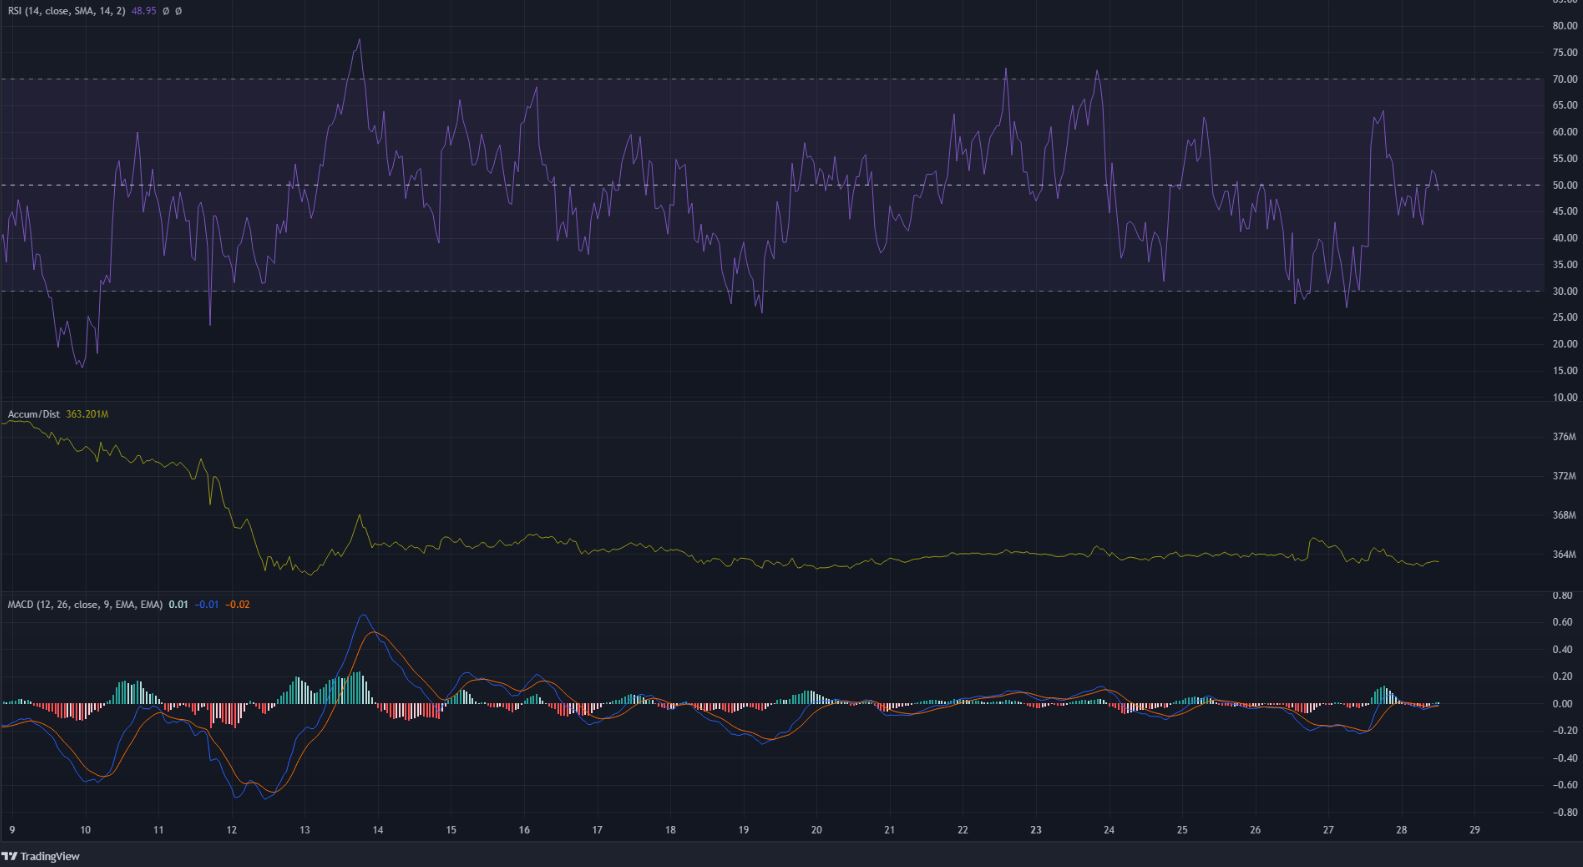
In the past two weeks, the RSI has oscillated from the 25 mark to the 70 mark, and the neutral 50 was flipped from support to resistance multiple times within a few days. This generally occurs when the price moves sideways, and signals the lack of a strong trend.
The A/D line has also been moving sideways, after a sharp drop earlier in May. Hence, since 12 May, neither the buyers nor the sellers have been dominant. The MACD showed a more bearish outlook, as it remained beneath the zero line for the most part. At the time of writing, it stood just below the zero line, which indicated neutral momentum.
Conclusion
Polkadot was trading just beneath the Value Area Lows at $9.3, but this was not a buy signal by itself. The $9.3-$9.5 zone has been strong resistance in the past week, therefore, a short position can be entered, with stop-loss just above $9.5 and a take profit at $8.6 and $7.5.


