Polkadot [DOT] consolidates further: Here are key levels to track
![Polkadot [DOT] consolidates further: Here are key levels to track](https://ambcrypto.com/wp-content/uploads/2023/04/image-1200x800-33.png)
Disclaimer: The information presented does not constitute financial, investment, trading, or other types of advice and is solely the writer’s opinion
- DOT has been consolidating since 13 March.
- Declining funding rates may offer sellers more market influence in the mid-term.
For the past four weeks, Polkadot [DOT] has traded within the $5.8 – $6.6 range. Entering the fifth week, DOT’s price action seemed rigid in its neutral structure as Bitcoin [BTC] held on tight to its $26.8k – $28.8k trading range. Investors could seek gains at DOT’s upper and lower range boundaries if the sideways market structure persists.
Read Polkadot’s [DOT] Price Prediction 2023-24
Is a retest of the lower boundary of $5.8 likely?
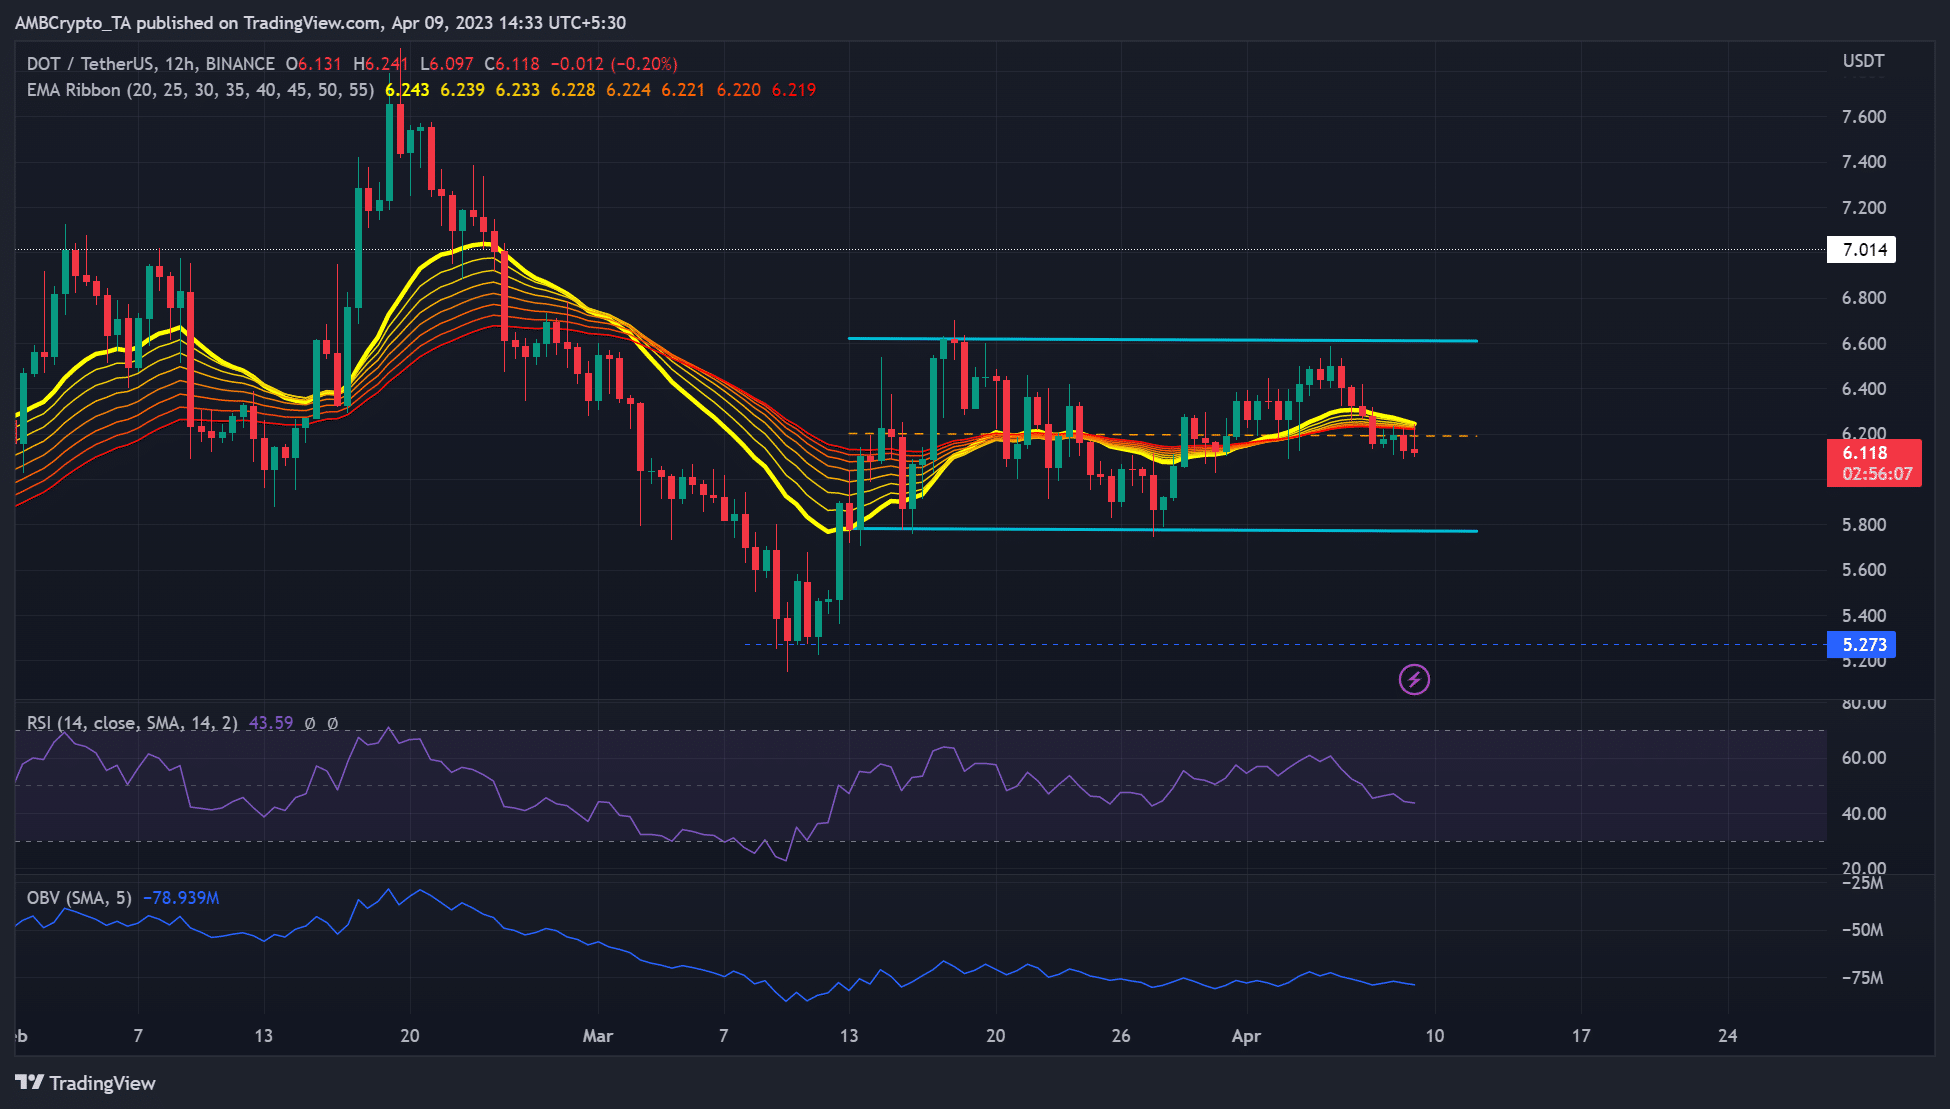
In the second half of February, DOT hit a high of $7.9 but faced a sharp retracement afterwards and plunged by over 30%. But the $5.3 support level prevented more plunge, setting DOT into recovery.
However, the recovery was cut short after DOT entered a price consolidation phase. At press time, DOT had hit the upper range boundary of $6.6, exposing the asset to sell pressure. Bears had cleared the EMA ribbon and the range’s mid-level of $6.2. As a result, sellers could gain more leverage and sink DOT to the range’s lower boundary of $5.6 or retest previous support of $5.27.
Conversely, DOT could aim for the range’s upper boundary of $6.6 if BTC reclaims the $28k level and surges afterward. But bulls must move above the mid-range of $6.2 and EMA ribbon to dent the bearish sentiment. Northwards, the $7.0 and $7.4 are key resistance levels to watch out for.
Meanwhile, the RSI fluctuated between 40 and 60 levels, reiterating the equal sell and buy pressure in the past few weeks. Similarly, the OBV (On Balance) fluctuated in the same period, confirming the wavering demand in the past few weeks.
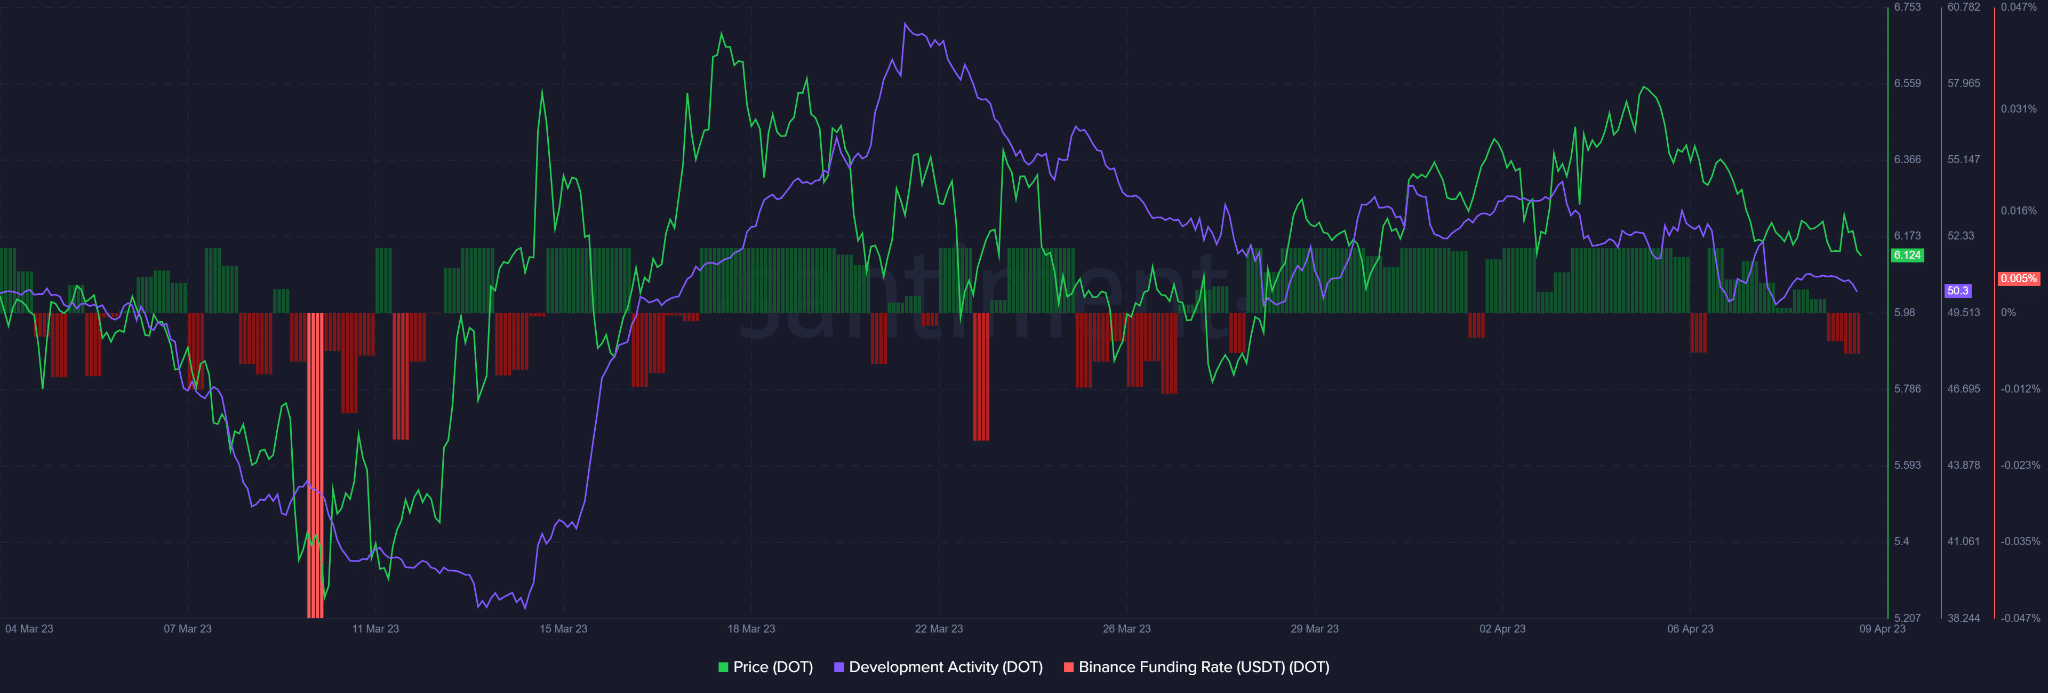
The funding rate turned negative
Is your portfolio green? Check DOT Profit Calculator
The funding rate has been predominantly positive since 13 March. But at the time of writing, it flipped into negative, showing a bearish sentiment. In addition, development activity dipped after peaking on 22 March, which could weigh down investors’ confidence and the token’s value.
On the other hand, there were over $160k in liquidations of long positions than short positions ($8.2k), according to Coinalyze. It shows long positions were paying short positions – a bearish outlook that could likely set DOT to retest $5.8.