Polkadot [DOT] dropped to a key support zone; can bulls prevail?
![Polkadot [DOT] dropped to a key support zone; can bulls prevail?](https://ambcrypto.com/wp-content/uploads/2023/01/isis-franca-AuWSzM7kZDA-unsplash-e1675087595625.jpg)
Disclaimer: The information presented does not constitute financial, investment, trading, or other types of advice and is solely the writer’s opinion
- DOT was neutral after a sharp drop on the 12-hour chart.
- A price reversal could happen if demand increases at the crucial support zone.
The value of Polkadot [DOT] dropped after Bitcoin [BTC] broke below the $23.5K level. At press time, DOT was trading at $6.225, over 4% down in the past 24 hours. Similarly, BTC was closer to retesting or breaking below the $23K level.
Read Polkadot [DOT] Price Prediction 2023-24
However, DOT’s drop hit a critical support zone, which could act as an inflection point if demand for the asset increases at the level.
The support zone of $6.0 – $6.2: Can it hold steady?
Is your portfolio green? Check out the DOT Profit Calculator
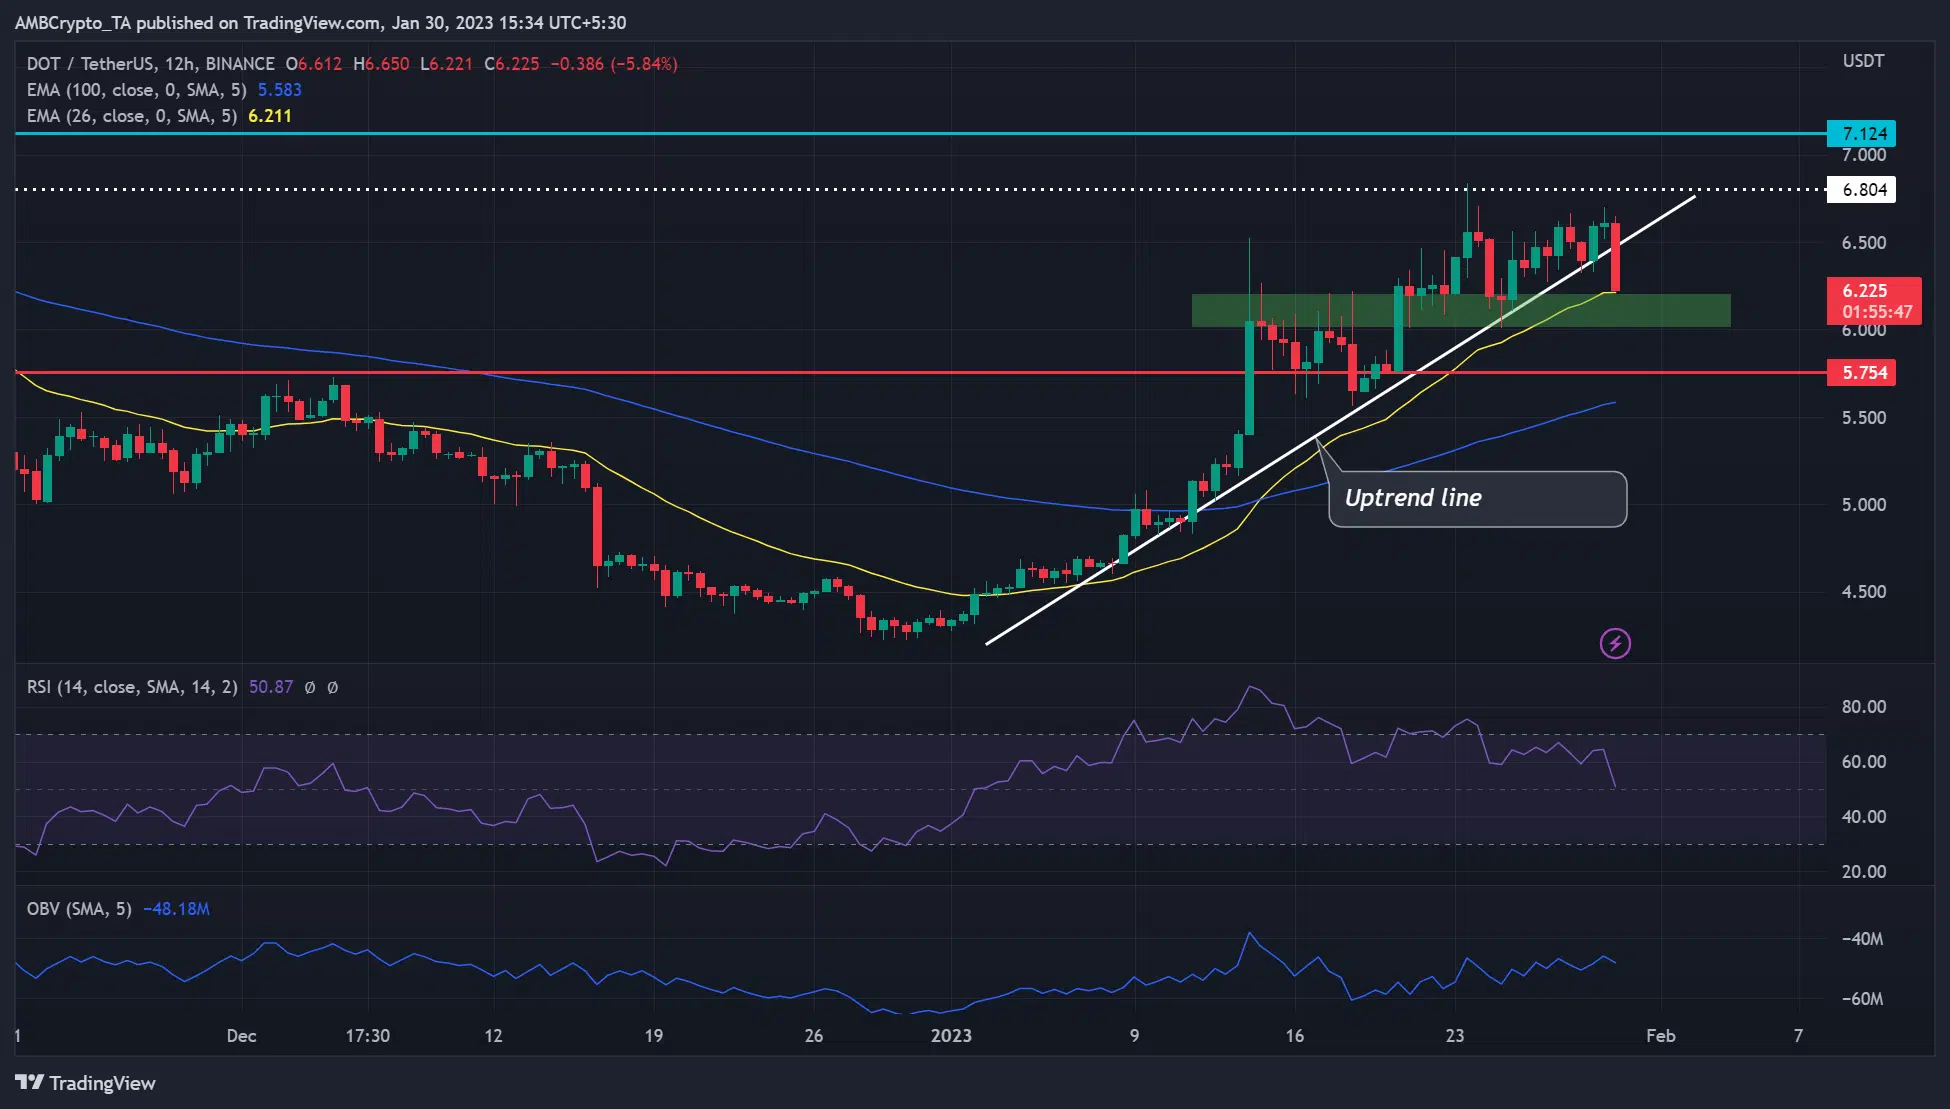
Polkadot’s January rally was slowed by two phases of price consolidation. The second price consolidation phase was the most challenging as it broke below the uptrend line at press time.
But the drop hit a critical support zone of $6.013 – $6.200. The zone was a resistance level before it was flipped into the current support level. If demand for DOT increases at this level, DOT could witness a price inflection and reverse the losses from the sharp drop.
Such an upswing could move DOT above the uptrend line to retest the overhead resistance level of $6.804. In addition, if BTC reclaims the $23.5K level and surges afterward, DOT could reclaim its pre-FTX level of $7.124.
The On Balance Volume (OBV) increased steadily, showing an uptick in trading volume and buying pressure which could boost DOT’s potential uptrend momentum.
But the RSI was 50, showing a neutral structure; thus, the price direction wasn’t definitive. The above bullish bias will be invalidated if bears break below the support zone (green) at $6.000. The plunge could stop at the $5.754 or the 100-period EMA.
DOT saw increased development activity and demand
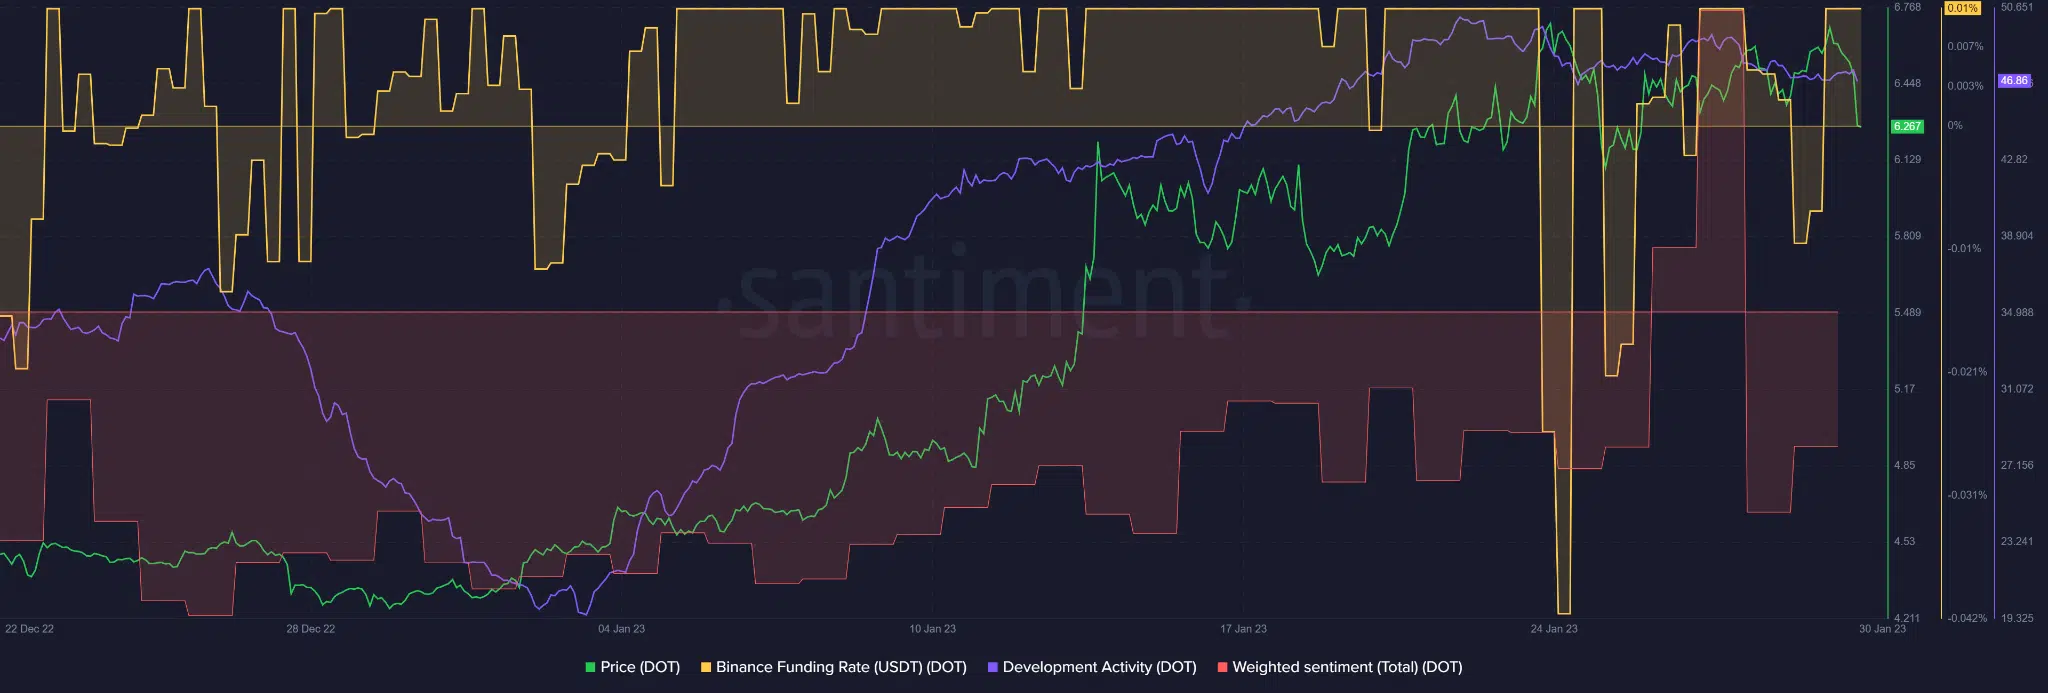
As per Santiment, DOT recorded an impressive building in the network, as evidenced by the rising development activity. The increasing development activity also coincided with DOT’s price surge.
In addition, DOT saw an uptick in the Funding Rate, indicating increased demand and bullish sentiment in the derivatives market. Similarly, the weighted sentiment retreated significantly from the negative territory, showing improved investors’ stance on the asset. The above trend could boost DOT’s recovery and uptrend.


