Polkadot [DOT] hits March lows – Here are key levels to consider
Polkadot [DOT] bears devalued the asset to the March low and bullish OB of $5.1. Will it offer steady ground for bulls?

Disclaimer: The information presented does not constitute financial, investment, trading, or other types of advice and is solely the writer’s opinion
- DOT’s daily chart flashed bearish signs at press time
- However, trading volume surged, and the overall sentiment improved as of 8 May.
Like the rest of the crypto market, Polkadot [DOT] saw considerable correction after Bitcoin [BTC] dropped to the $27k price range. DOT dropped from the $7 psychological level in April and hit the March low of $5.1 on 8 May – over 25% loss.
Is your portfolio green? Check DOT Profit Calculator
At press time, DOT traded at $5.386, lower than the daily session close on 8 May but higher than the lowest $5.170 on the same day. The lower candlestick wick formed after retesting the March low indicates bulls were keen to defend the support. Will they push forward?
Will bulls find a reprieve at $5.15?
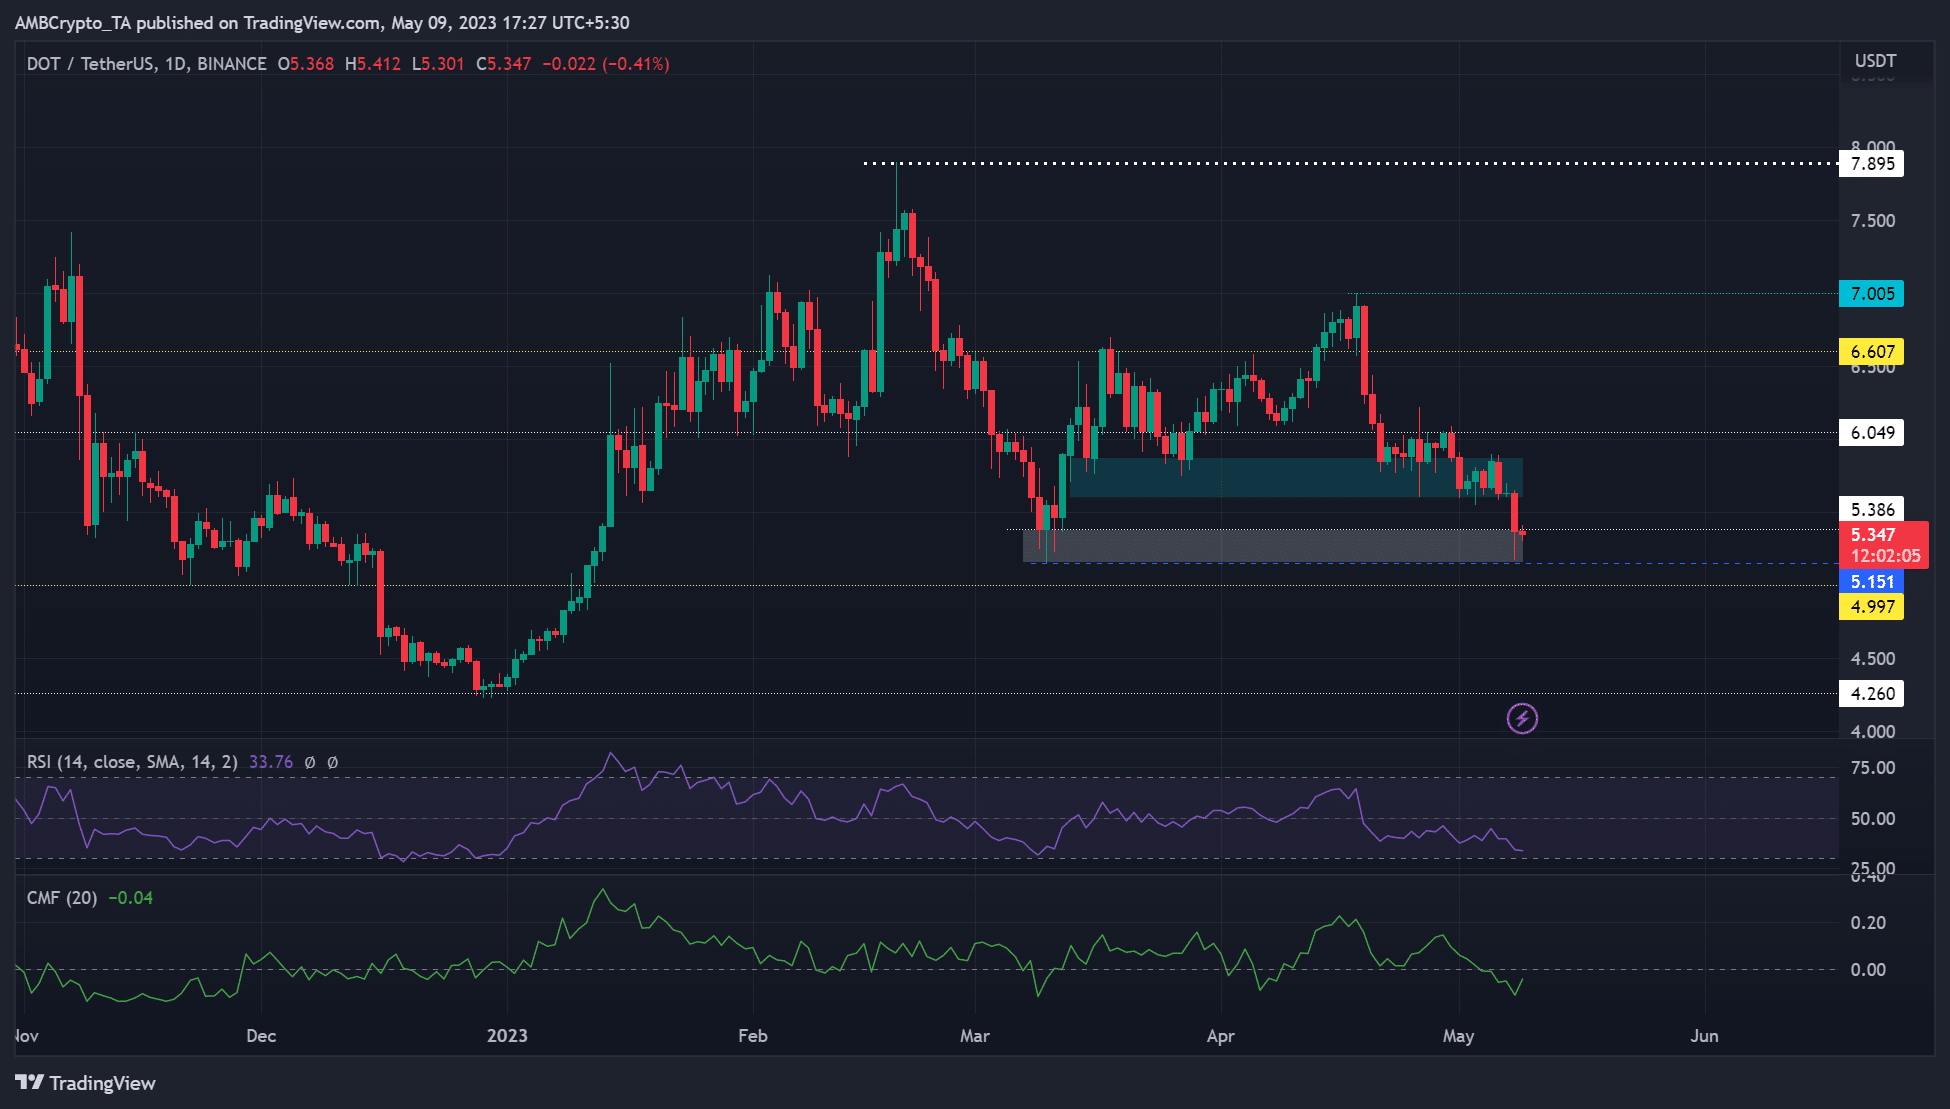
The plunge seen in the first half of March was stopped by the bullish order block (OB) formed on 13 March at $5.386 (white). At press time, DOT bears had breached the previous support zone of $5.60 – $5.87 (cyan), but the downtrend eased at the March low.
Technical indicators didn’t show a reversal at press time. However, the Relative Strength Index (RSI) was near the oversold zone with a flat movement. It showed selling pressure increased but eased slightly at press time – will seller exhaustion give room for bulls?
Moreover, the Chaikin Money Flow (CMF) had an uptick – an indication of a slight improvement in capital inflows for DOT. If the trend persists, DOT could rebound from its March low ($5.15) and rally to the February support level of $6.05 or higher resistance levels at $6.6 or $7.
If that’s the case, buying above bullish OB at $5.386, targeting $6.05, could offer a good risk ratio. Overly ambitious targets can be placed at $6.6 and $7.
A daily session close below $5.15 will invalidate the thesis. Such a drop could push DOT to $4.997 or the December low of $0.4260.
Trading volume and sentiment improved
How much are 1,10,100 DOTs worth today?
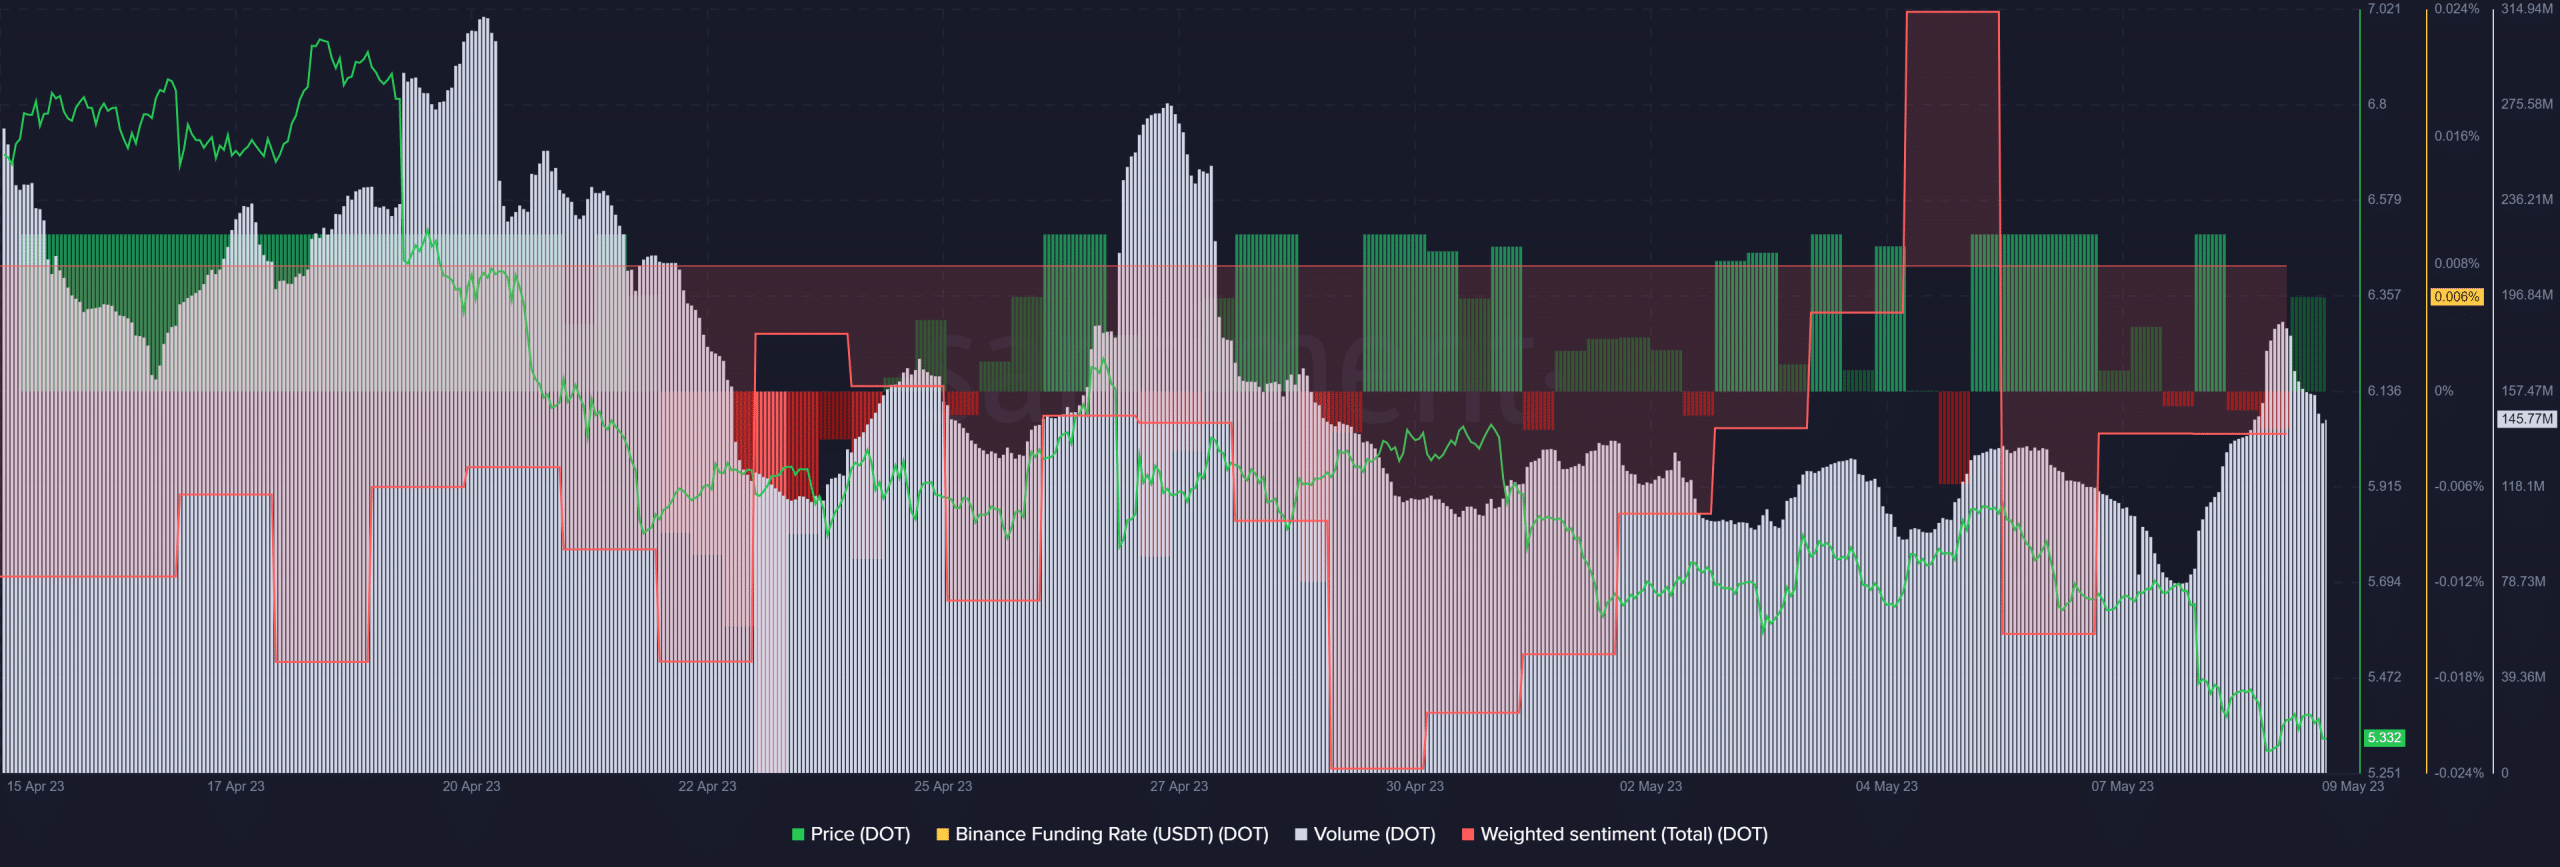
According to Santiment, DOT saw low trading volumes in the past few days. However, there was a slight improvement on 8 May after DOT retested the March low of $5.15.
The move was accompanied by improved weighted sentiment, too – implying that bulls are keen to defend the March low. However, the fluctuating funding rates could undermine a strong recovery.