Polkadot [DOT]: Network development spikes, but bears remain lurking
![Polkadot [DOT]: Network development spikes, but bears remain lurking](https://ambcrypto.com/wp-content/uploads/2023/02/bilge-tekin-eoCdrxVMEbU-unsplash-1.jpg)
- Polkadot is the blockchain network with the highest development activity in the last 30 days.
- DOT’s price might be due for a reversal.
According to a 22 February tweet by Santiment, Polkadot has once again emerged as the leading blockchain network in terms of development activity over the last 30 days. The data highlighted the continued growth and innovation within the ecosystem, as developers and users contributed to its expansion alike.
🧑💻 Top 10 #crypto asset development activity: notable #github commits, past 30 days:
1) #Polkadot $DOT
2) #Kusama $KSM
3) #Cardano $ADA
4) #InternetComputer $ICP
5) #Decentraland $MANA
6) #Ethereum $ETH
7) #Cosmos $ATOM
8) #Status $SNT
9) #VegaProtocol $VEGA
10) #Filecoin $FIL pic.twitter.com/QcnCwsnXDM— Santiment (@santimentfeed) February 22, 2023
Read Polkadot’s [DOT] Price Prediction 2023-24
Per data from the on-chain data provider, developer activity on Polkadot was 483 at press time. Developer activity is an important metric as it offers insights into a crypto project’s commitment to creating a working product, and the likelihood of shipping new features in the future.
In addition, a high development activity often reduces the possibility of the project being an exit scam.
You are safe – but for how long?
In the last 30 days, DOT’s price rallied by 13%. However, with the general market trading sideways in the last week, DOT’s price peaked at $7.79 and has since declined, according to data from CoinMarketCap.
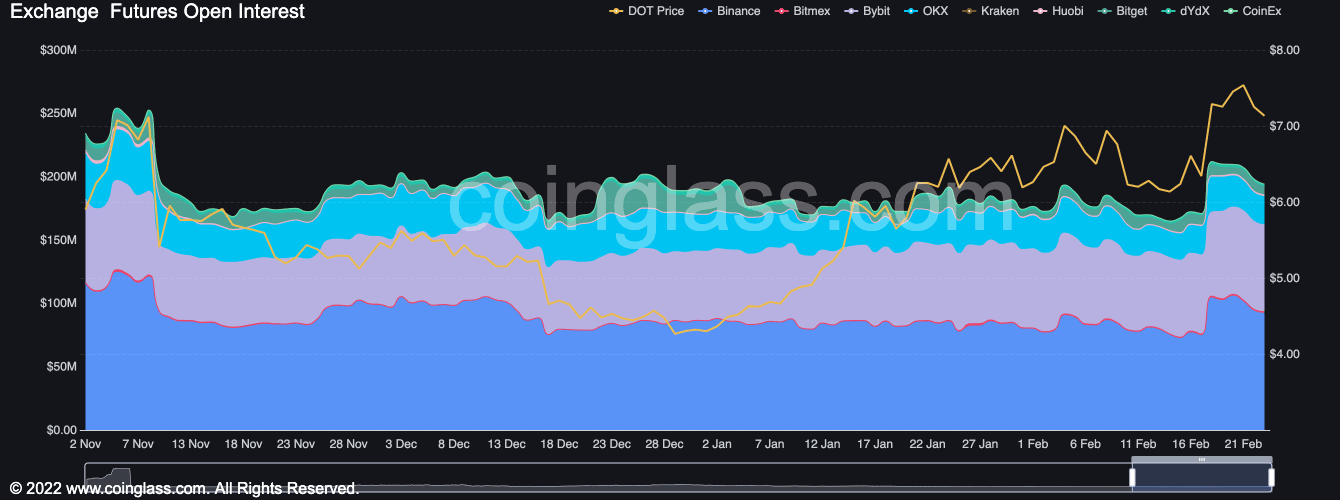
Data from Coinglass showed a decline in the coin’s Open interest since 18 February. During that period, this fell by 8%.
When a crypto asset’s Open Interest falls, this indicates reduced trading activity, as investors may close their positions or take profits. At press time, DOT’s Open Interest was positioned in a downtrend, indicating a sustained decline in positive price movements over the past week.
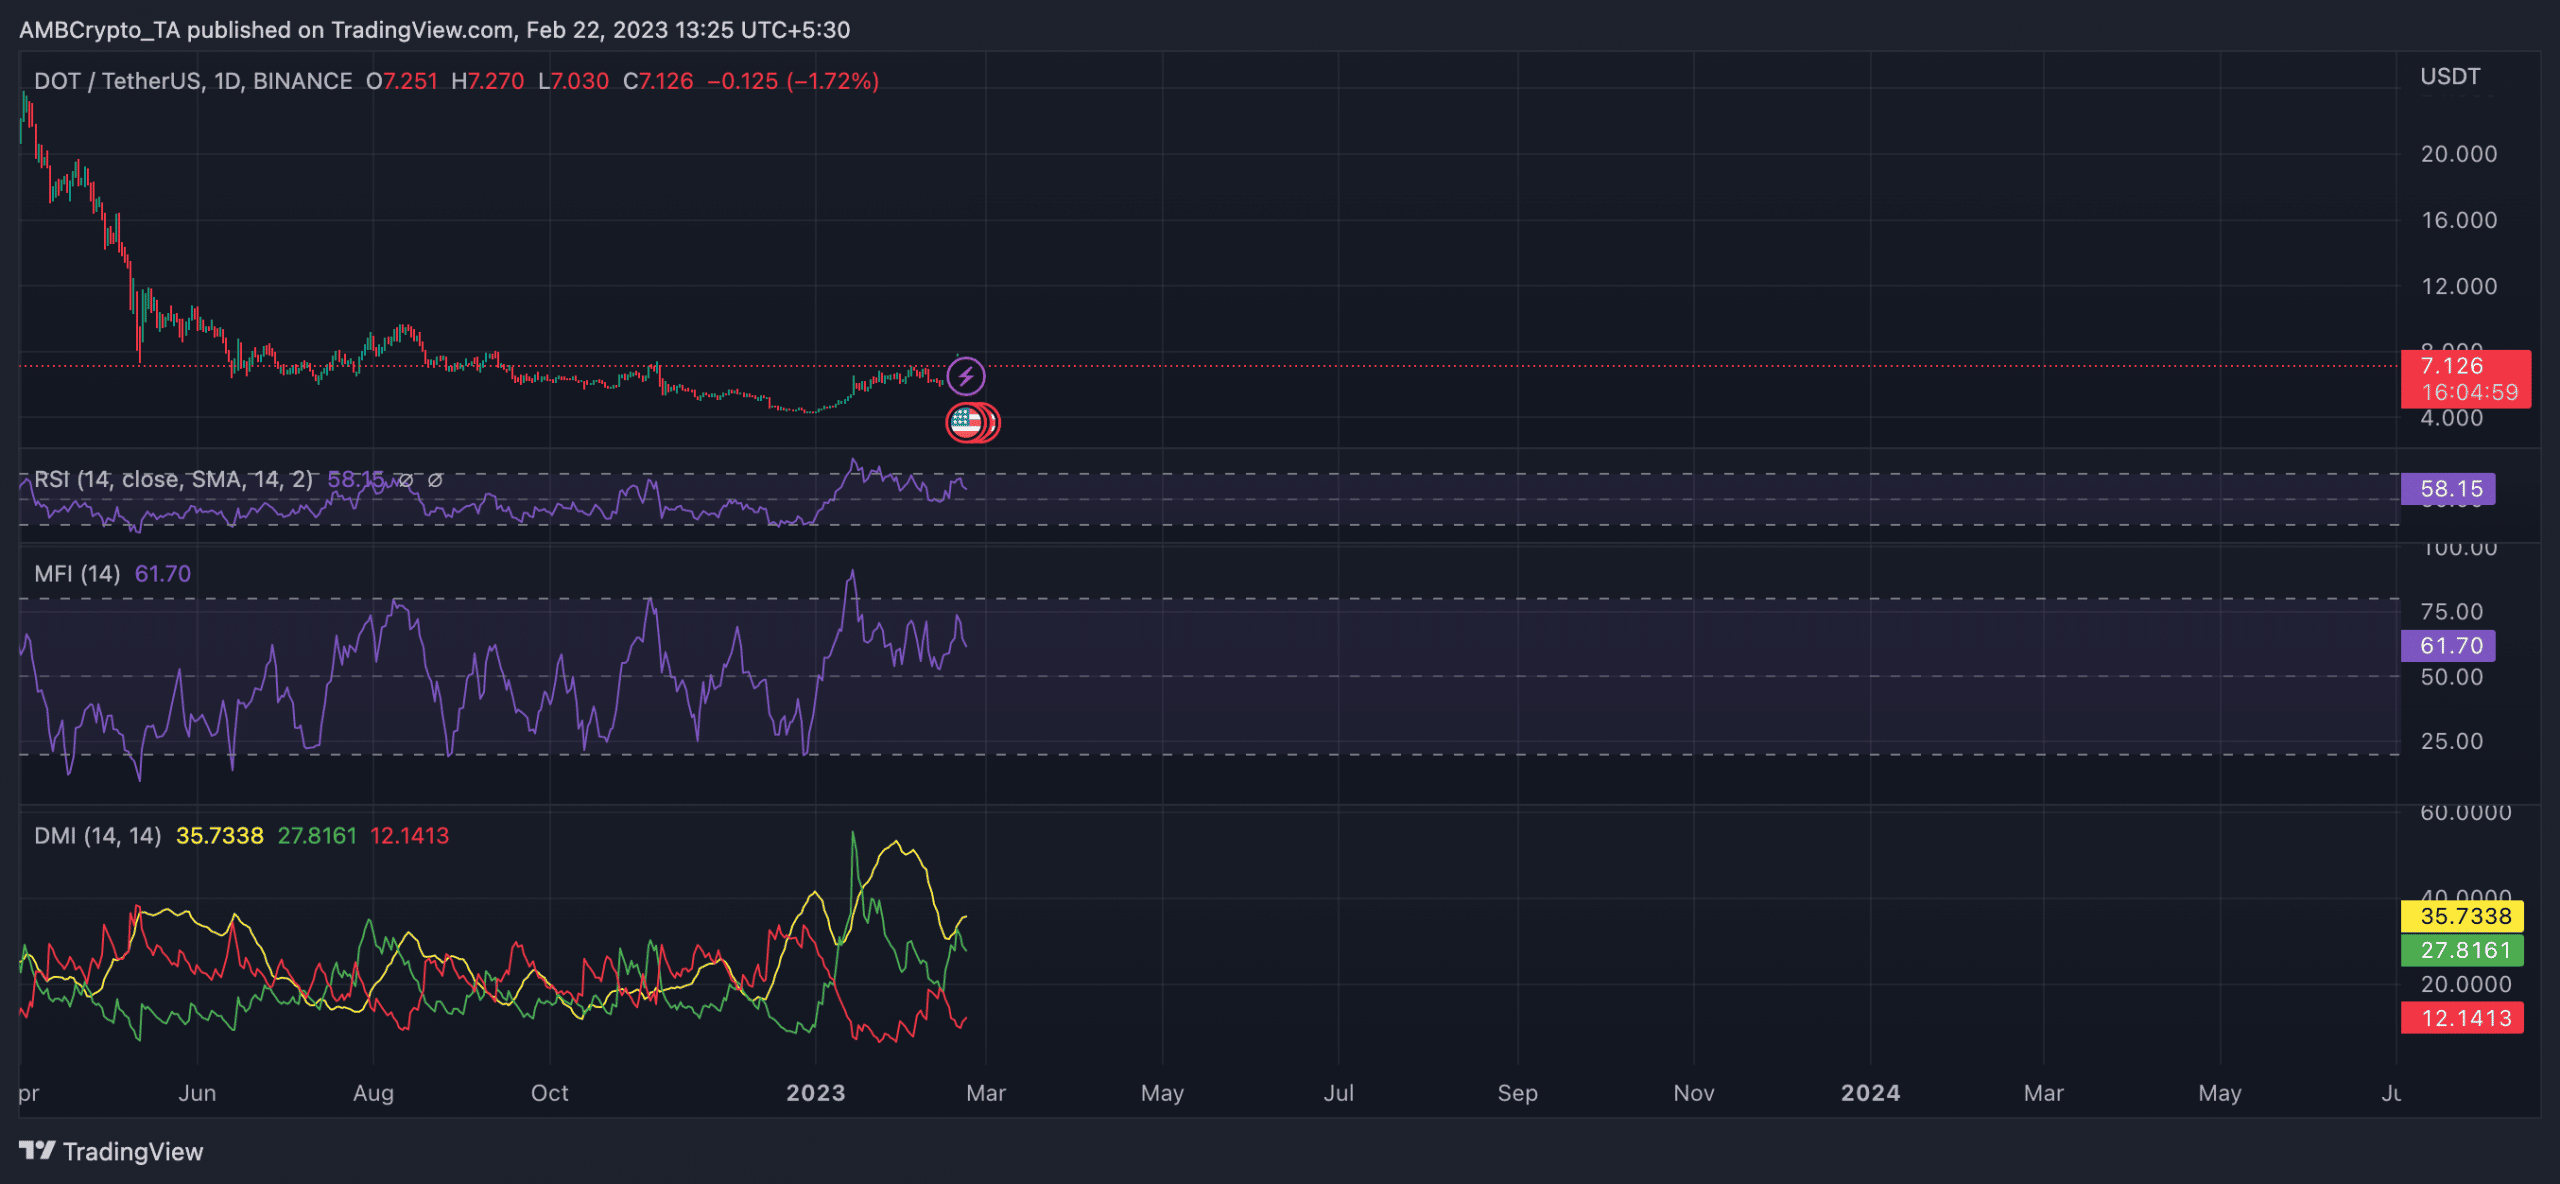
While buyers controlled the DOT market on the daily chart, the persistent decrease in buying pressure might cause the re-emergence of the bears. According to the coin’s Directional Movement Index, the buyers’ strength (green) at 27.81 rested above the sellers’ (red) at 12.14. With increased liquidity exit in the coming days, this might decline further, putting the sellers back in control.
Moreover, the position of DOT’s Relative Strength Index (RSI) and Money Flow Index (MFI) confirmed the weakening accumulation trend in the market. While still above their respective neutral regions, these key indicators trended downwards. At press time, the RSI was 58.15, while the MFI was 61.70.
Is your portfolio green? Check the Polkadot Profit Calculator
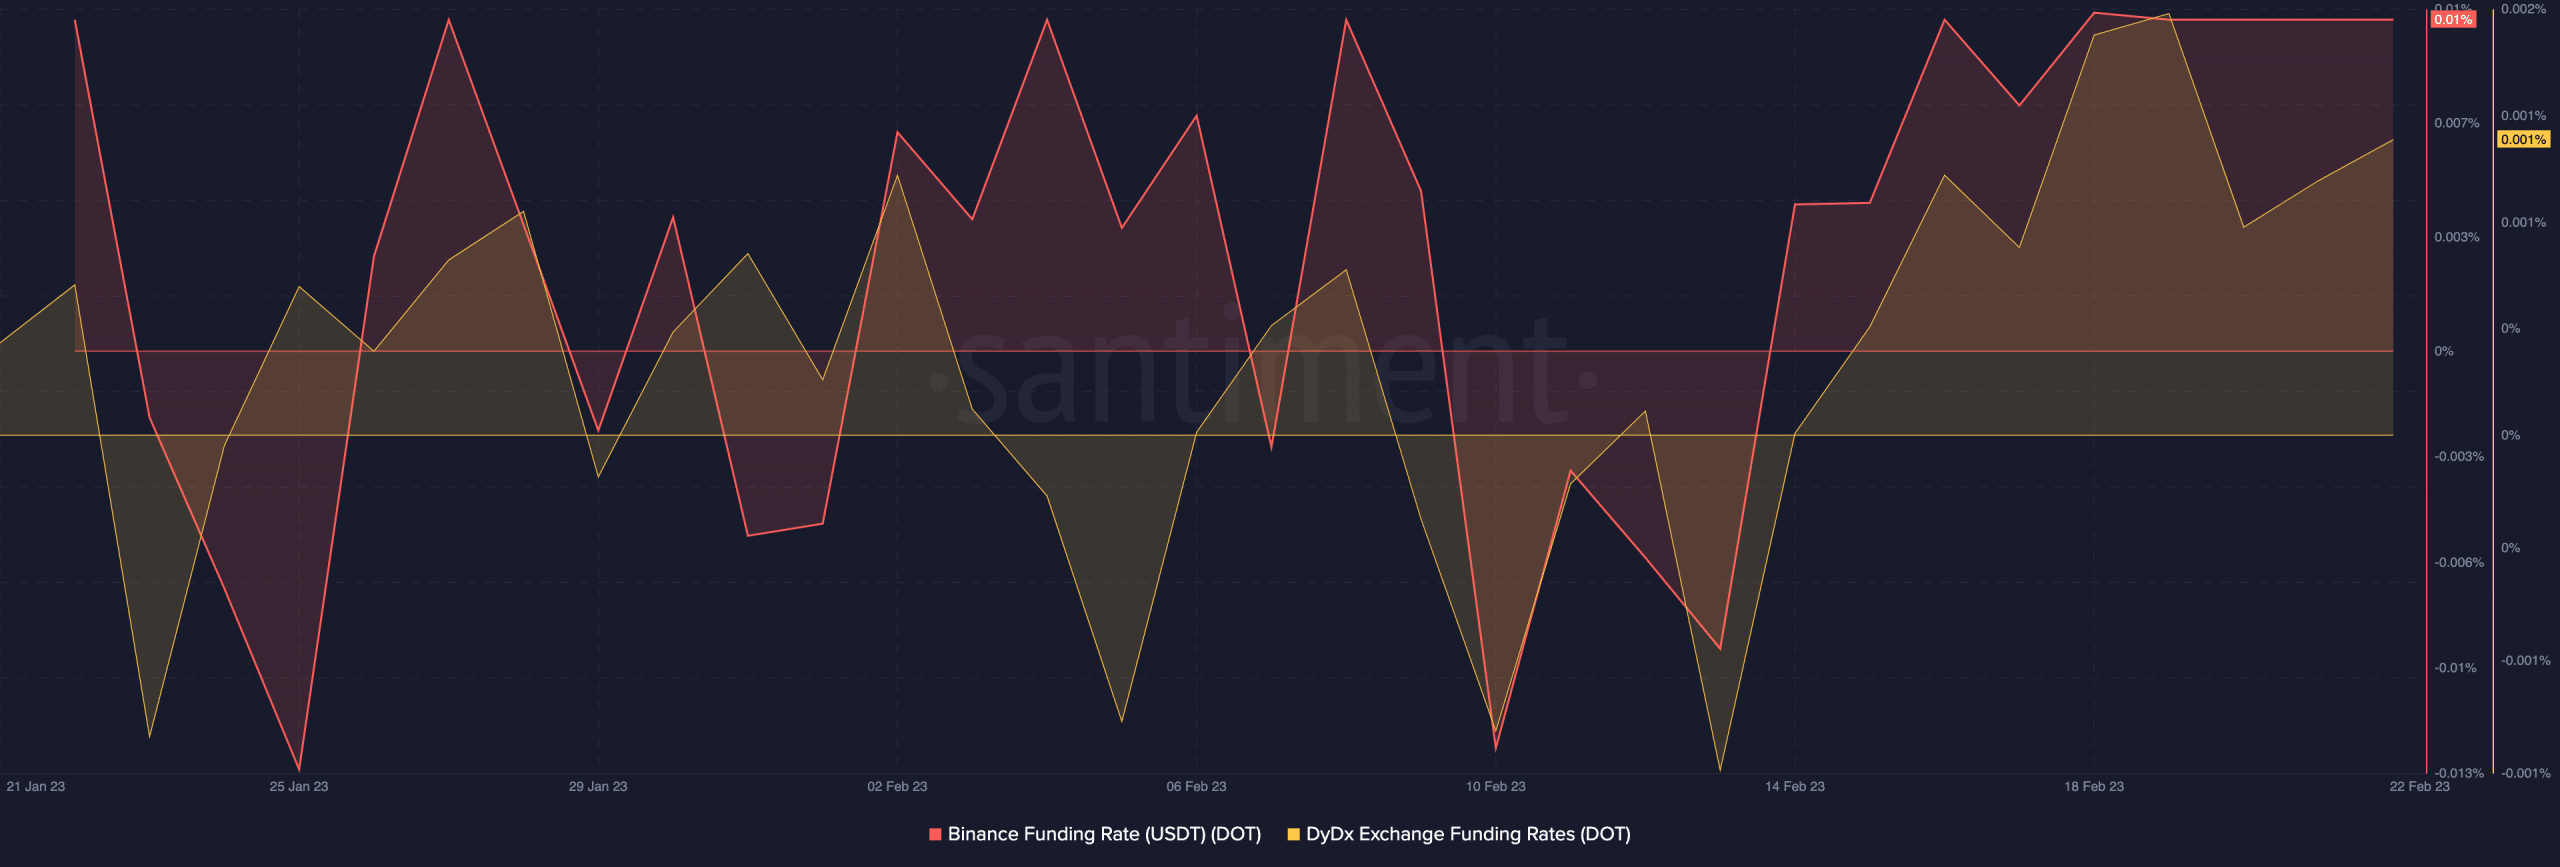
Despite potential price drawdown concerns, investors in DOT’s derivatives market remain unfazed. This indicated a level of confidence in the underlying asset, despite market volatility and uncertainty.
At press time, DOT’s funding rates on leading exchanges Binance and dYdX have been trending upwards in the last week, per data from Santiment.