Polkadot
Polkadot [DOT] remains at the mercy of bears – But there’s a silver lining
There are subtle signs that all hope might not be lost for DOT.
![Polkadot [DOT] remains at the mercy of bears - But there is a silver lining](https://ambcrypto.com/wp-content/uploads/2024/06/dot-jai-fi-1000x600.jpg)
- DOT continued to trend below the 200-period moving average.
- Despite the market’s ‘Extreme Fear’ sentiment, a dramatic 138.77% surge in trading volume indicated growing trader interest.
Polkadot [DOT] has established itself with a terrible performance this year, even amid market rallies and ETF hype.
The world’s eighteenth-largest cryptocurrency has steadily decreased, with very little signs of revival. But what if there is some light at the end of the tunnel?
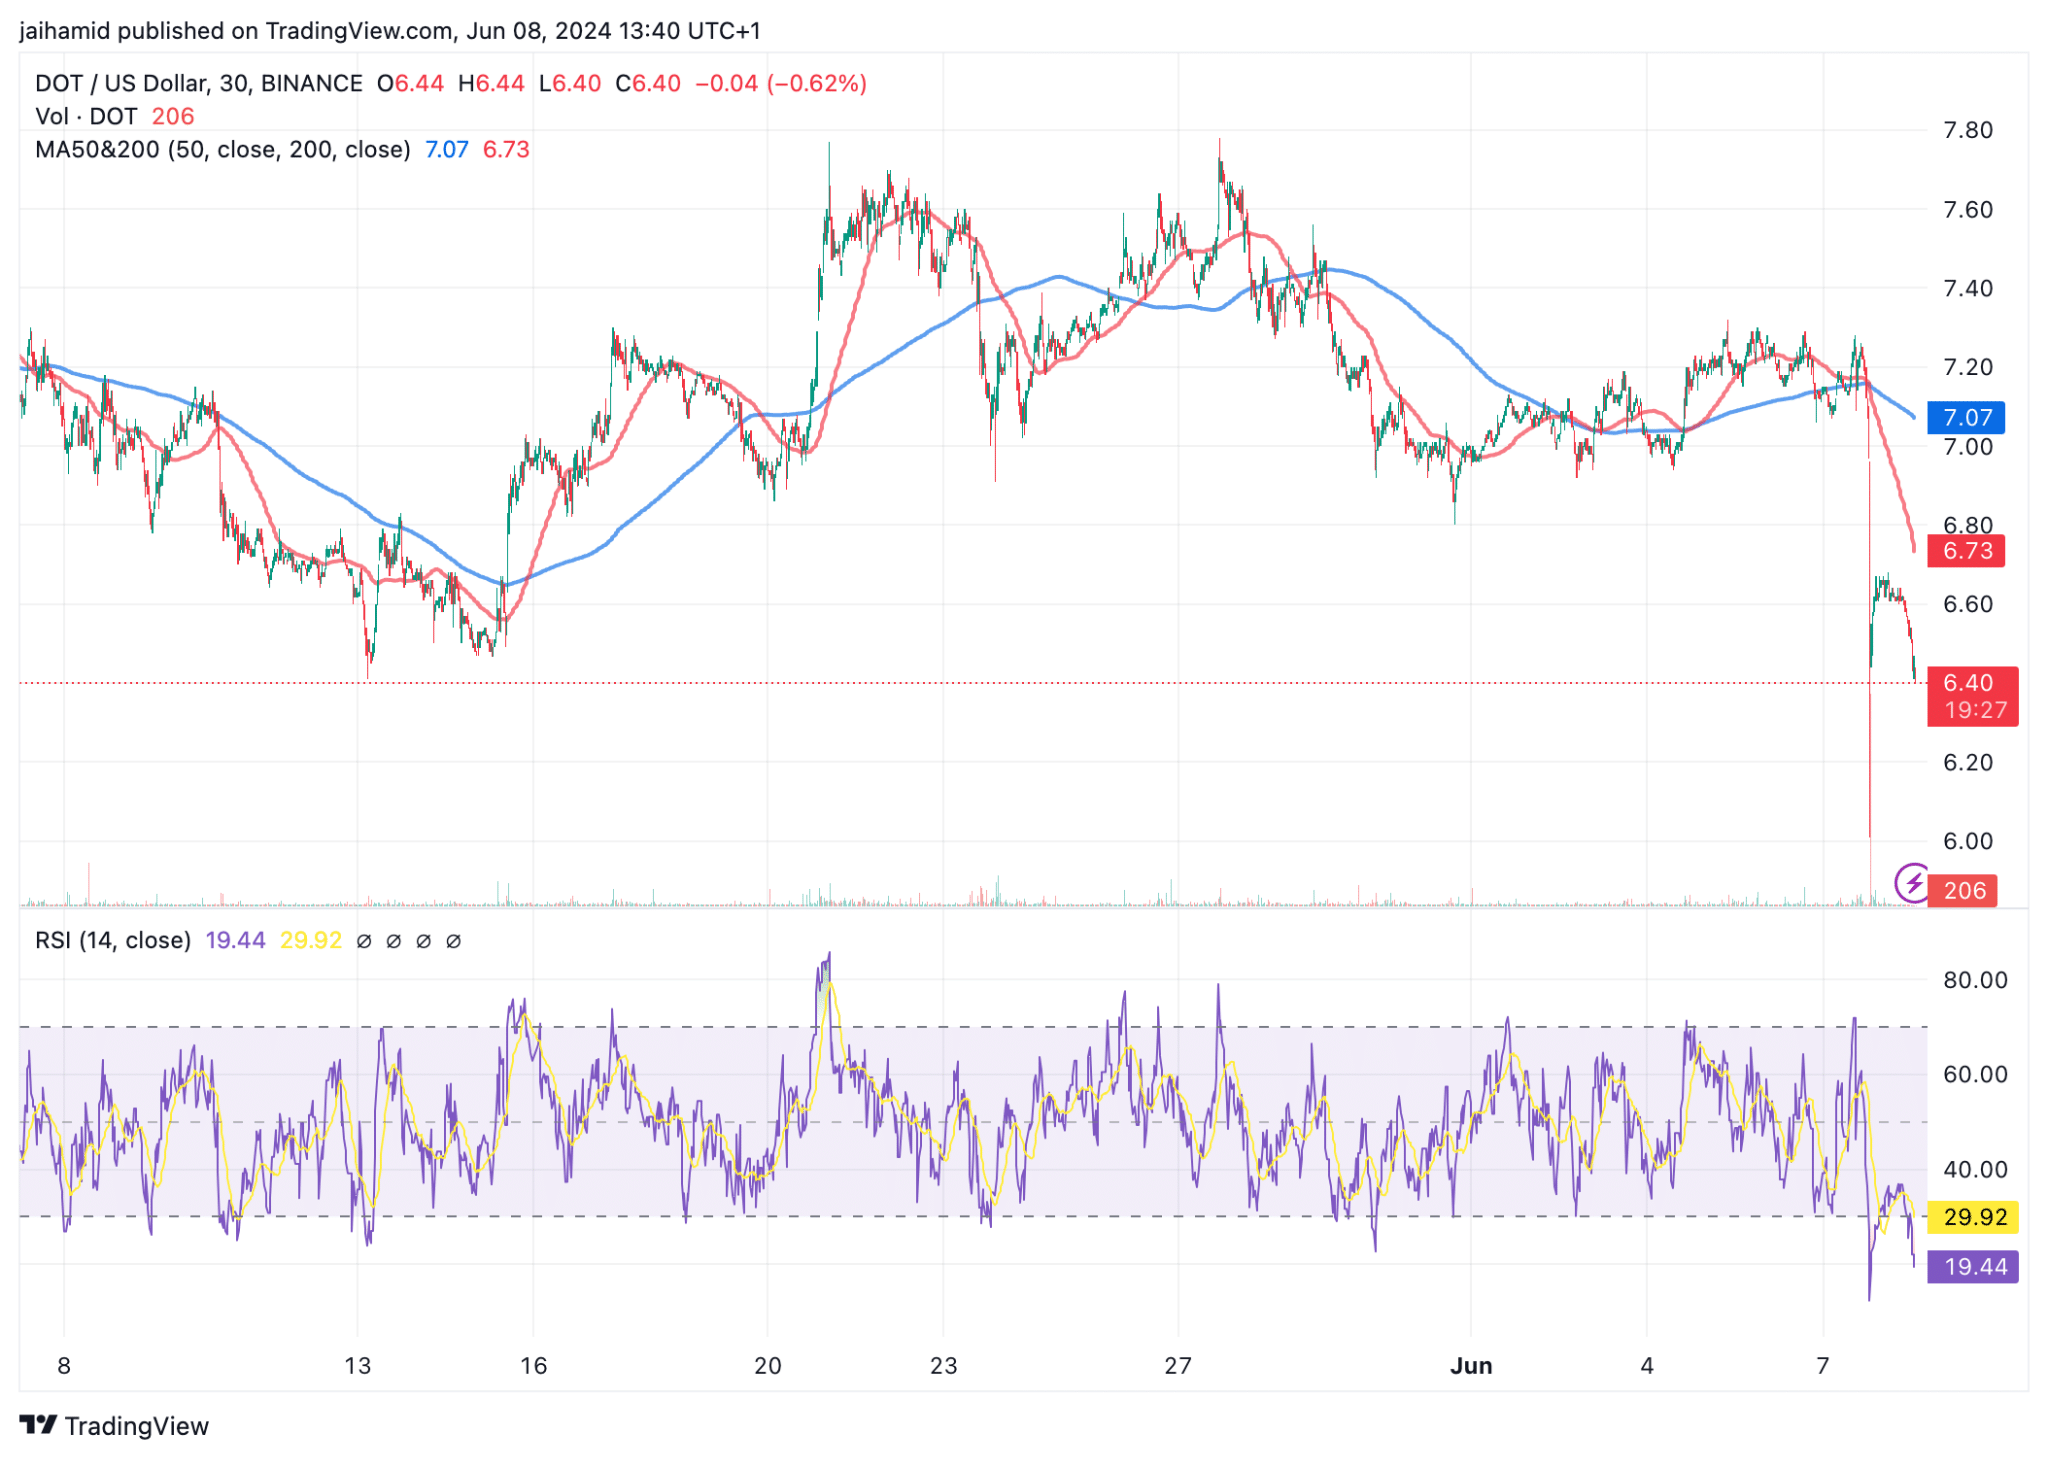
From a technical perspective, the 50-period moving average (blue line) and the 200-period moving average (red line) show crossover periods.
However, despite these crossovers, the price has been unable to sustain any bullish momentum, trending below the 200-period moving average for extended periods, indicative of a bearish trend.
The Relative Strength Index (RSI) sat around 19 at press time, well into the oversold territory.
This suggested that DOT has been heavily sold off, potentially oversold, which sometimes precedes a price correction or reversal if buyers step back in seeing value at lower price levels.
DOT’s social volume has steadily declined over the past two months, coinciding with persistent price decreases.
However, DOT’s derivatives data look intriguing at the moment. They indicate that there might be a silver lining to the bearish momentum.
First, there’s a dramatic increase in trading volume, up 138.77% to $506.95 million, suggesting a surge in trader interest or speculative activity. And liquidity seems to have slowed down over the past week, too.
There is still a prevailing bearish sentiment among the traders.
The ‘rekt’ data tells a story of recent market conditions being unfavorable to many traders, particularly those holding long positions, given the disproportionate amount of long liquidations compared to shorts.
Read Polkadot’s [DOT] Price Prediction 2024-25
The Polkadot Fear and Greed Index is 24%, signaling “Extreme Fear” among investors.
This sentiment is driven by a combination of factors, including negative perceptions on price stability and high volatility, which suggest that the market is wary of further declines and uncertainty in price movements.


