Polkadot [DOT] traders can use THIS strategy to navigate DOT’s downturn
Will DOT’s buyers finally regain lost ground?
![Polkadot [DOT] traders can use THIS strategy to navigate DOT’s downturn](https://ambcrypto.com/wp-content/uploads/2024/11/DOT-1.webp)
- Polkadot continued its long-term downtrend and hovered around its multi-yearly lows
- For DOT to regain a bullish outlook, it must find a decisive close above the 20-day and 50-day EMAs
Polkadot’s [DOT] recent price movements revealed a steep bearish trend. The altcoin approached its long-term support level and returned to levels seen in 2020.
DOT was trading at around $3.85 at press time, up nearly 2% in the last 24 hours. However, the overall trend remained bearish. With ongoing selling pressure, can buyers find the momentum to reclaim important resistance levels?
DOT’s fight near a key support level
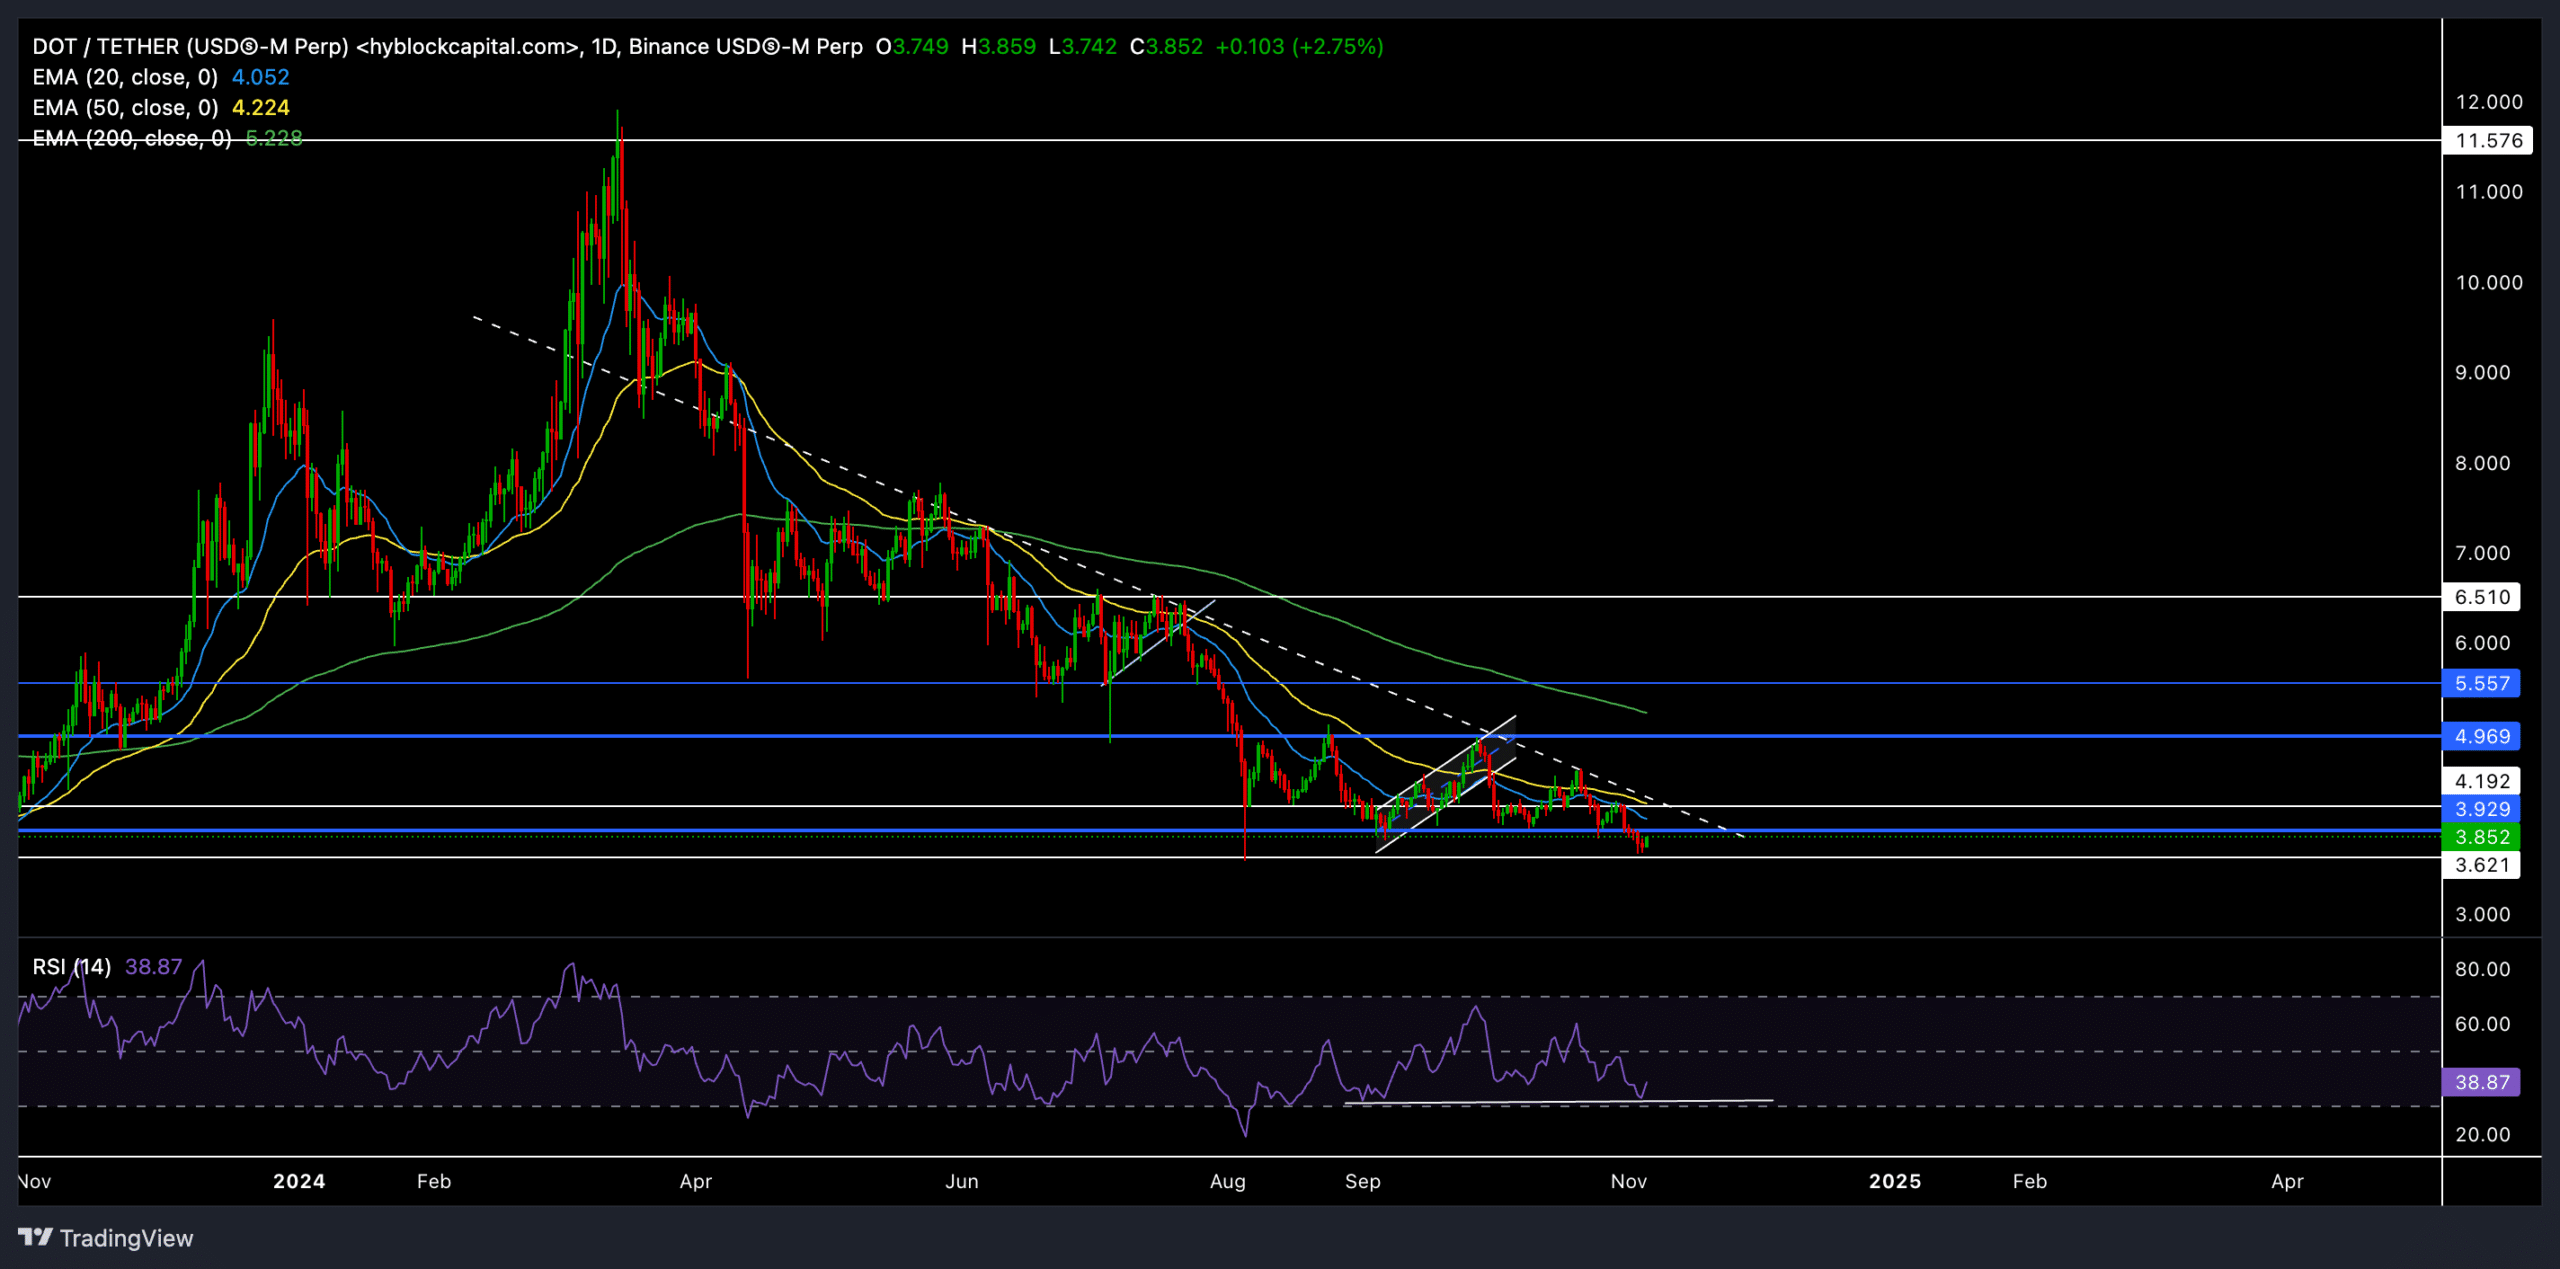
DOT steeply descended over the last few months, consistently failing to rise above the $4.9 resistance level. At the time of writing, the altcoin was trading well below the 20-day EMA ($4.05), 50-day EMA ($4.22), and 200-day EMA ($5.23).
The repeated rejections from these moving averages and the inability to break through the 6-month trendline resistance (white, dashed) have intensified the selling pressure. DOT’s recent drop below the $3.9 support level (now resistance) brought it closer to its multi-year low of around $3.6 – A critical level to monitor.
DOT’s price movements suggested high volatility in the near future. If the altcoin can gather enough bullish momentum to jump above the $3.9 resistance level again, it could test the 20/50-day EMAs. Regaining these EMAs is crucial for buyers to gain an advantage in the short term and could potentially open the route to test higher resistance at $4.9.
However, the bearish outlook remained strong due to the overall downtrend. A drop below the important $3.6 support could speed up the decline and push DOT to explore new lows.
Also, the RSI had a reading of 40, at the time of writing. Here, it’s worth noting that RSI’s recent higher lows hinted at a bullish divergence with the price action’s lower lows.
Key levels to watch
Support: The immediate support level was found at $3.6 – A multi-year low that’s crucial psychologically. Falling below this could lead to further decline.
Resistance: The first resistance level to watch was at $3.9, followed by the 20-day EMA at $4.05 and the 50-day EMA at $4.22. A decisive move above these levels could give DOT buyers a chance to regain some market control.
Derivatives data revealed THIS

Derivatives data revealed mixed feelings among DOT traders. The 24-hour long/short ratio had a reading of 0.9029, slightly favoring short positions and indicating some caution among traders. However, the Binance and OKX long/short ratios were significantly bullish, with Binance at 4.7013 and OKX at 3.58 – A sign that traders on these platforms may be hopeful about a recovery.
Traders should closely watch broader market trends, especially Bitcoin’s movements.


