Polkadot, Ethereum Classic, Loopring Price Analysis: 14 November

The crypto market somewhat flashed mixed signals after slightly preferring the bulls in their revival phase. Consequently, near-term technical indications of Polkadot and Loopring flashed mixed signals.
While Ethereum Classic marked an uptrend over the past two weeks, its indicators hint at decreased bearish power.
Polkadot (DOT)
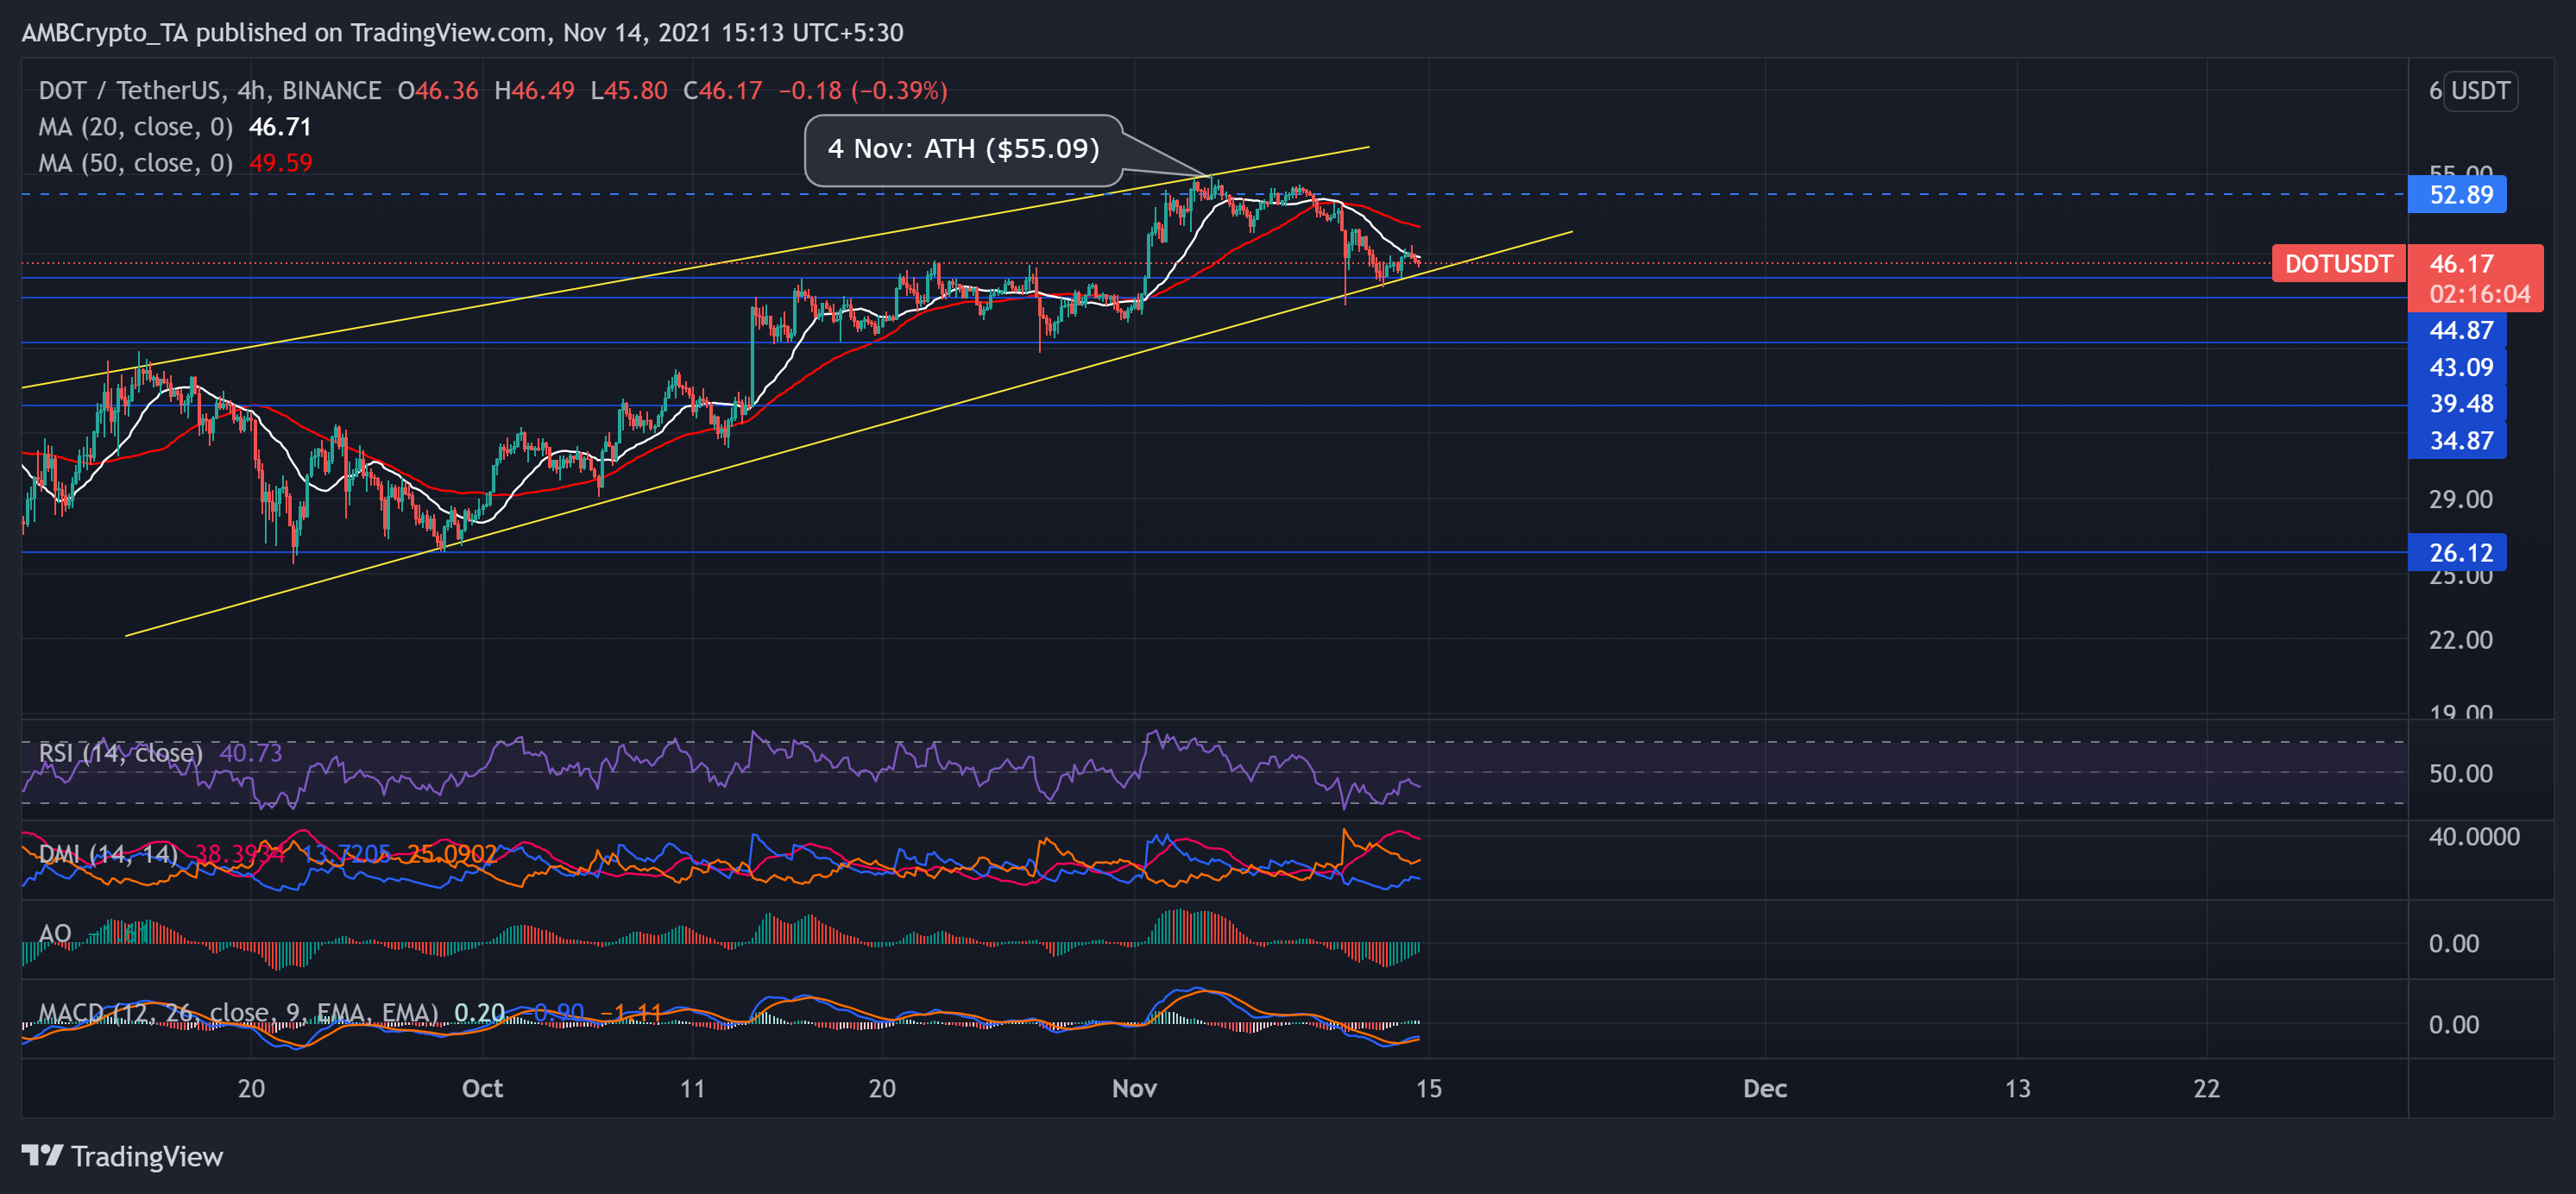
Since 30 September, DOT price action undertook a steady rise as the price swayed in an uptrend. After this, DOT witnessed a staggering 104% rally over the next 35 days to poke its ATH at $55.09 on 4 November. However, DOT bears showed hesitancy as the price gradually saw a nearly 16.5% correction to date. Over the past week, the bears exhibited sustained pressure as the price fell below its 20 (white), 50 (red) SMA.
While bears ensured resistance at the $53-mark, they tried to push below the $44-mark (immediate support). Consequently, DOT traded at $46.17 at press time, after noting a 5.8% decline in just two days. Presently, the near-term technical indicators flashed mixed signs.
The RSI displayed revival signs but was southbound after standing at the 40-mark. Also, the DMI visibly confirmed the selling momentum with a high directional trend. Nevertheless, the AO and MACD hinted at a possible revival if the buyers could gather momentum.
Ethereum Classic (ETC)
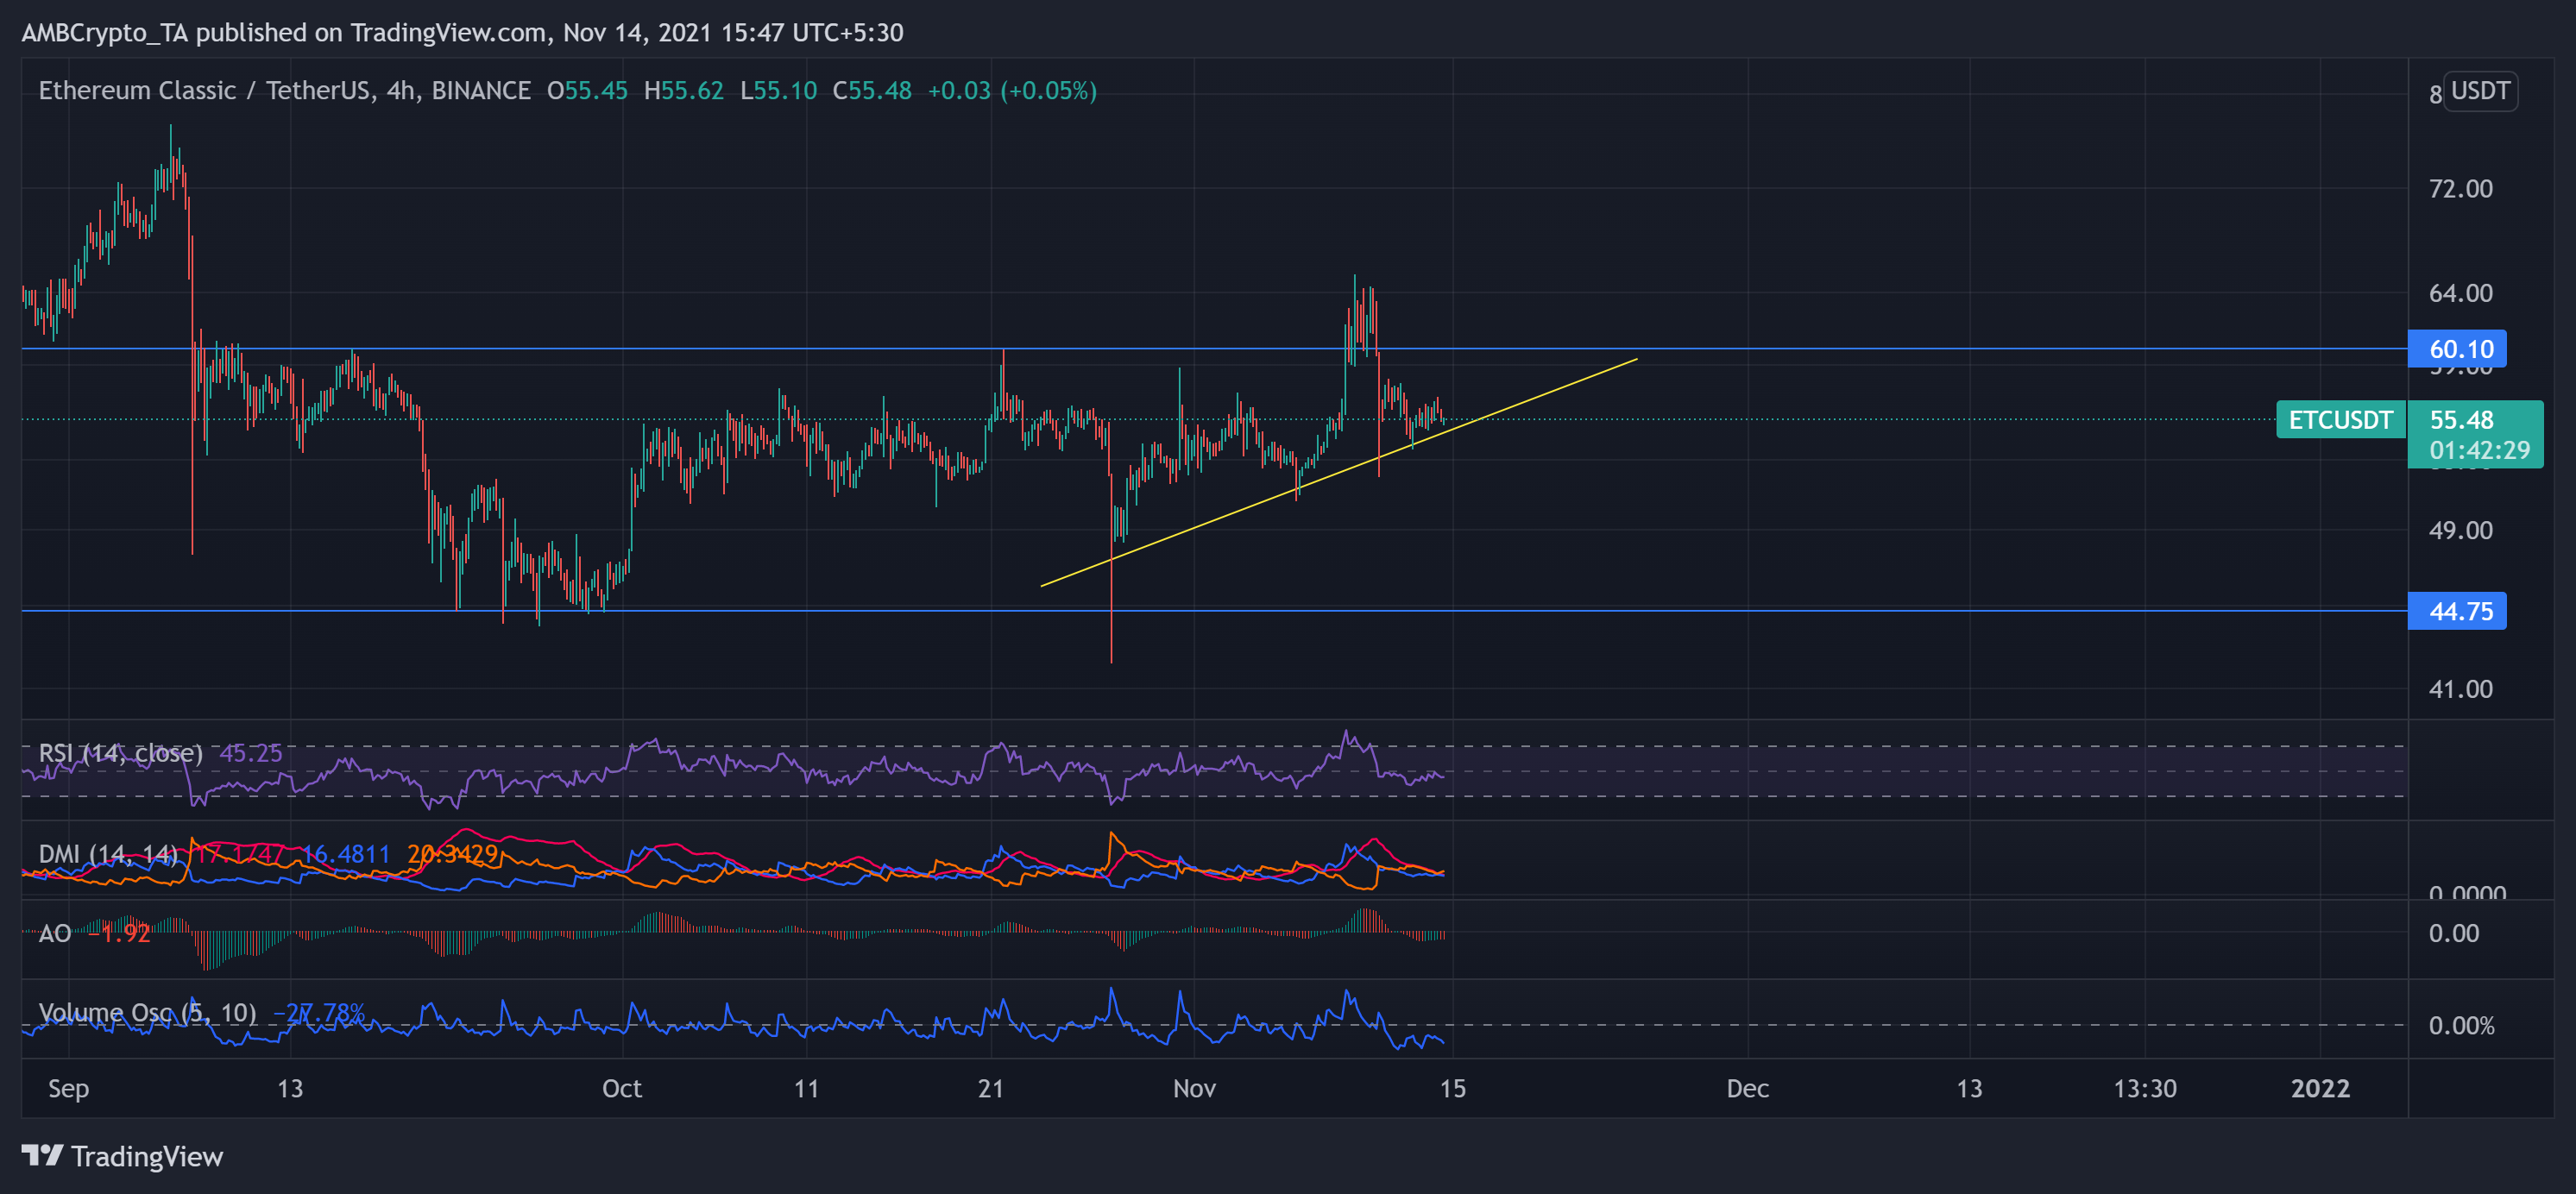
Over the past two months, ETC traversed around the bounds of its immediate resistance and support points. On 27 October, the alt touched its 14-week low at $42.15 and bounced back between the $44 and $60-mark. The bulls then took over while the price rallied by 39.6% to poke its ten-week high on 9 November at $65.31.
Nevertheless, the bulls couldn’t sustain a long-drawn advantage as the prices retraced by 15% to date. Also, the near-term indicators complemented the analysis by suggesting a bearish preference. At press time, ETC traded at $55.48.
The RSI stood below the half-line at the 45-mark. Additionally, the DMI and AO readings confirmed increased selling strength. However, it becomes crucial to note that retracement was on low trading volumes while ETC saw a 14.13% 17-day ROI. The lower trendline depicted an uptrend and confirmed the previous statement.
Loopring (LRC)
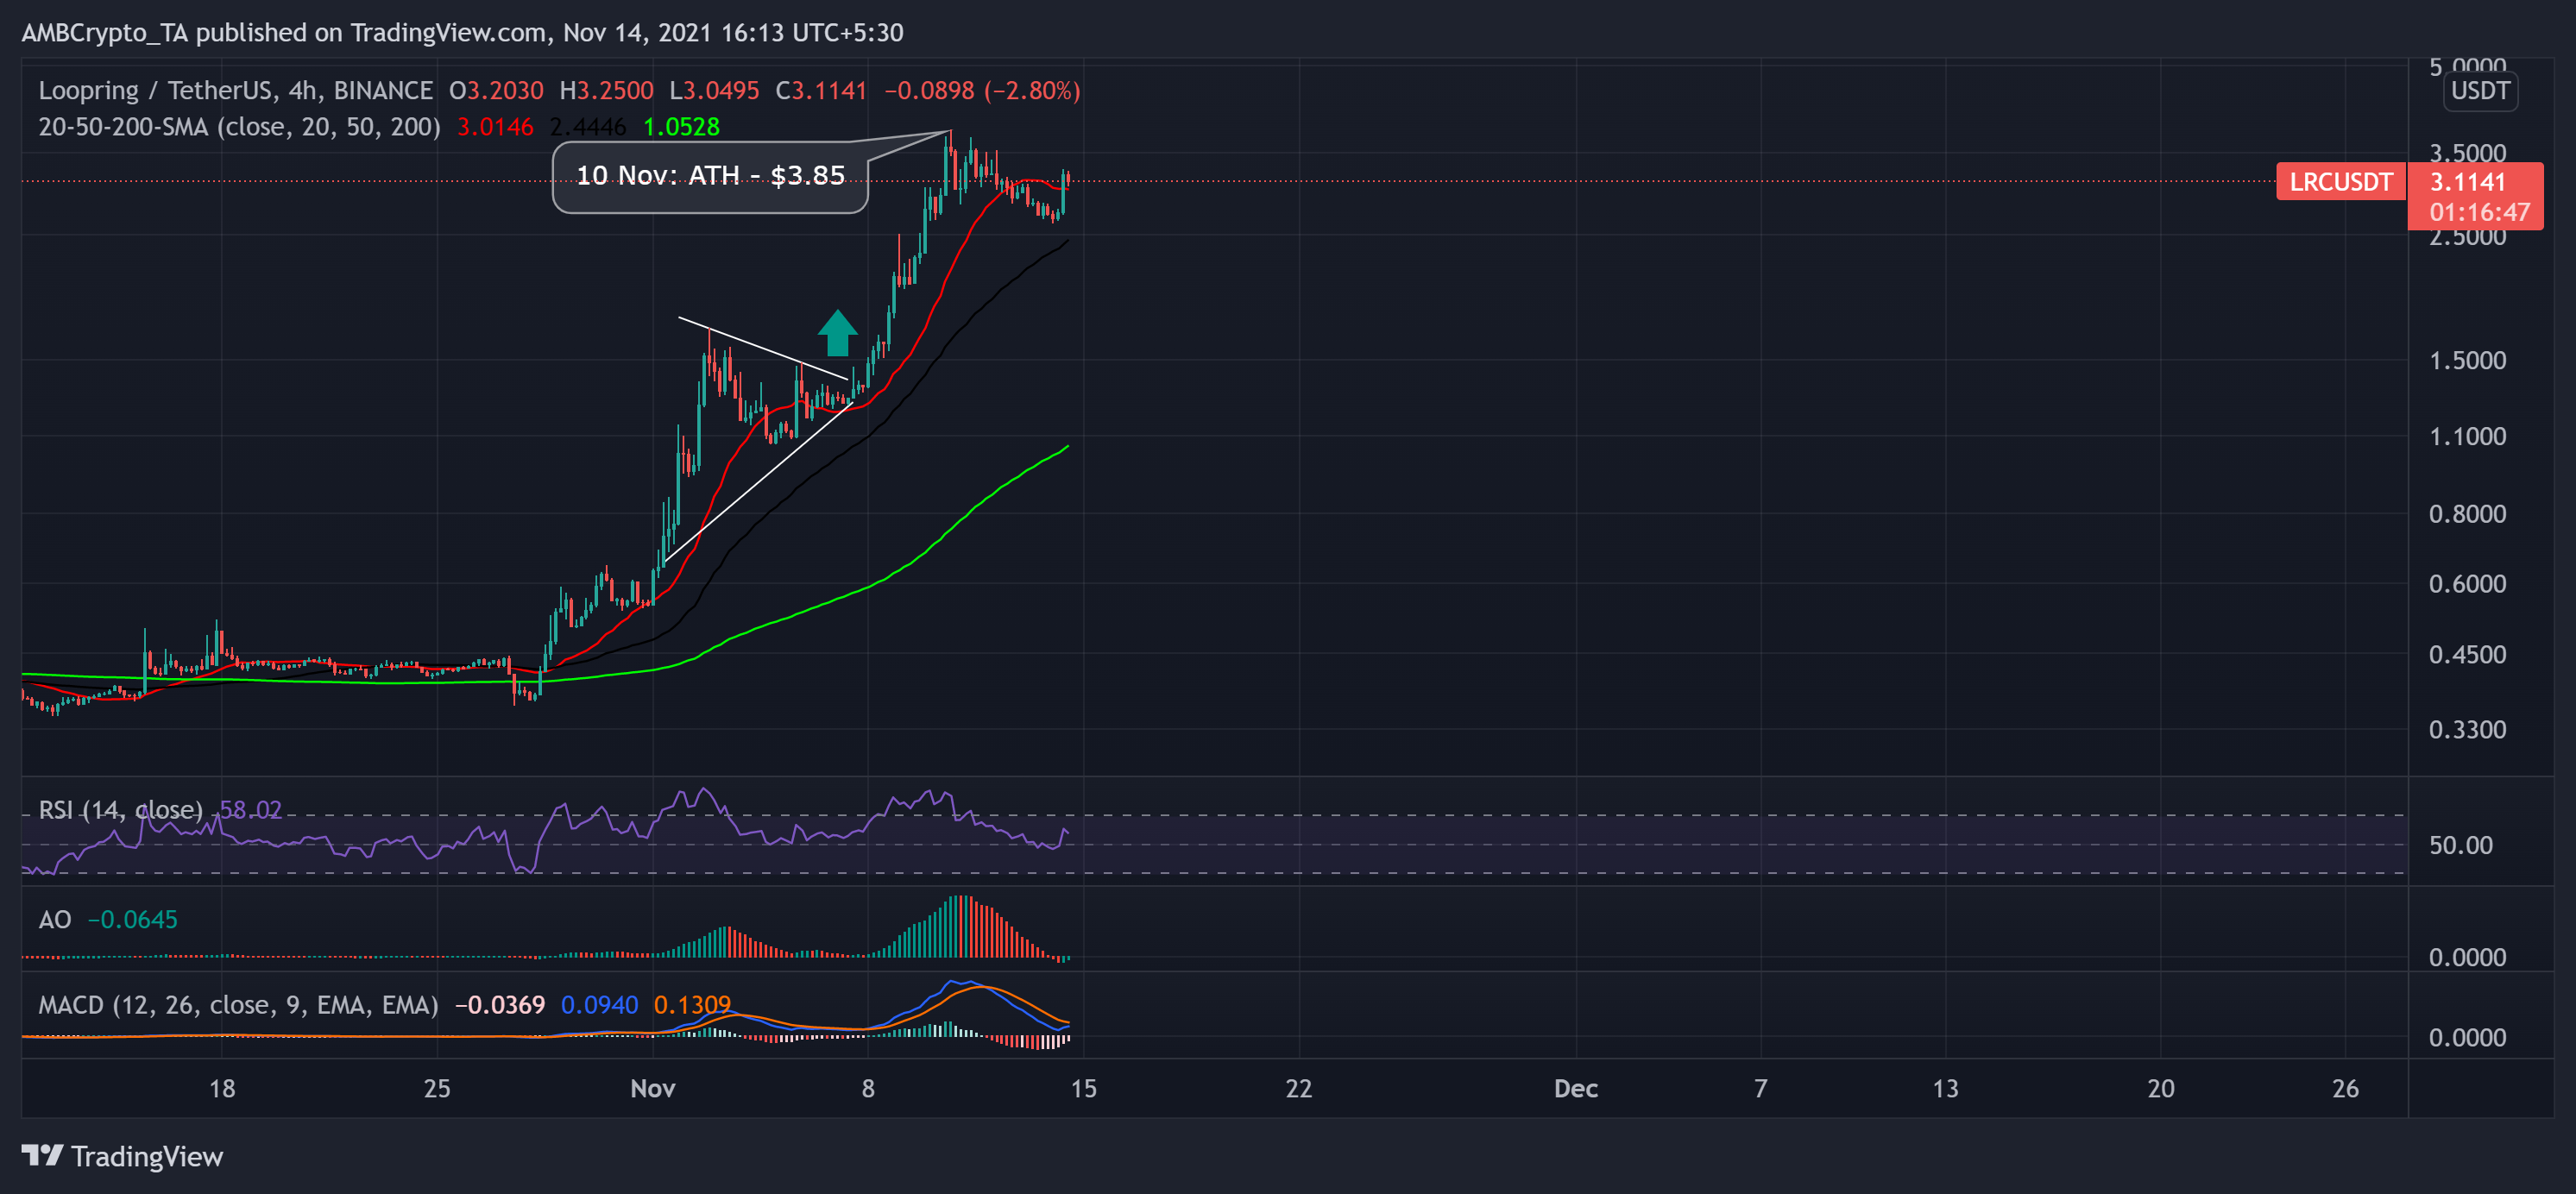
LRC observed a gigantic price rally of over 800% from 28 October until 10 November. Post a bull-pennant breakout on 7 November, LRC entered into price discovery and found its ATH at $3.85 on 10 November. As bears tried to counter the overall bullish momentum, price action witnessed a decent pullback.
However, LRC bulls refused to give up their power as the altcoin registered a 12.7% increase on its daily charts. As a result, the price traded above its 4-hour 20-50-200 SMA. The AO and MACD readings confirmed the gathering buying momentum. Further, the RSI stood at the 58-mark favoring the bulls. However, it seemed to head towards the half-line.


