Polkadot, Ethereum Classic, Maker Price Analysis: 27 December

Polkadot moved below its $16.05-support level, with its indicators highlighting more bearishness for the price over the coming trading sessions. Other altcoins such as Ethereum Classic and Maker moved within fixed channels on their charts and awaited further cues from market leaders BTC and ETH.
Polkadot [DOT]
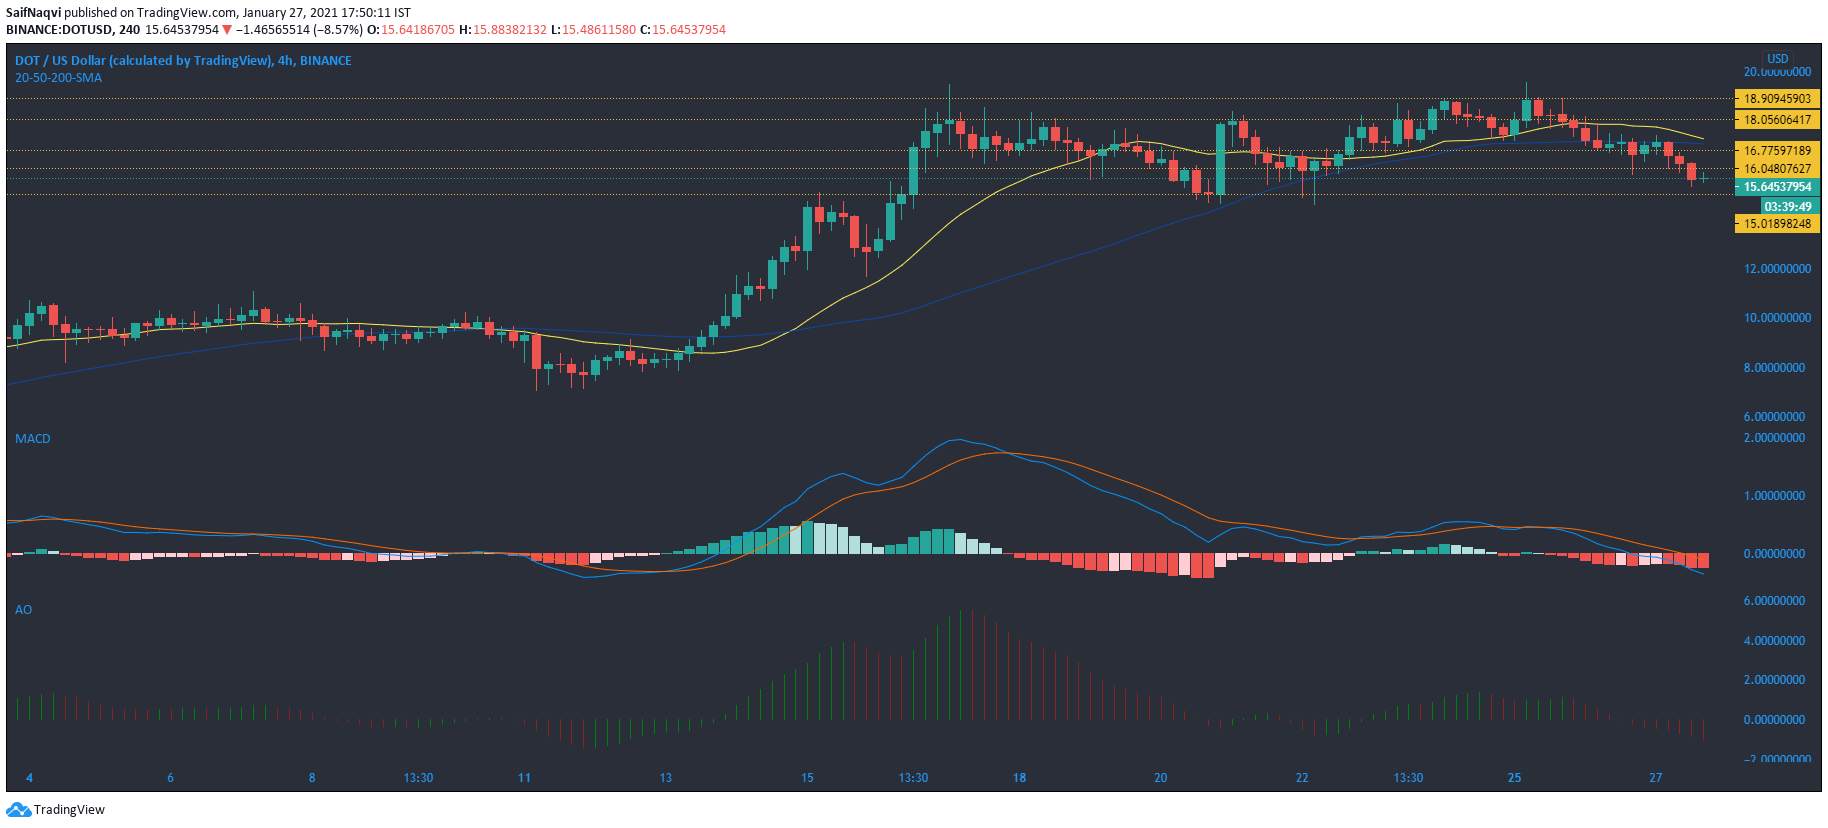
The world’s fourth-largest cryptocurrency, Polkadot was trading at $15.7, at press time, down by 8.6% in 24 hours. The fall was a sign of the selling pressure that gripped the market since the price was unable to break above the $18.9-resistance. On the charts, the candlesticks moved below the 20-SMA (yellow) and 50-SMA (blue) and signaled a bear market for DOT. Moreover, the indicators suggested that the bearish momentum was on the up and that the price could move lower on the charts.
The Awesome Oscillator’s red bars rose in length below zero and so did the red bars on the MACD’s histogram.
Ethereum Classic [ETC]
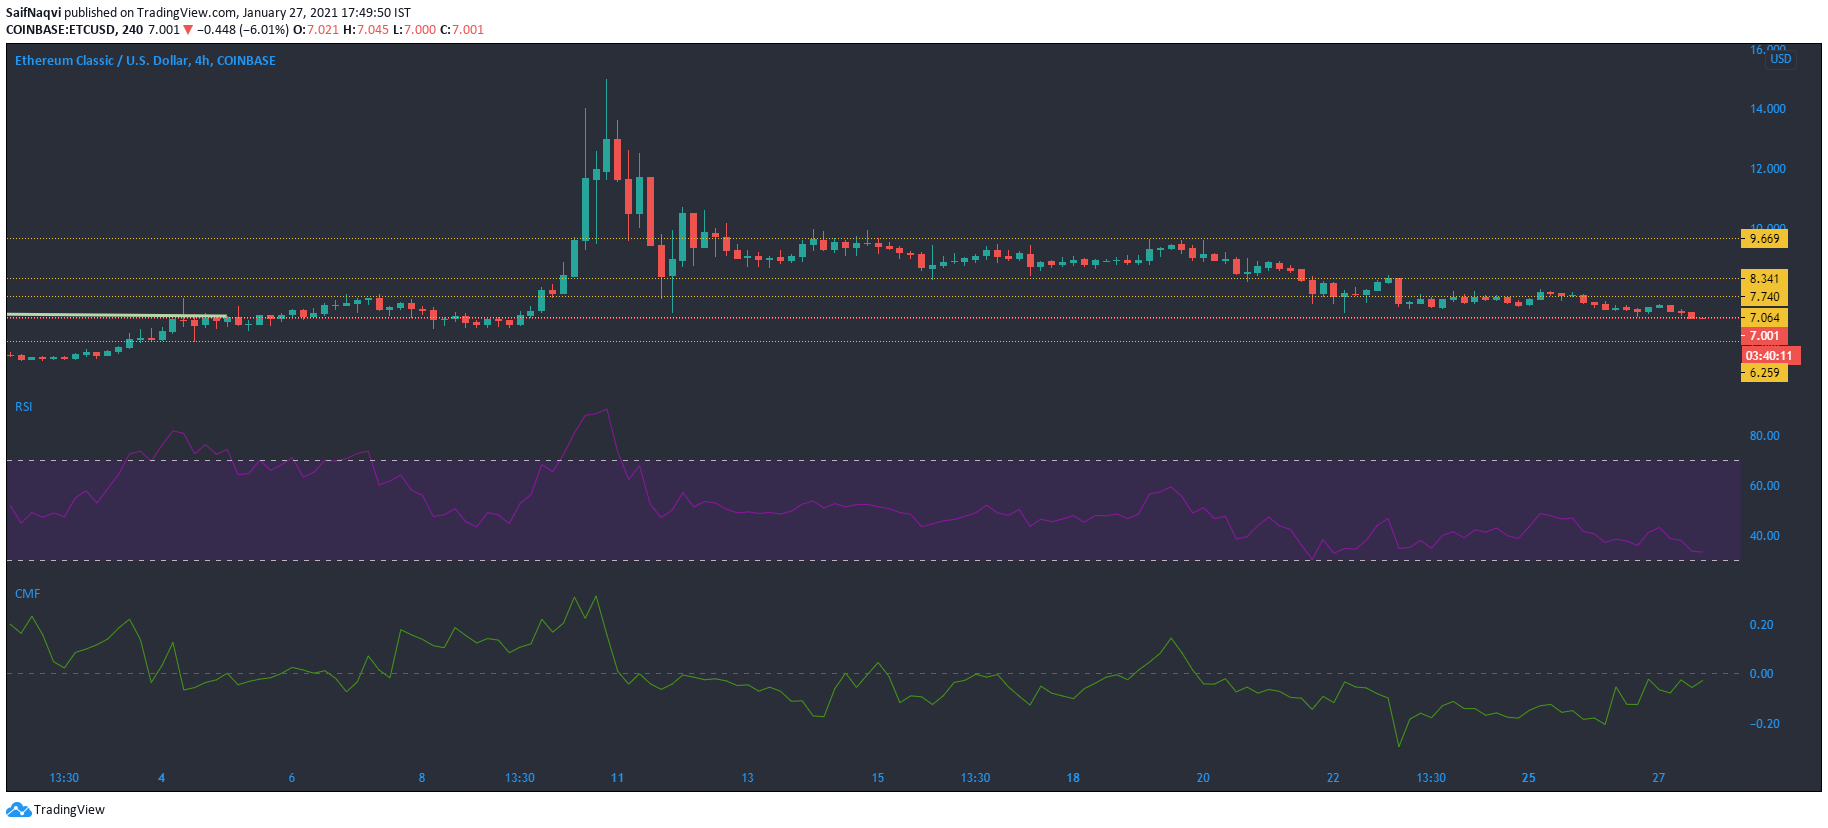
Ethereum Classic moved rangebound between $7.74 and $7.06 as a lack of strong momentum prevented a breakout in either direction. Low trading volumes and limited buying activity also accentuated the crypto’s recent price action. An extended bearish scenario could see the price fall below its immediate support level and move towards the $6.2-support. On the other hand, a bullish outcome would see the price rise towards the $8.3-resistance level.
The Relative Strength Index stabilized just above the oversold zone and outlined the bearish nature of the crypto’s price.
The Chaikin Money Flow suggested that capital inflows into the market were beginning to recover on the charts.
Maker [MKR]

Maker was trading within a channel of $1,490.60 and $1,325.90, at press time, continuing its trend over the past five days. While it looked like the bears were about to flip the press time support, some bullish activity was recorded in the last trading session. However, a further pullback in the broader market could see the price head lower towards $1,153.4, while a bullish scenario could see a rise towards the immediate resistance.
The Bollinger Bands suggested low volatility in the price as the bands were compressed.
Finally, the Awesome Oscillator was bearish-neutral, but the momentum was weak.