
With the cumulative market cap falling by nearly 2% over the last 24 hours, most cryptos were mostly in the red on 22 October. Some altcoins, in fact, showed signs of correction too.
Polkadot and Monero, for instance, projected superior buying pressure, while Ethereum Classic exhibited signs of decreasing bullish power.
Polkadot [DOT]
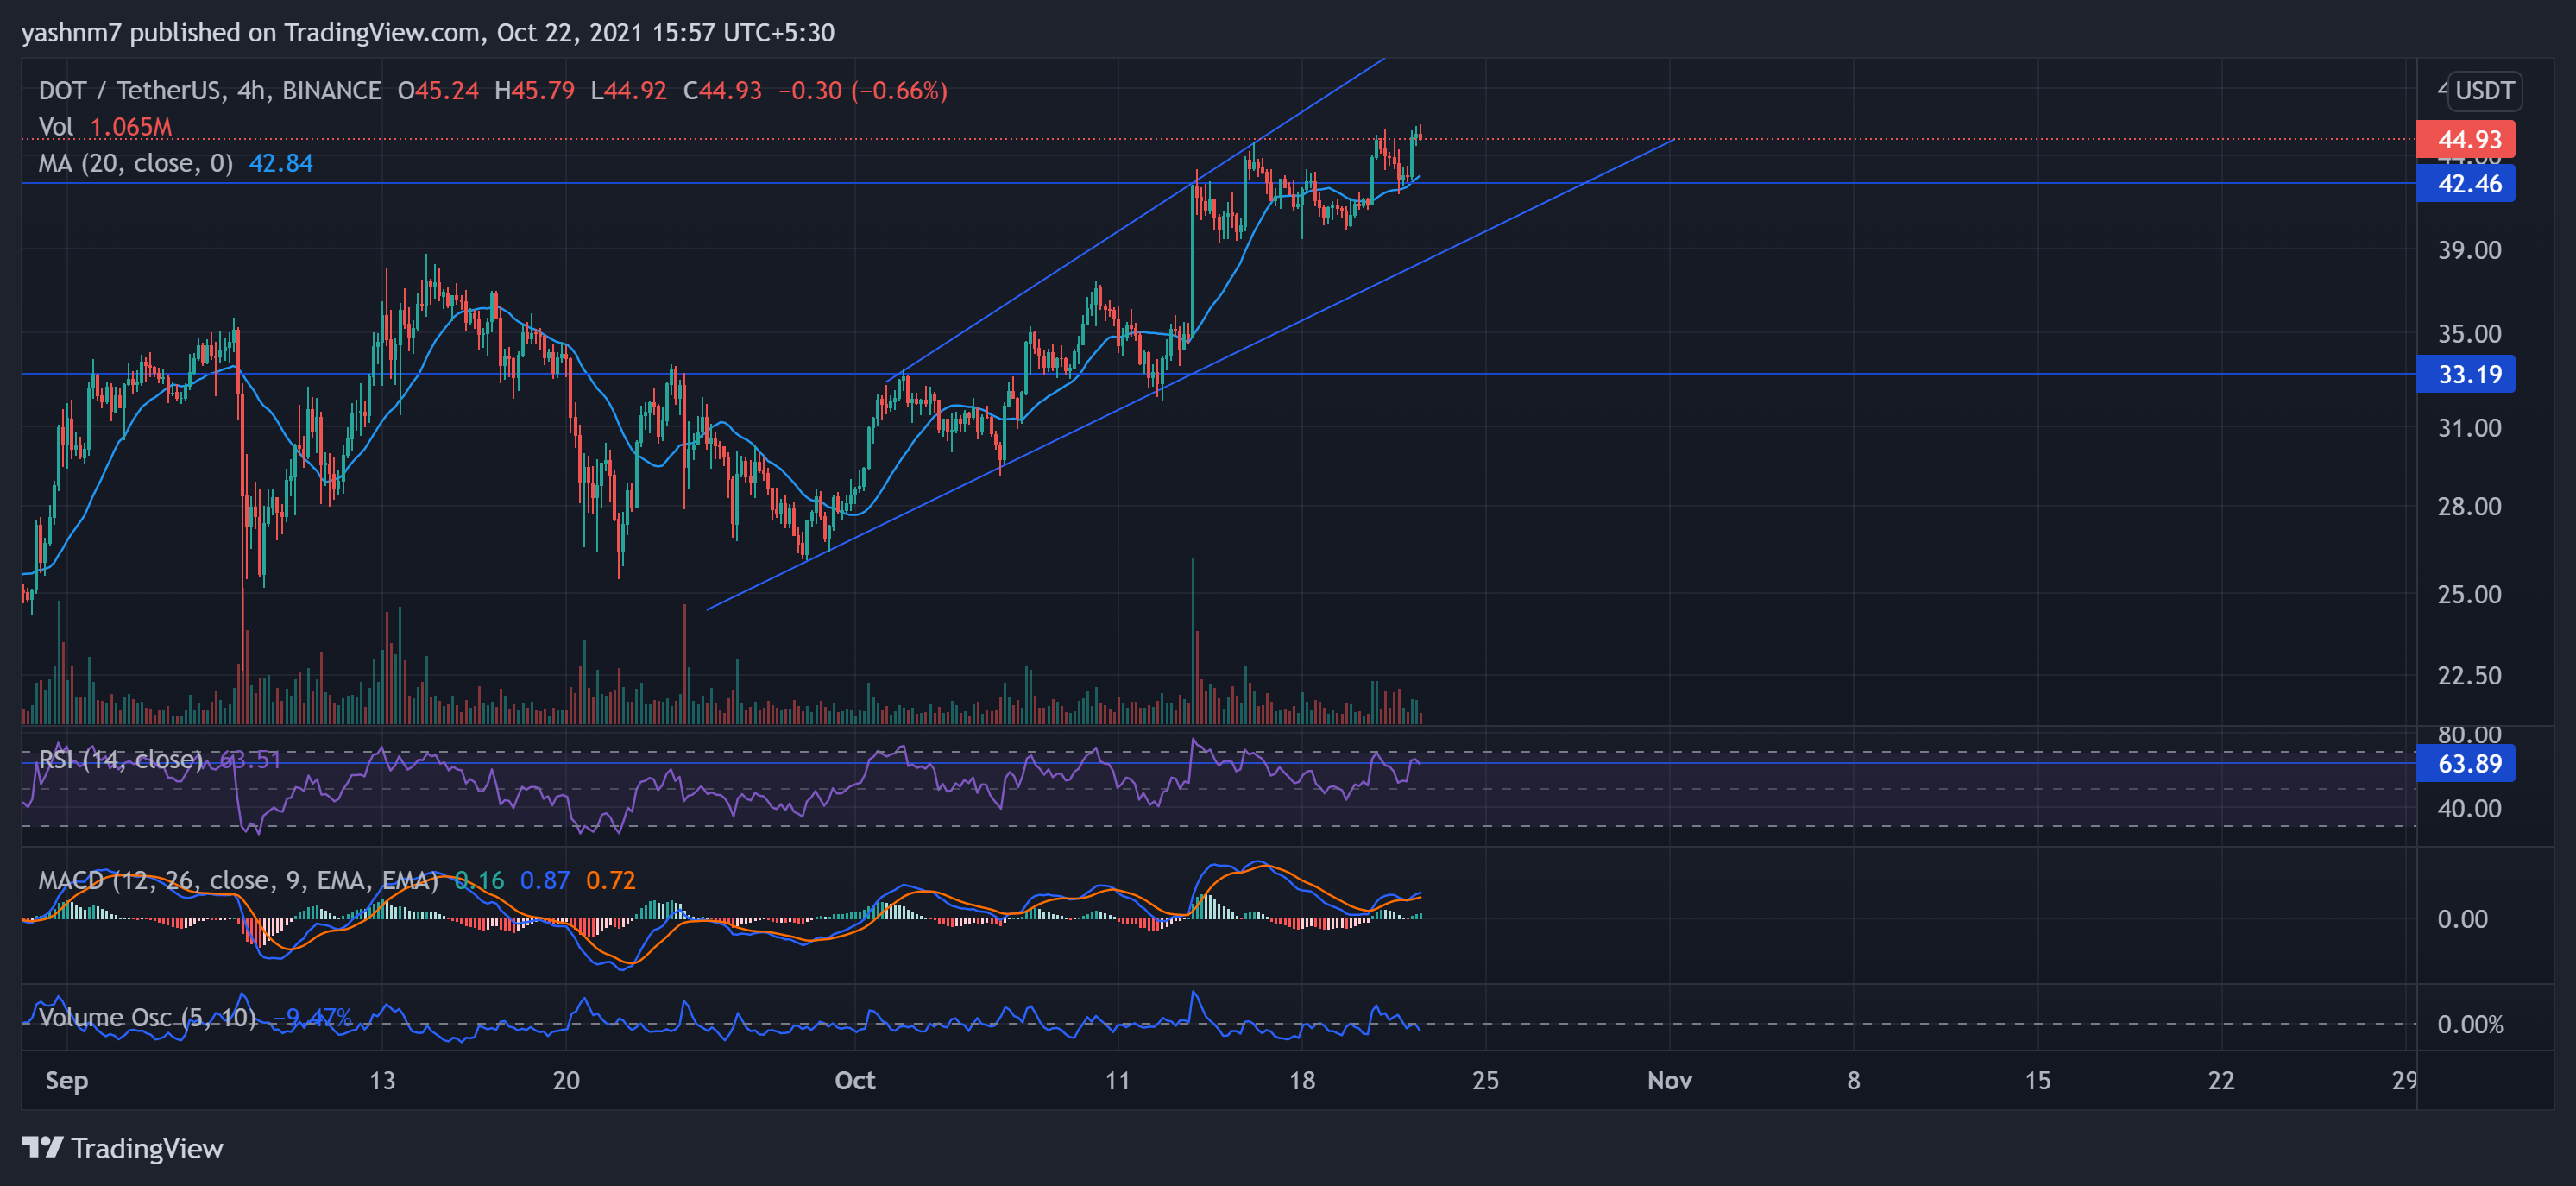
Source: TradingView, DOT/USDT
DOT moved up by 1.76% and was trading at $44.93, at the time of writing. It also noted a 13.56% seven-day increase, indicating an overall uptrend in its price trajectory. Bullish trendlines confirm the uptrend and showed how DOT bulls were keen on sustaining their momentum after breaching the previous support level at $33.19.
This momentum led to a strong support level around $42-level.
The Relative Strength Index (RSI) was at the 63.89-mark, picturing an inclination for the bulls.
The MACD was above the Signal Line, while the MACD histogram flashed green signal bars hinting at bullish tendencies. However, the Volume oscillator and histogram saw a sharp decline in trading volumes. This reading signaled a possible reversal in the near term.
Ethereum Classic [ETC]
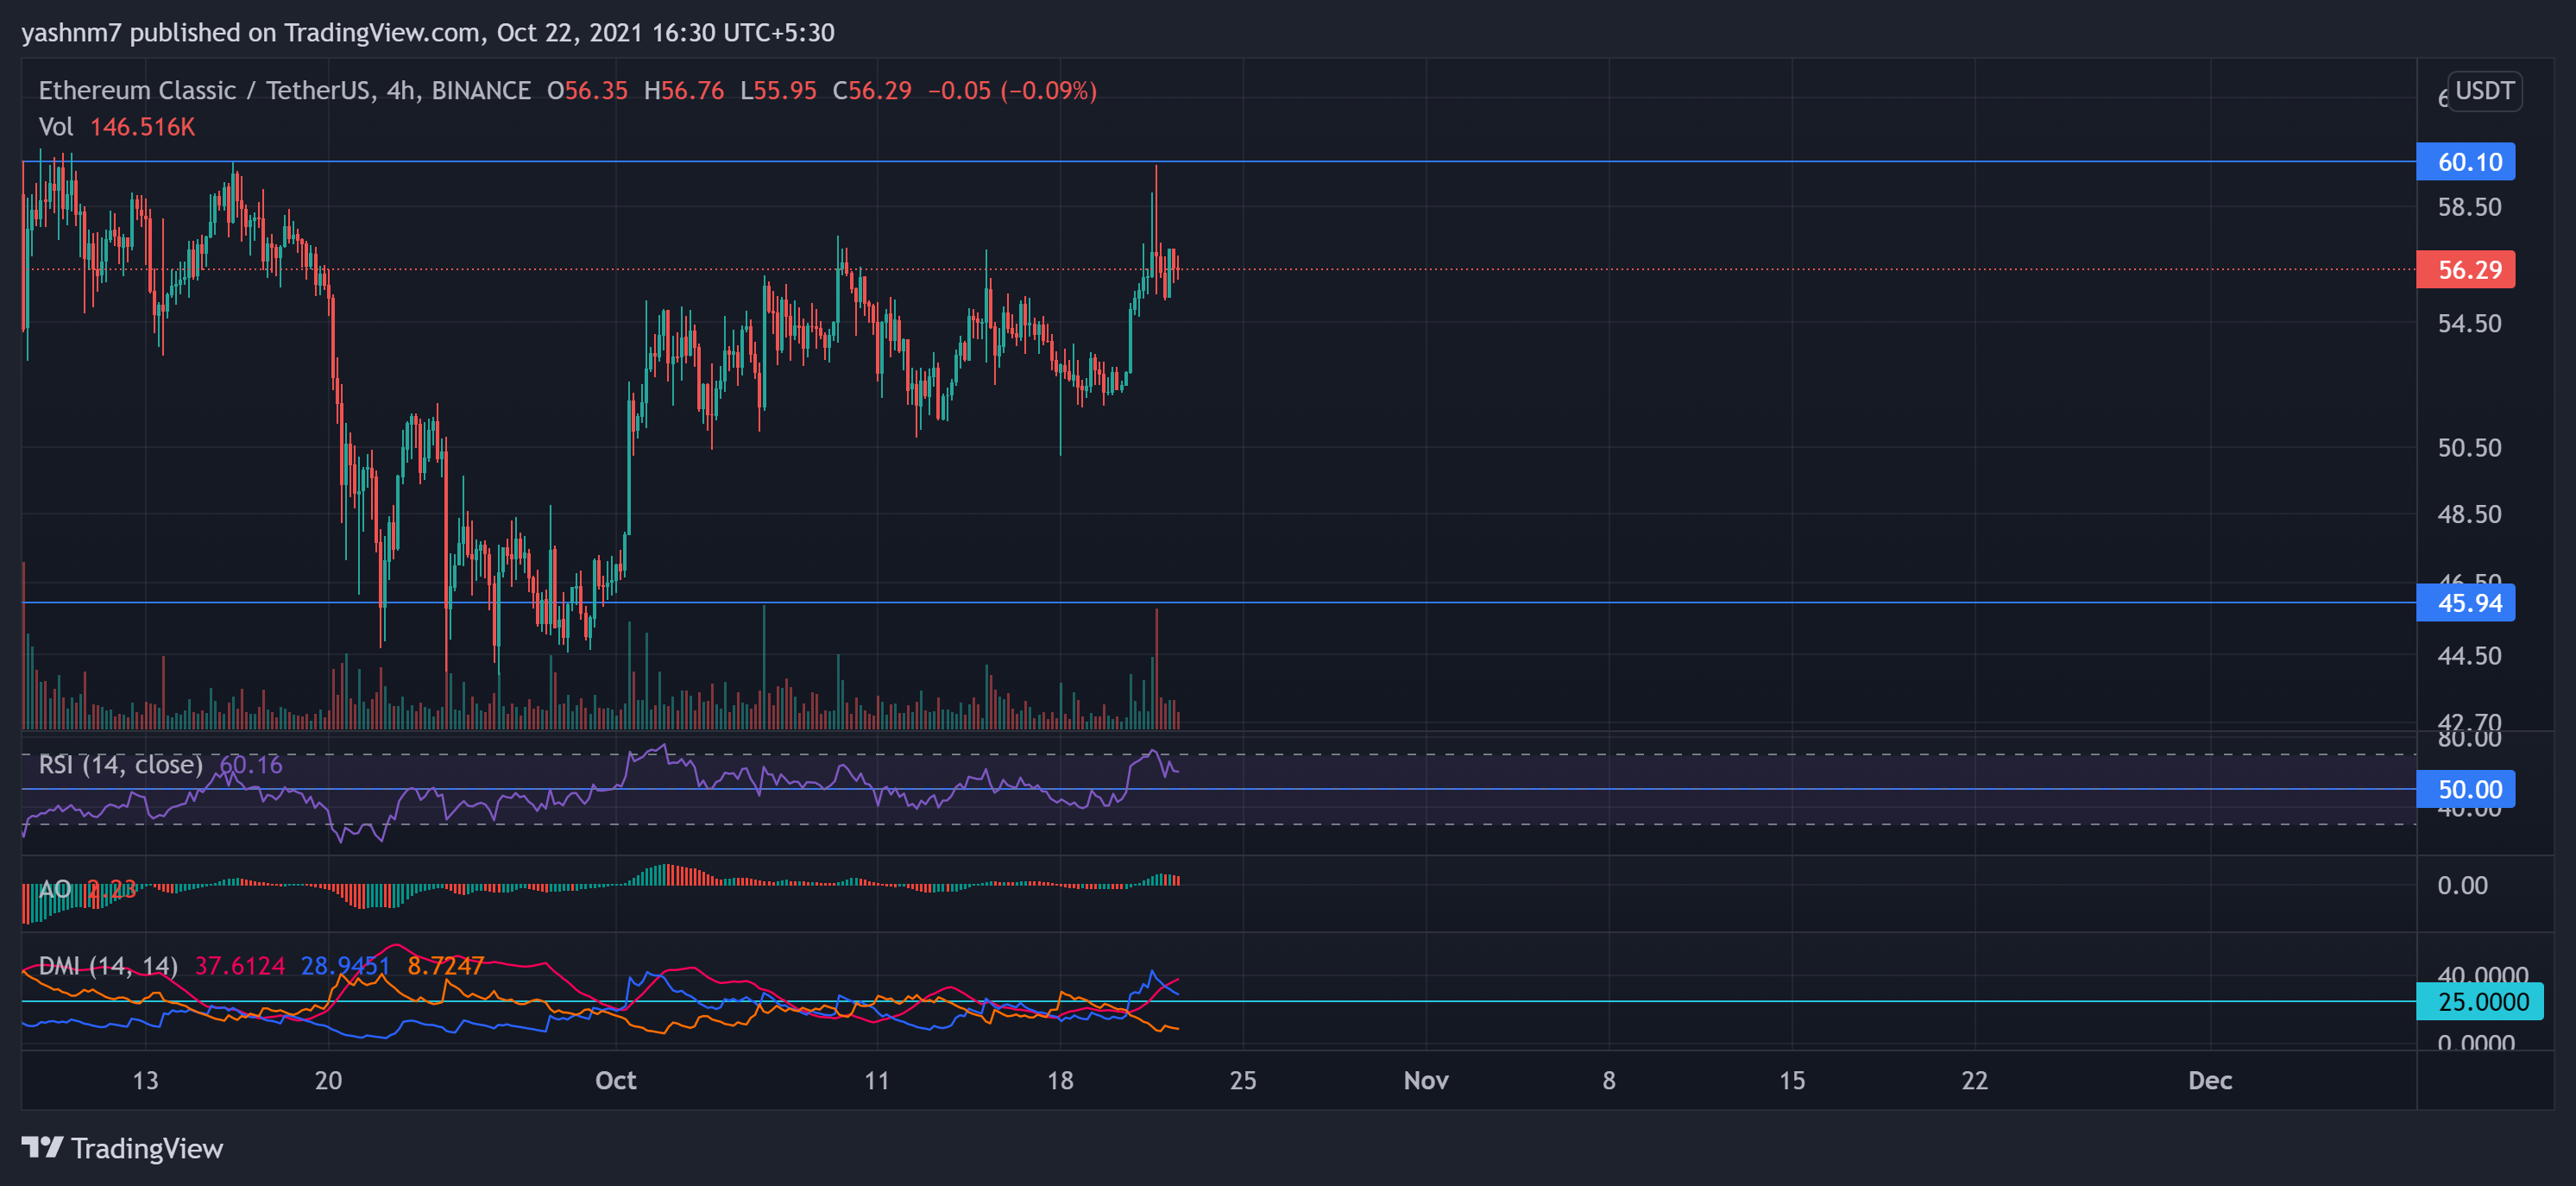
Source: TradingView, ETC/USDT
After barely poking its resistance point that stood at the $60-mark, ETC fell by nearly 2.58% over the last day and traded at $56.29. The support level was registered at $45.94. Key technicals directed at a possible correction in prices.
The RSI saw a dip of 11 points from the overbought territory to the 60.16-mark over the last day, indicating the decreasing power of the ETC bulls. The Awesome Oscillator flashed red signal bars, hinting towards a possible advantage for the bears. The +DI line seemed to plunge towards the south and confirmed the previous readings that suggested a bearish trend.
The Average Directional Index displayed a strong directional price trend as it stood at the 37.6-mark. Analysis of the above indicators and the decreasing volume trends bring forth the possibility of a further correction in prices.
Monero (XMR)
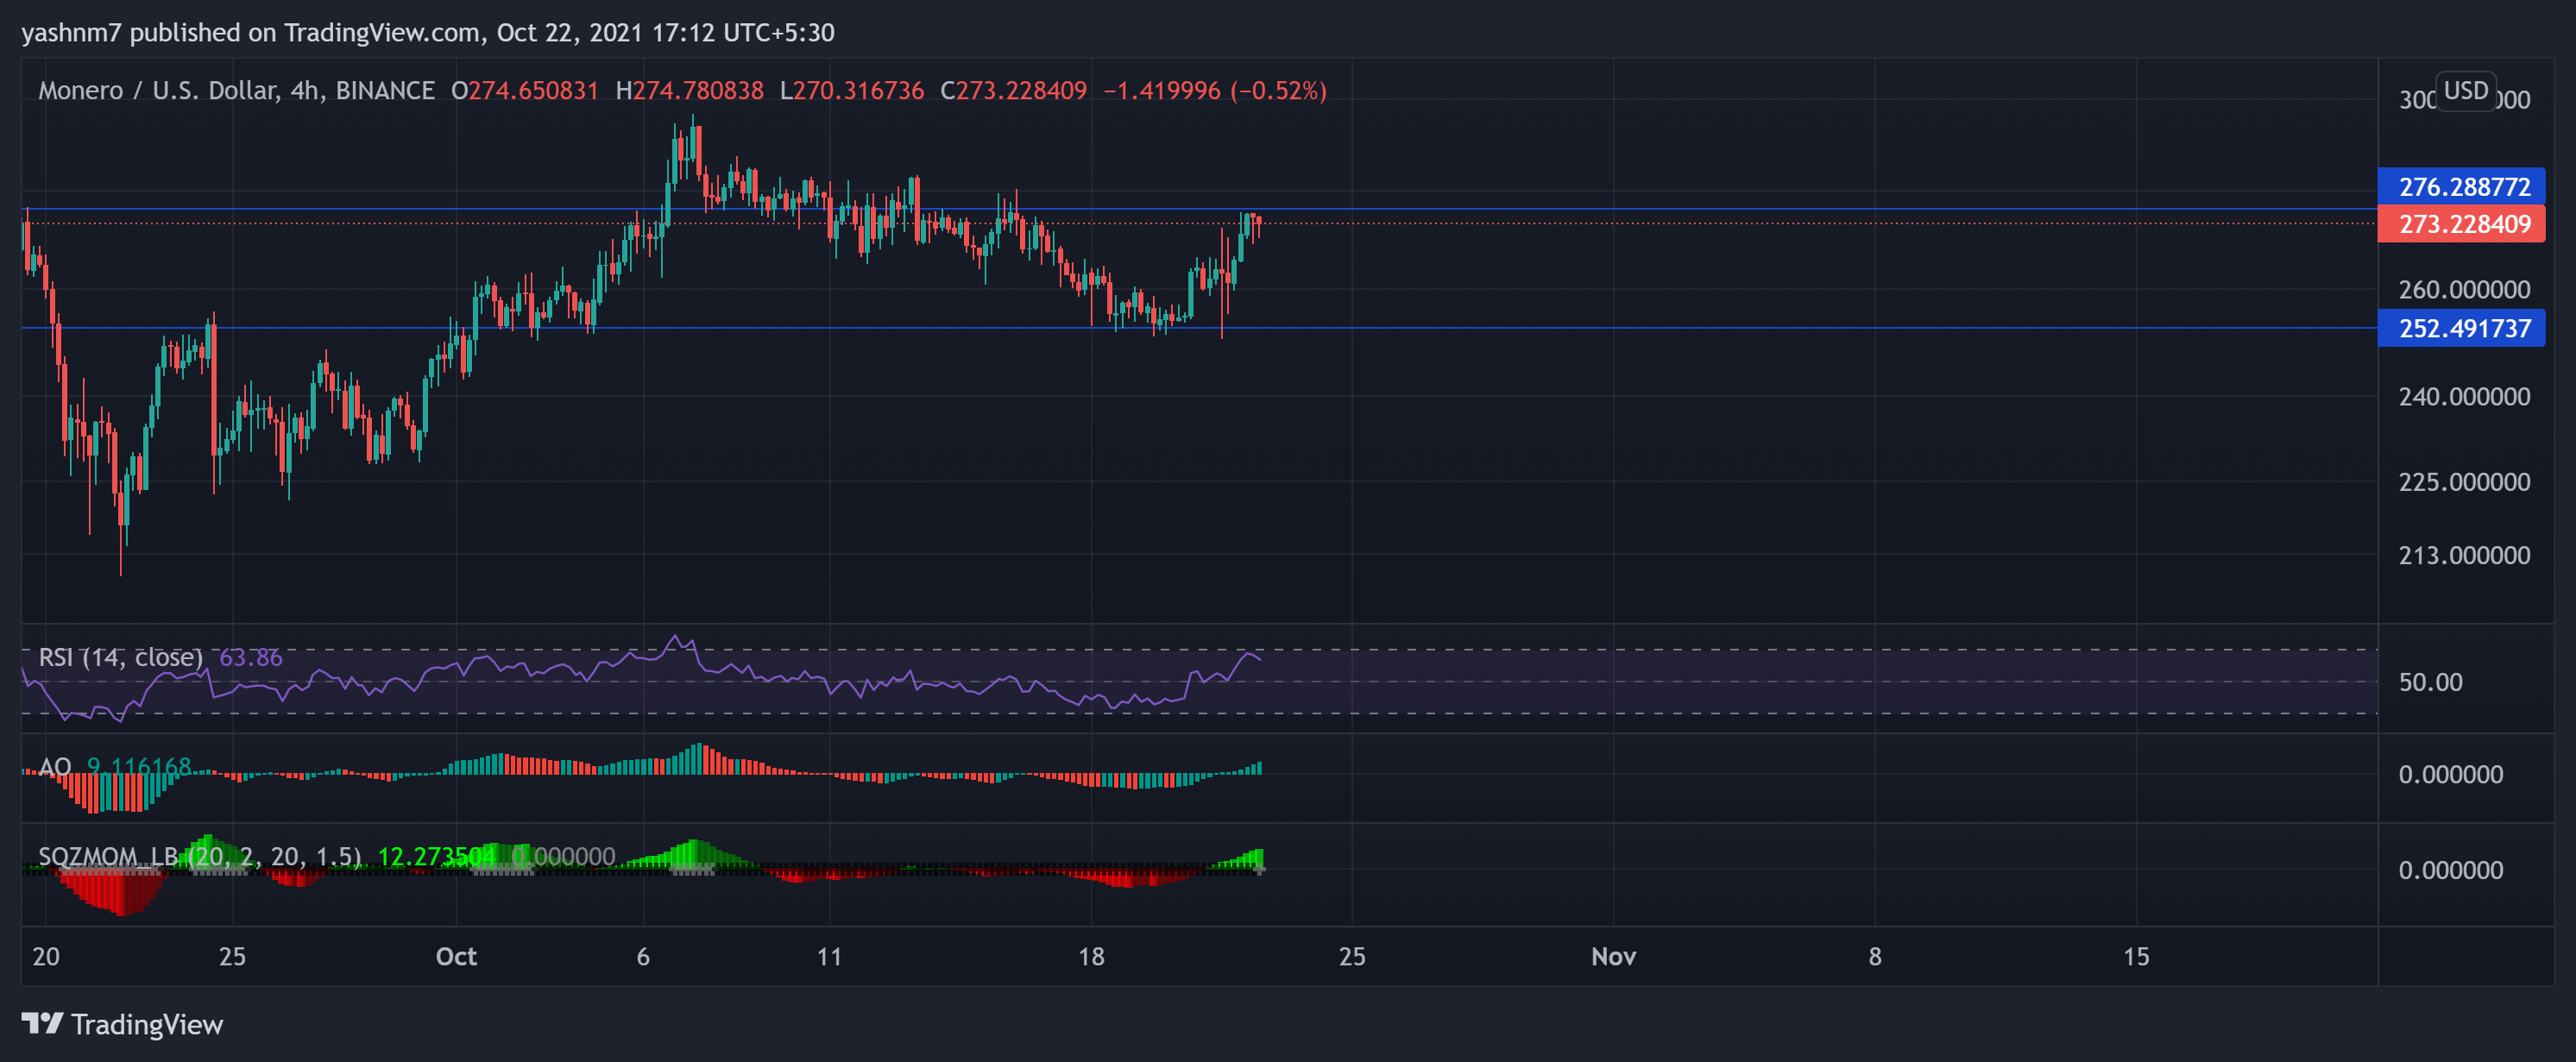
Source: TradingView, XMR/USD
XMR hiked by 3.02% over the last 24 hours and was trading at $273.23, just below its resistance point that stood at $276.29. The altcoin displayed momentum in favor of the buyers.
The RSI was above the half-line and stood at the 63.86-mark, suggesting that the buying pressure exceeded the selling strength.
The Awesome Oscillator flashed green signal bars, hinting at a bullish trend. The Squeeze Momentum Indicator started to display grey dots, suggesting the end of a squeeze period and the possibility of high volatility in the near term.