Polkadot, Fantom, SAND Price Analysis: 20 January

It may still be early to assert a solid trend reversal while the market grappled to cross the $2.15T-mark. Meanwhile, the near-term technicals of Polkadot, Fantom and SAND continued to flash a slight bearish edge while depicting their decreasing influence.
Polkadot (DOT)
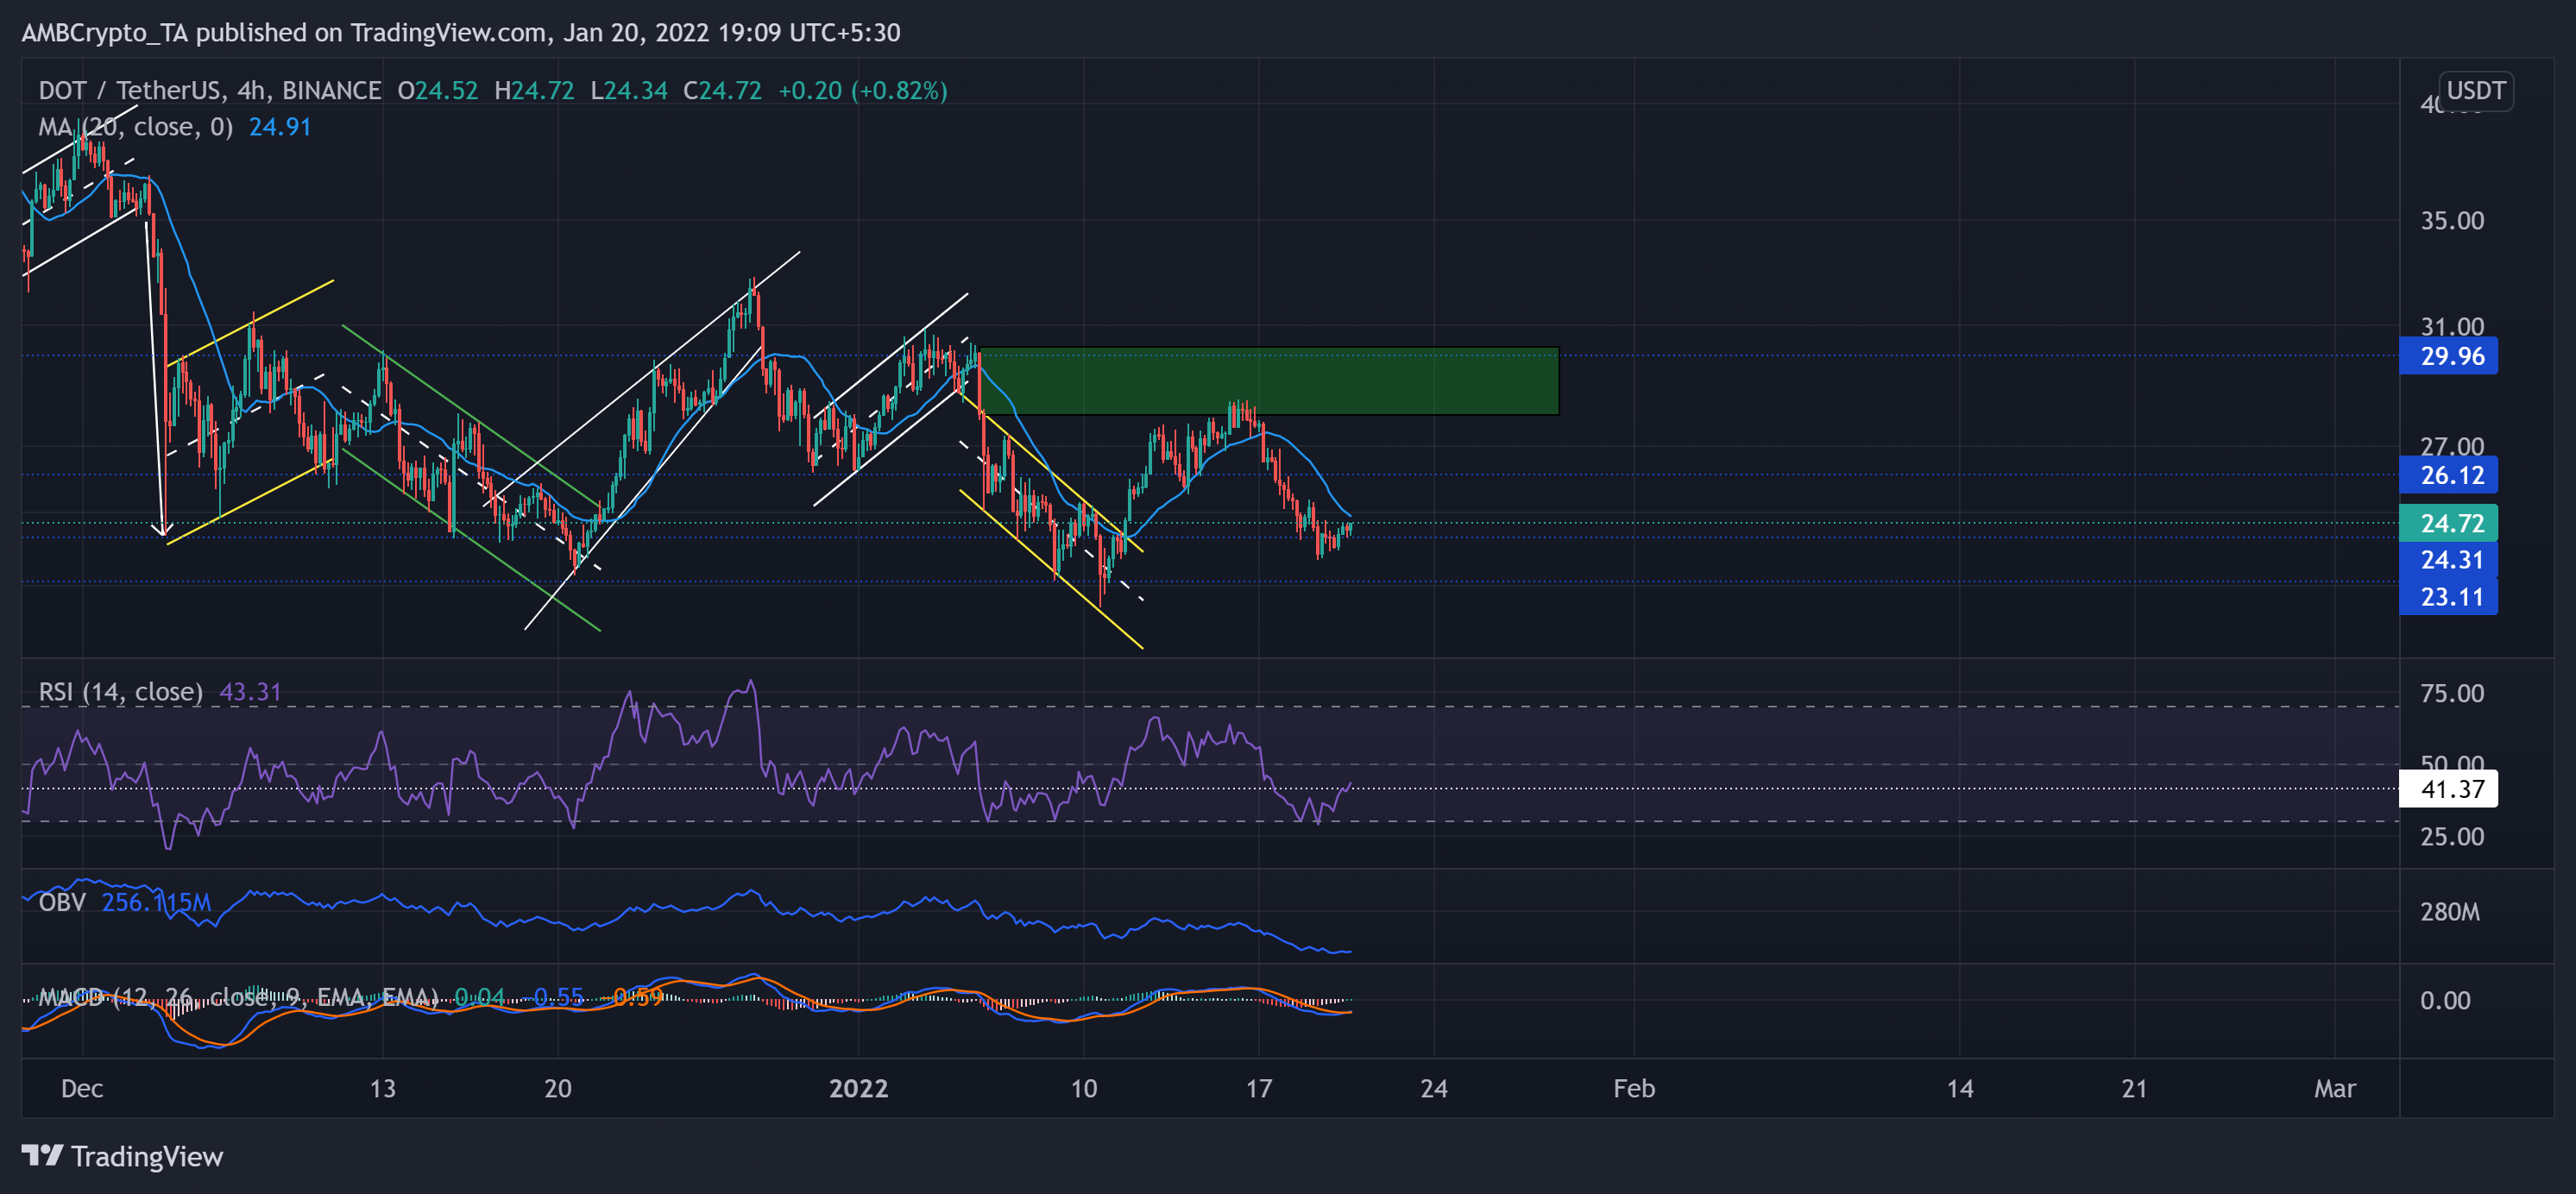
Since the past seven weeks, the sellers have stepped in at the $29.9-mark and ensured a pullback. Moreover, the 5 January sell-off fueled its bearish tendencies as the alt saw an up-channel breakdown.
DOT saw a likely upturn after the price tested the $23.11-mark five-month support again on 11 January. As a result, the alt saw a 27.06% ROI (from 10 January low) before reversing from the immediate supply zone. Now, the 20 SMA (cyan) stood as an immediate hurdle for the bulls.
At press time, DOT traded at $24.72. The RSI stood at the 43-mark. After testing the oversold region twice in the last two days, it revived but still needed to sustain above the 41-mark. Further, the OBV was on a persistent decline and confirmed the bearish vigor. Also, the MACD confirmed the previous analysis, but its histogram and lines pointed at decreasing selling pressure.
Fantom (FTM)
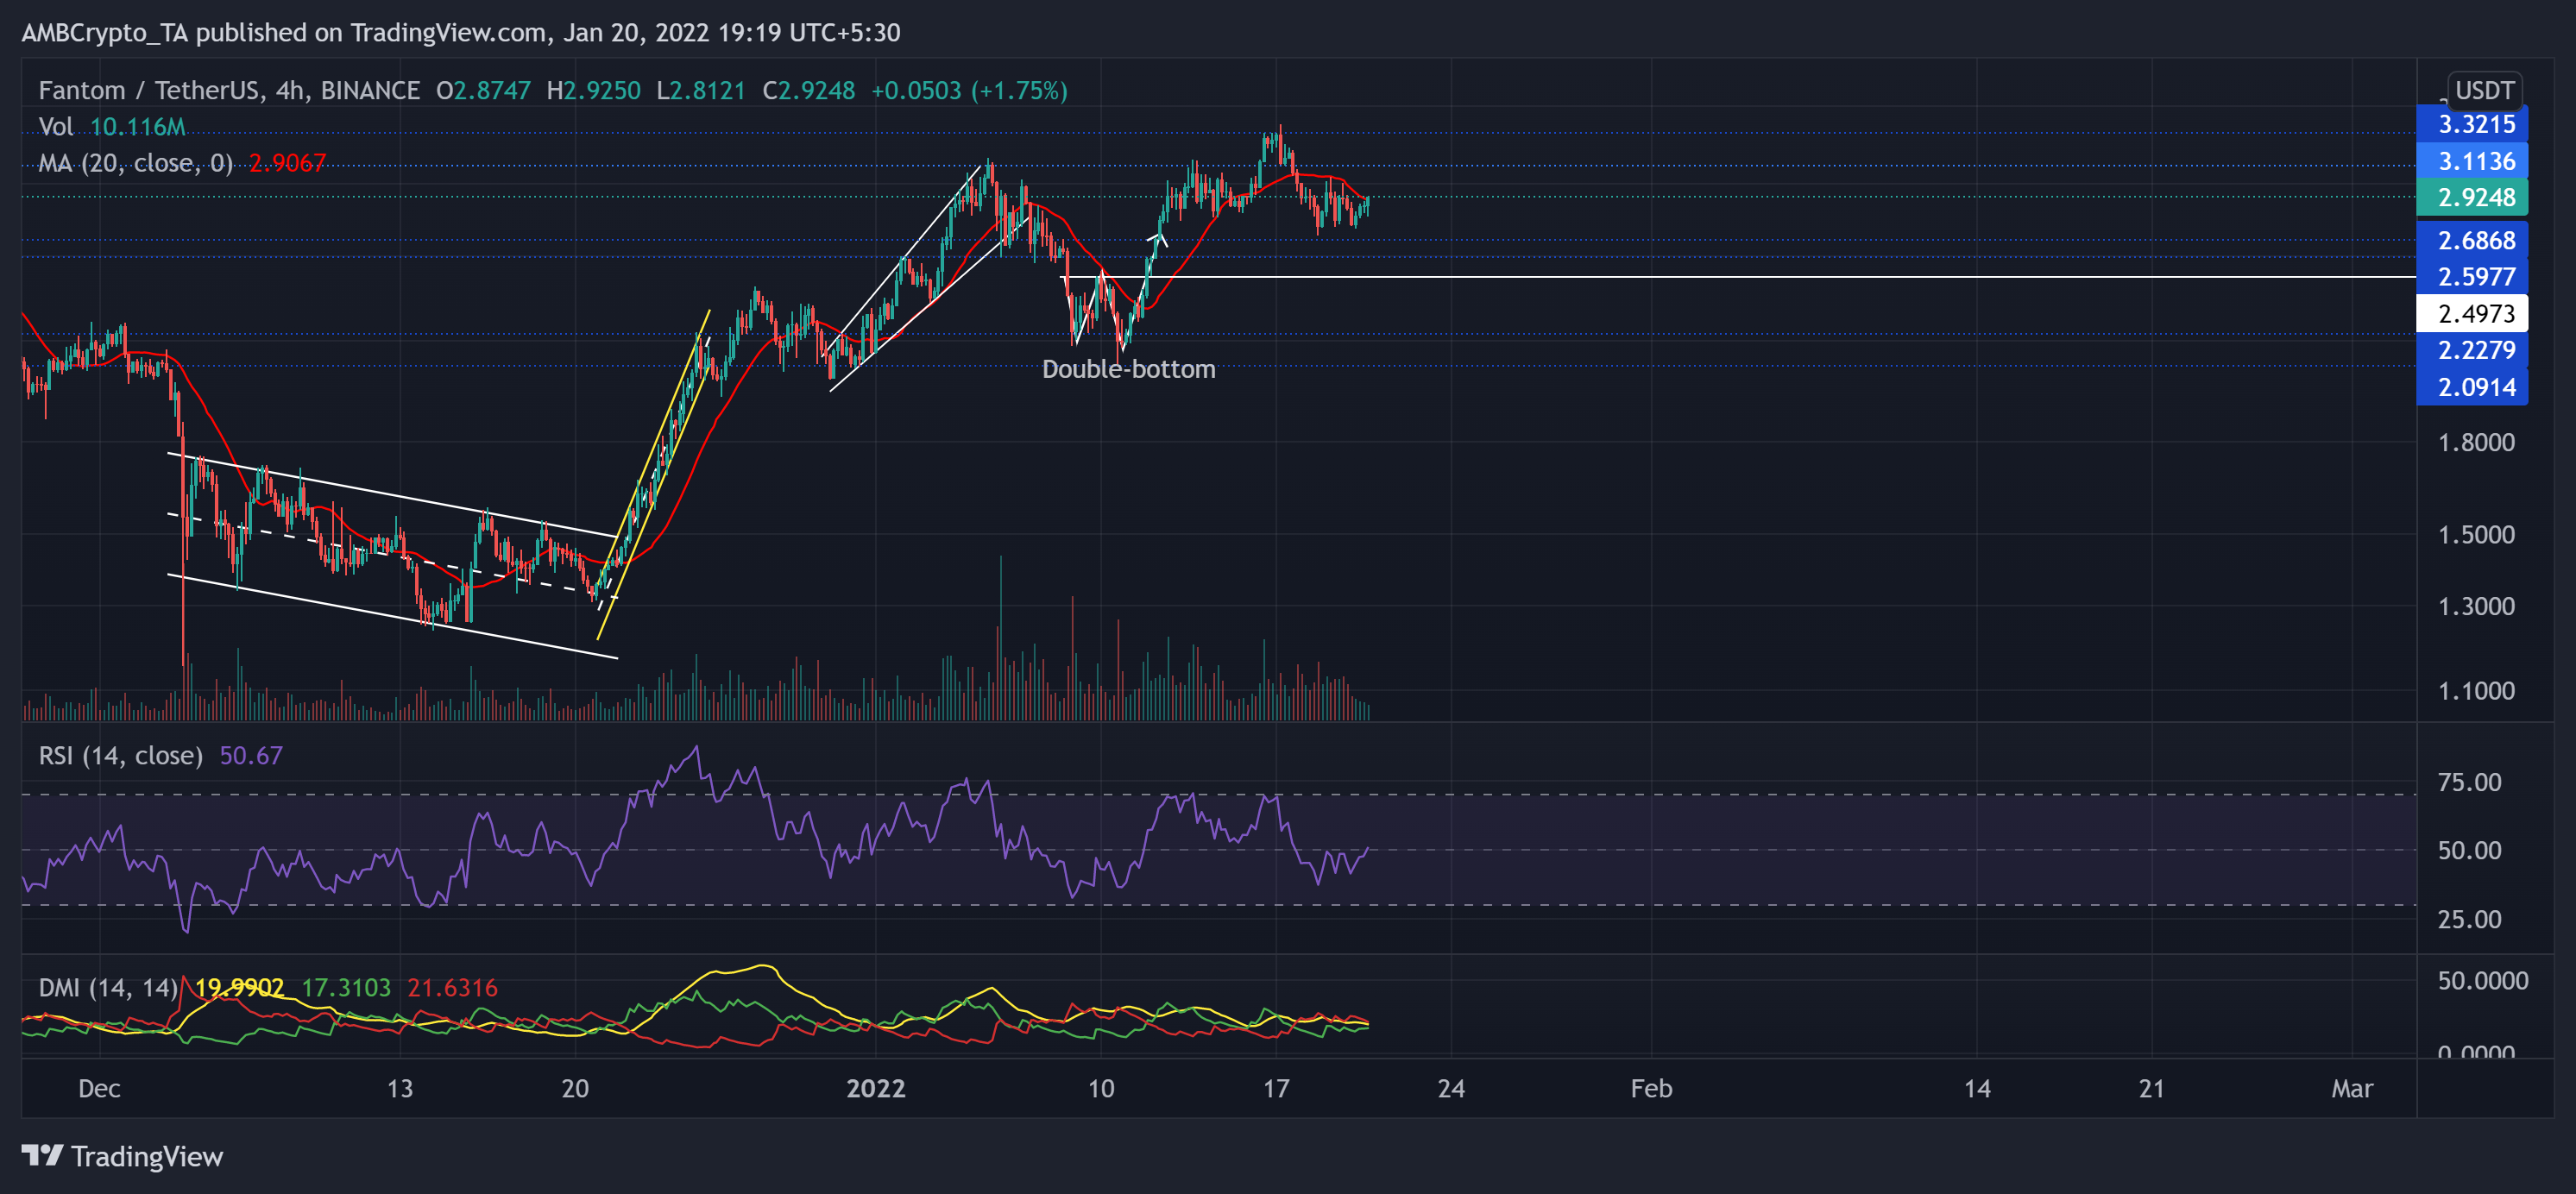
After breaking out of its ascending broadening wedge, FTM lost over a third of its value and tested the $2.22-mark.
From here on, it saw an exceptional rally after forming a double-bottom on its 4-hour chart. FTM gained a staggering 59.7% ROI from the 10 January low until it poked its 11-week high on 17 January. The 20-SMA (red) stood as strong support during the ascent. Now, it stood as an immediate resistance to topple.
At press time, FTM traded at $2.9248. The RSI tested the overbought region twice before a fall toward the 37-level. It flashed a decent recovery but still needed a sustained close above the half-line. The DMI skewed in favor of sellers. But the ADX (directional trend) still remained weak.
The Sandbox (SAND)
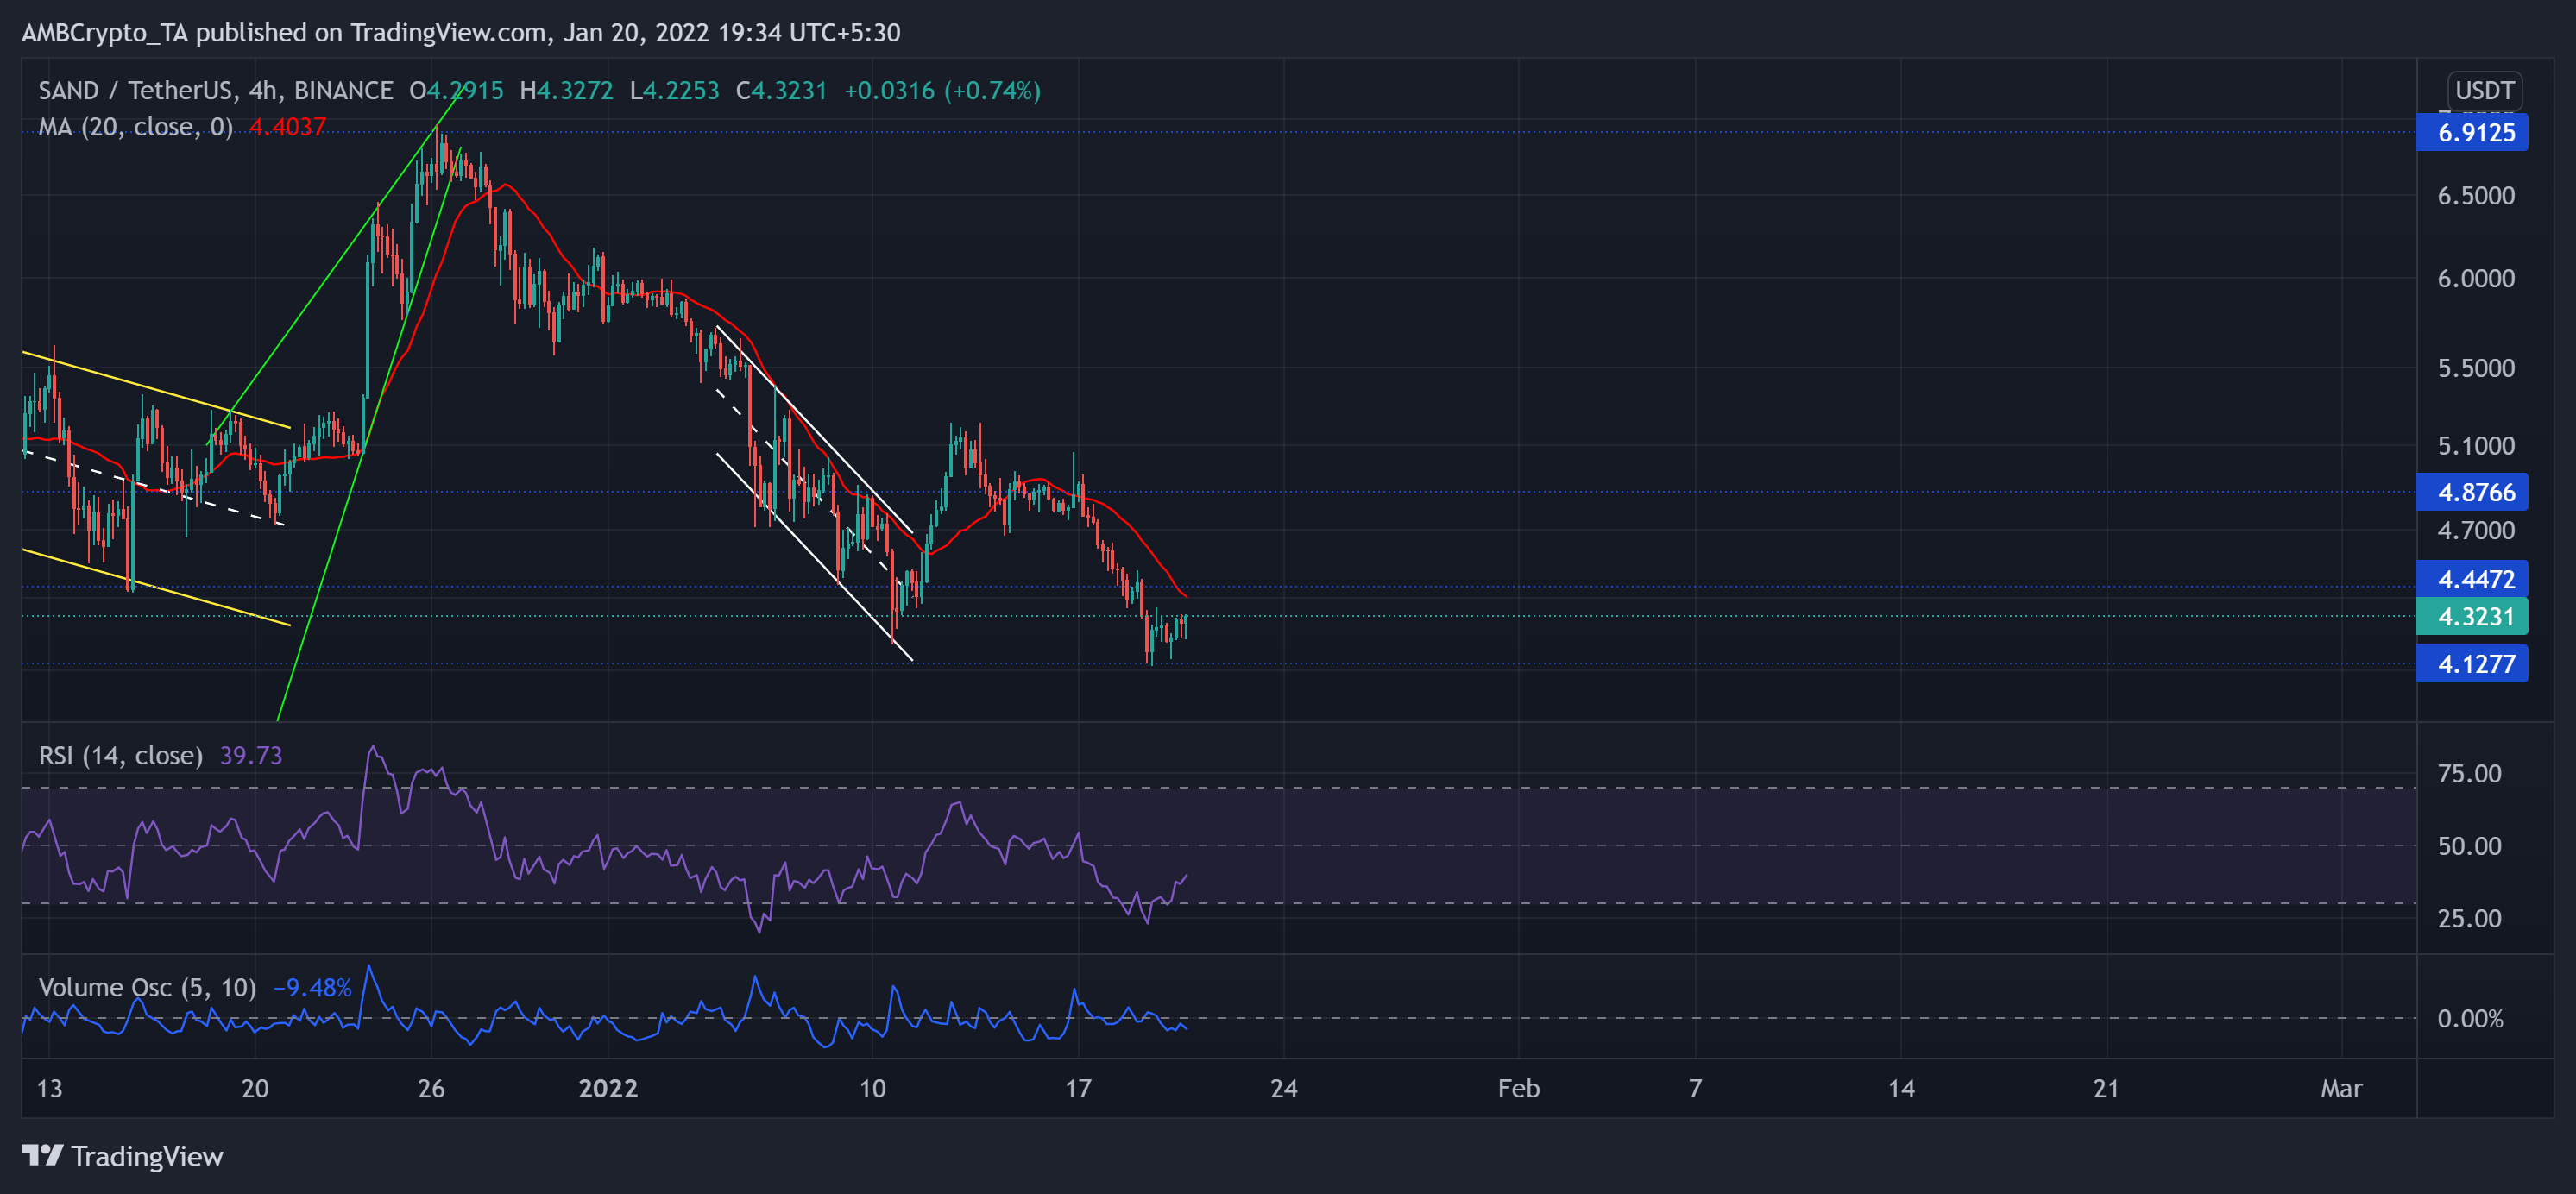
SAND bulls could not defend the $4.44-mark as support after the alt saw an expected rising wedge (green) breakout on its 4-hour chart. It saw a 40.73% retracement (from 26 December high) until it poked its two-month low on 19 January.
Now, as the alt endeavored to recover, the 20-SMA (red) stood as a strong resistance.
At press time, the alt traded at $4.3231. The RSI was at the 39-mark and eyed to test the equilibrium. It displayed a bearish bias at the time of writing. Also, the recent candlesticks marked lower peaks on the Volume Osicalltor, indicating a weak bull move.