Polkadot: Here’s where bulls can look to re-enter following resistance breach

Disclaimer: The information presented does not constitute financial, investment, trading, or other types of advice and is solely the writer’s opinion
- Polkadot has breached an important area of resistance.
- Although the reaction wasn’t strongly bullish yet, it was likely that DOT would rally toward $7.
Polkadot has performed well on the price charts over the past two weeks. The token has noted gains of 15% measuring from 9 April to 18 April, and more green could follow.
Bitcoin was also quick to recover after a drop to the $29.2k level, which suggested buyers had some strength, but not enough to force another rally.
Read Polkadot’s [DOT] Price Prediction 2023-24
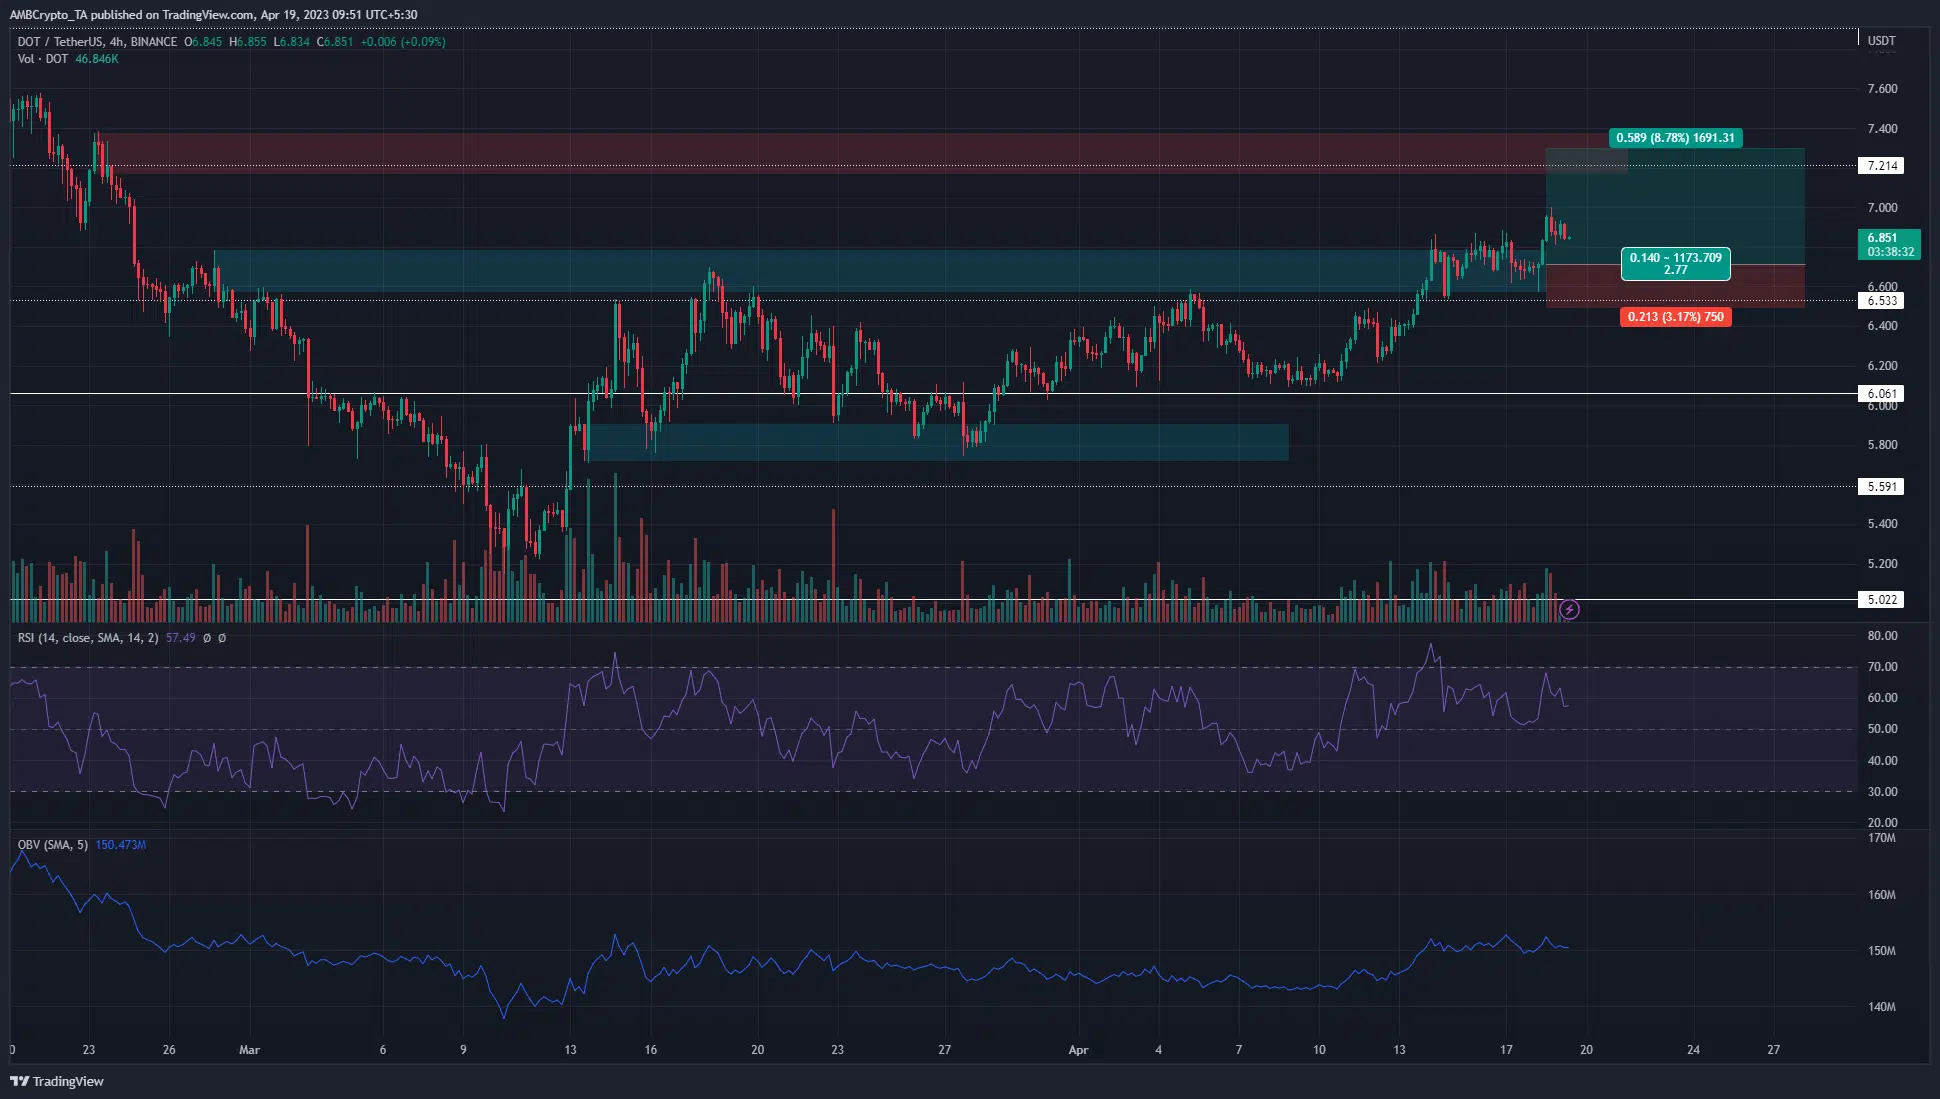
Polkadot bulls managed to drive prices above a bearish order block which acted as a stern resistance since 27 February. This move meant further gains could materialize in the coming days.
The bullish breaker could be retested once more
The bearish order block mentioned previously lay at the $6.6 region, but over the past week, it has been broken. A 4-hour trading session close above the order block flipped it to a bullish breaker, and so far, buyers have defended this area. It was highlighted in cyan, and it was likely to be tested once more.
This was because the most recent lower timeframe pump went from $6.57 to $7 on 18 April. This surge in prices occurred quickly and left behind an imbalance on the charts. If this fair value gap, extending from $6.72 to $6.82, was retested, it would likely give a bullish reaction.
Realistic or not, here’s DOT’s market cap in BTC’s terms
The market structure was bullish and the RSI remained above neutral 50 as well, supporting the idea of upward momentum. The OBV has been flat over the past week, which was not an encouraging finding after the move above $6.6.
Hence, buyers can look to enter a test of the FVG, targeting the next H4 bearish order block at the $7.22 area (red box).
This idea will be invalidated if DOT closes a 4-hour session at $6.56. Such a session close will be discouraging for the bears, who have spent the past two weeks trying to force a move above the resistance. A fall beneath $6.6 will likely see $6 tested as support.
Futures markets showed long positions were discouraged in recent hours

Source: Coinalyze
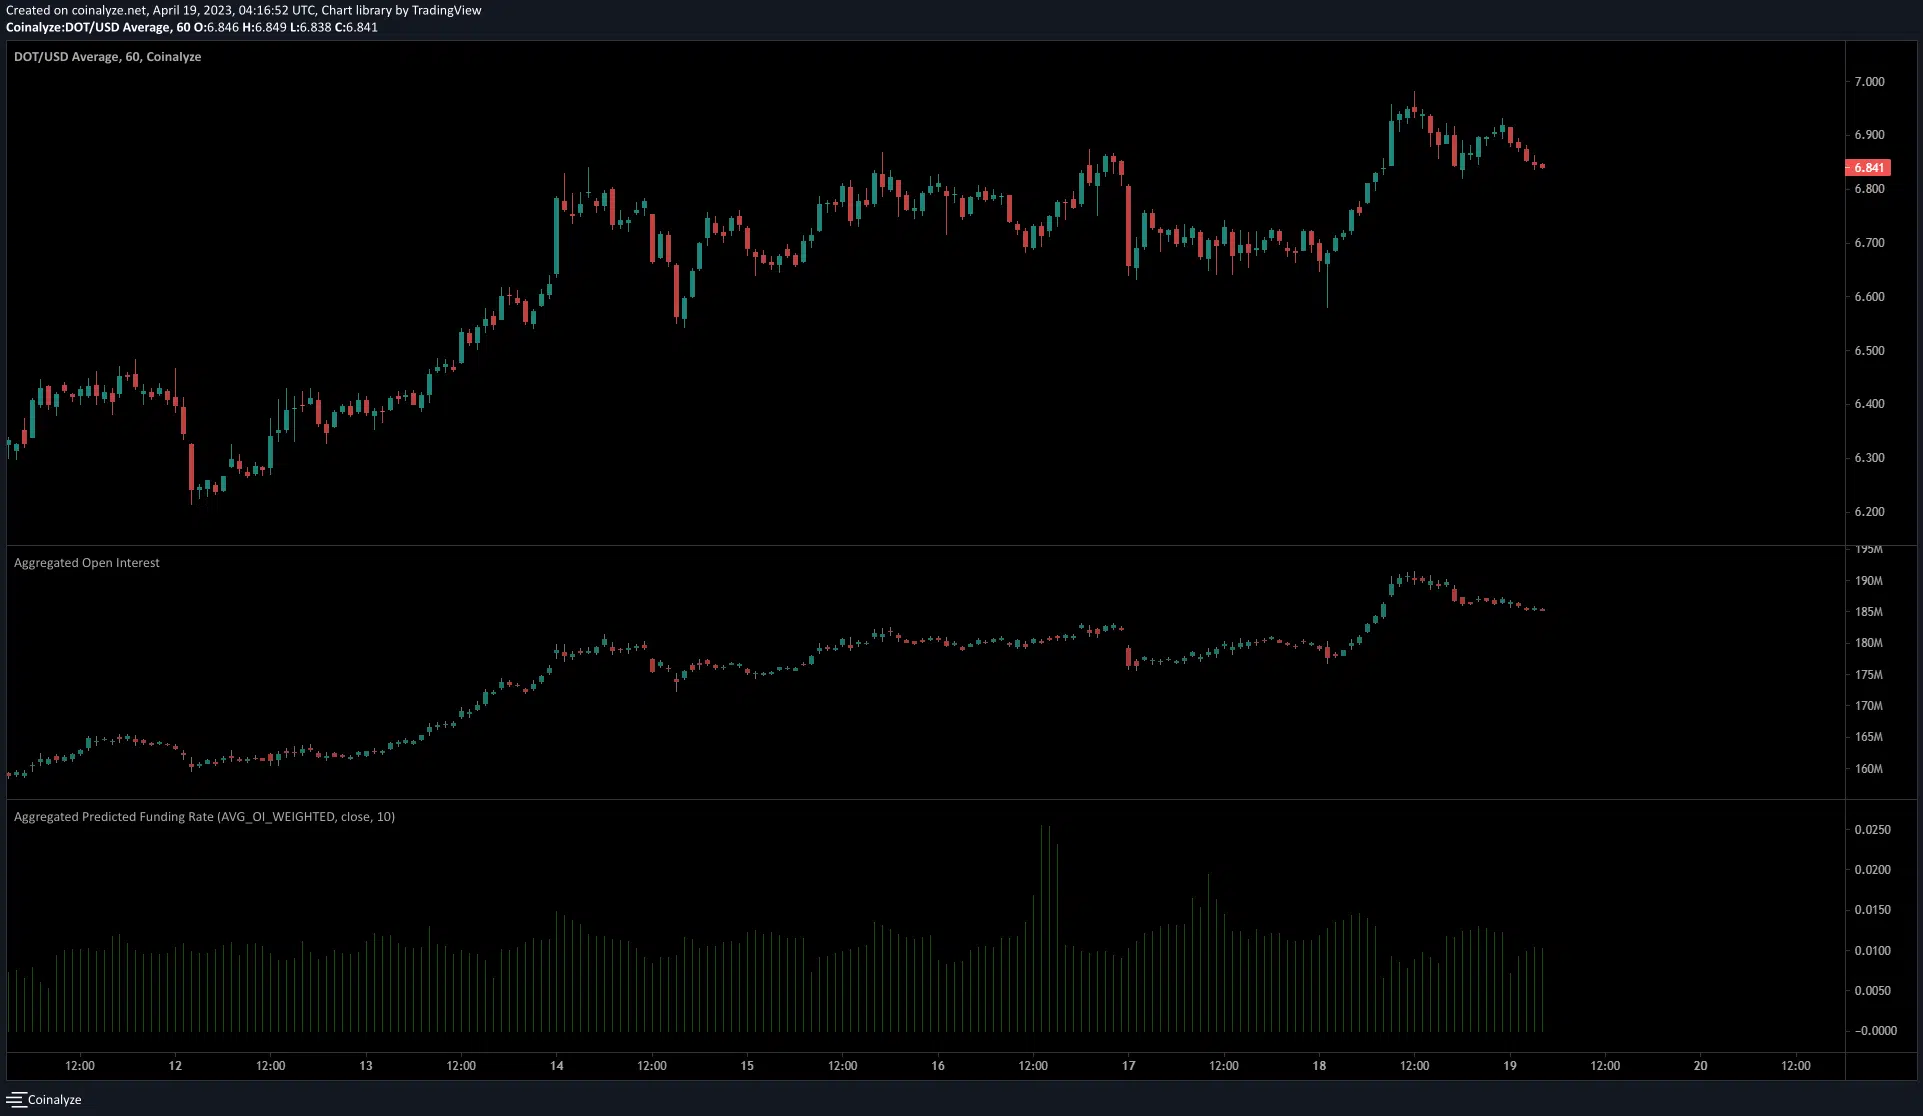
Coinalyze data showed the funding rate was positive, and hadn’t changed much in the past ten days. This highlighted a bullish bias but the Open Interest told a slightly different story.
In the past 24 hours, OI dropped by $7 million after a 2.5% slide in DOT prices. This suggested some bearish sentiment on the lower timeframes. If this continued, or if the OI rose alongside falling prices, it would highlight the heightened bearish sentiment.


