Polkadot: How soon can traders expect DOT to go up in Q4

Polkadot [DOT] has been in the headlines for all the right reasons in the last few weeks. The updates regarding the partnerships and collaborations have played in favor of the blockchain. Thus, inviting investors’ interest.
The latest integration was the launch of the KILT Protocol on the Polkadot Relay Chain. With this new development, KILT Protocol successfully moved from the Kusama Network to Polkadot.
KILT is now running as a @Polkadot parachain!?
After testing and growing for one year on @kusamanetwork, KILT is ready for upcoming enterprise integrations.
KILT is the first parachain to move its entire chain seamlessly from Kusama to Polkadot.https://t.co/QFEmbRfSTF
— KILT Protocol (@Kiltprotocol) October 4, 2022
In this regard, the founder of KILT Protocol, Ingo Rübe, stated,
“It’s always exciting to do things nobody has done before… Polkadot technology made it possible to transfer all achievements from the experimental phase to the production phase. Try that on any other technology base!”
Polkadot on fire?
Interestingly, Polkadot also witnessed a massive surge in its development activity. Furthermore, as reported earlier DOT surpassed every other crypto and was only after Ethereum [ETH], in terms of the developer ecosystem.
On a side note, the LX Factory in Lisbon, Portugal announced that it would be hosting Polkadot’s sub0 2022 on 28 and 29 November.
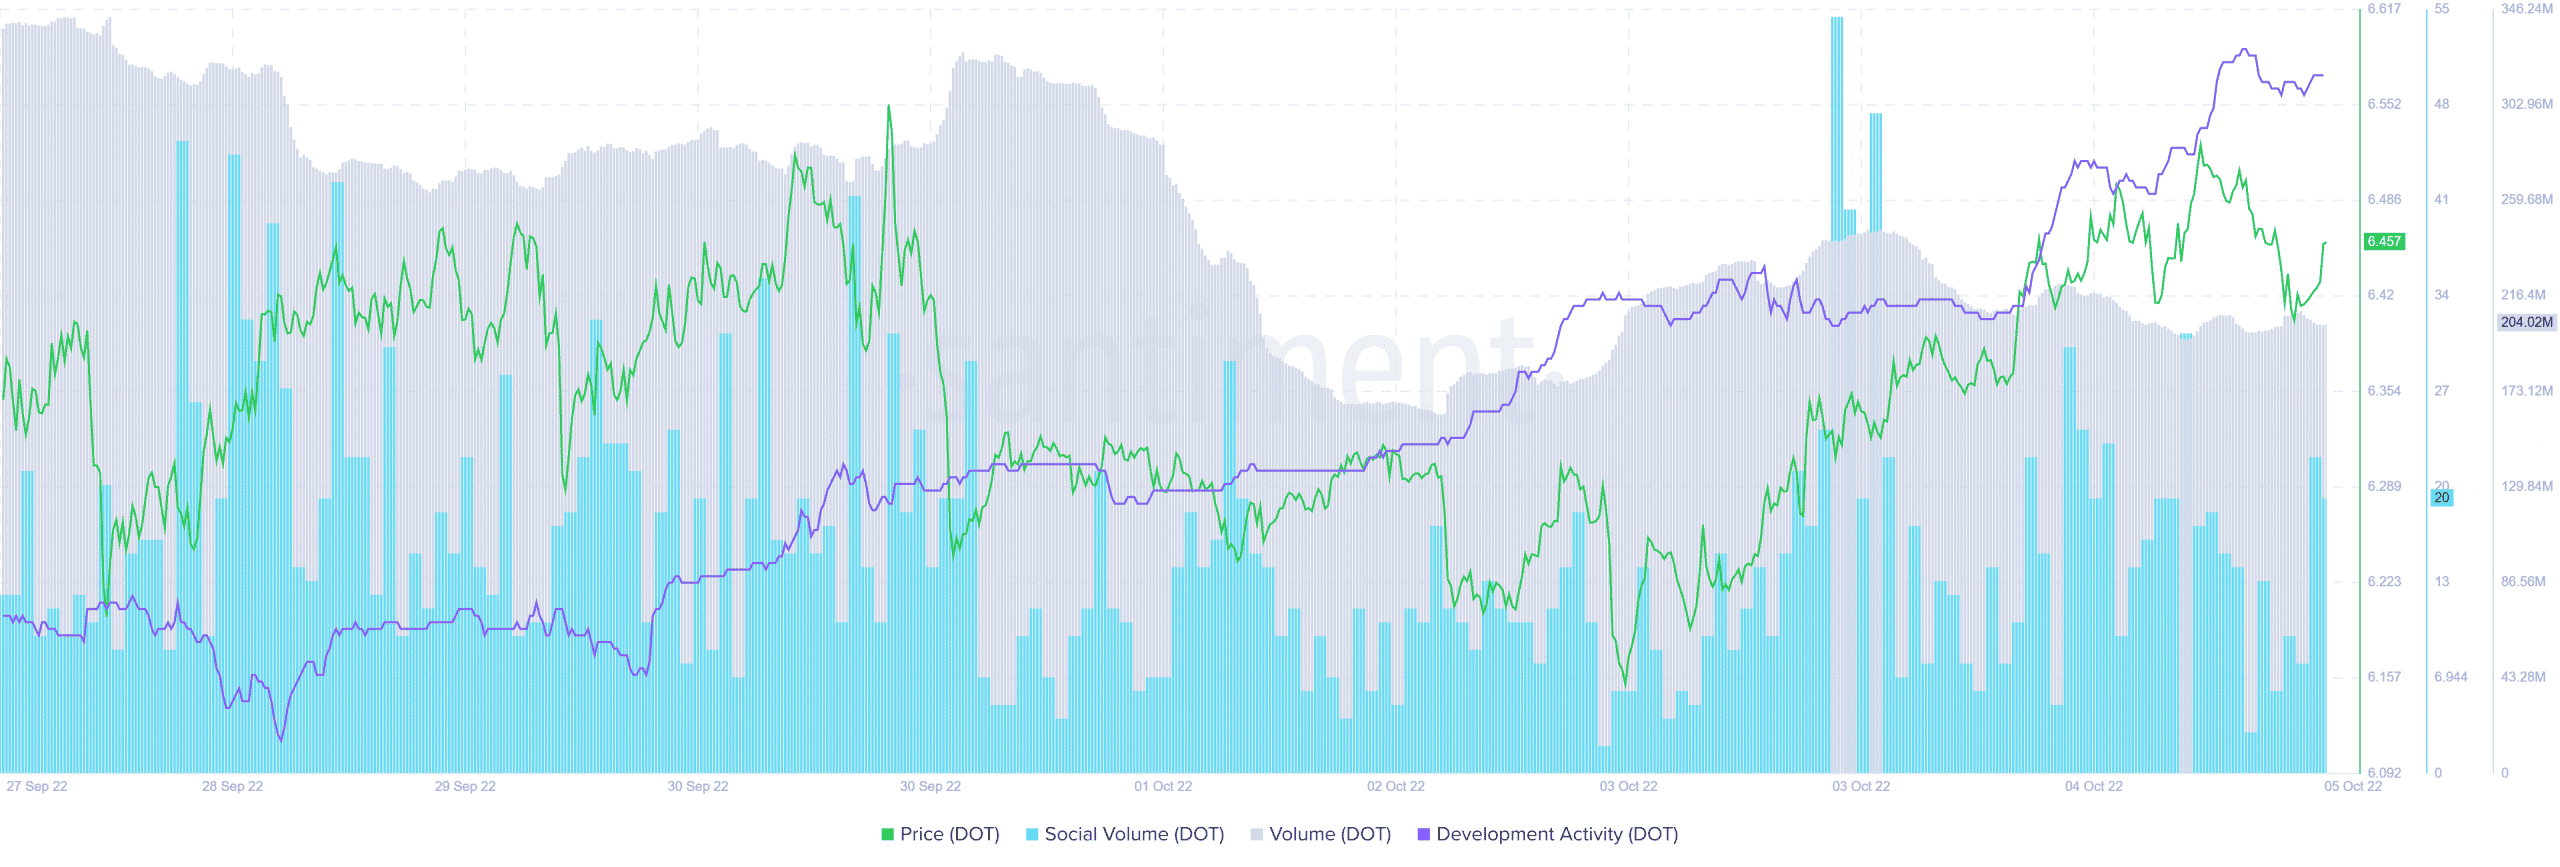
However, despite the nature of developments in the ecosystem, DOT could not register a massive uptick. It was trading only 0.48% higher than 4 October. At press time, DOT was changing hands at $6.46.
A ‘DOT’ted line to walk on
In fact, a look at DOT’s on-chain side indicated that most metrics were in favor of the alt and supported a price hike in the coming days.
For instance, DOT’s social volume spiked on 4 October. Thus, highlighting the interest of the crypto community in the alt.
Moreover, DOT’s volume decreased last week, but it later stabilized. This reduces the chances of a sudden price drop. Not to mention, DOT’s development activity rose considerably, which was yet another green flag for the blockchain.
Nonetheless, DOT’s daily chart painted an ambiguous image as a few market indicators supported the possibility of a price surge, while others suggested otherwise.
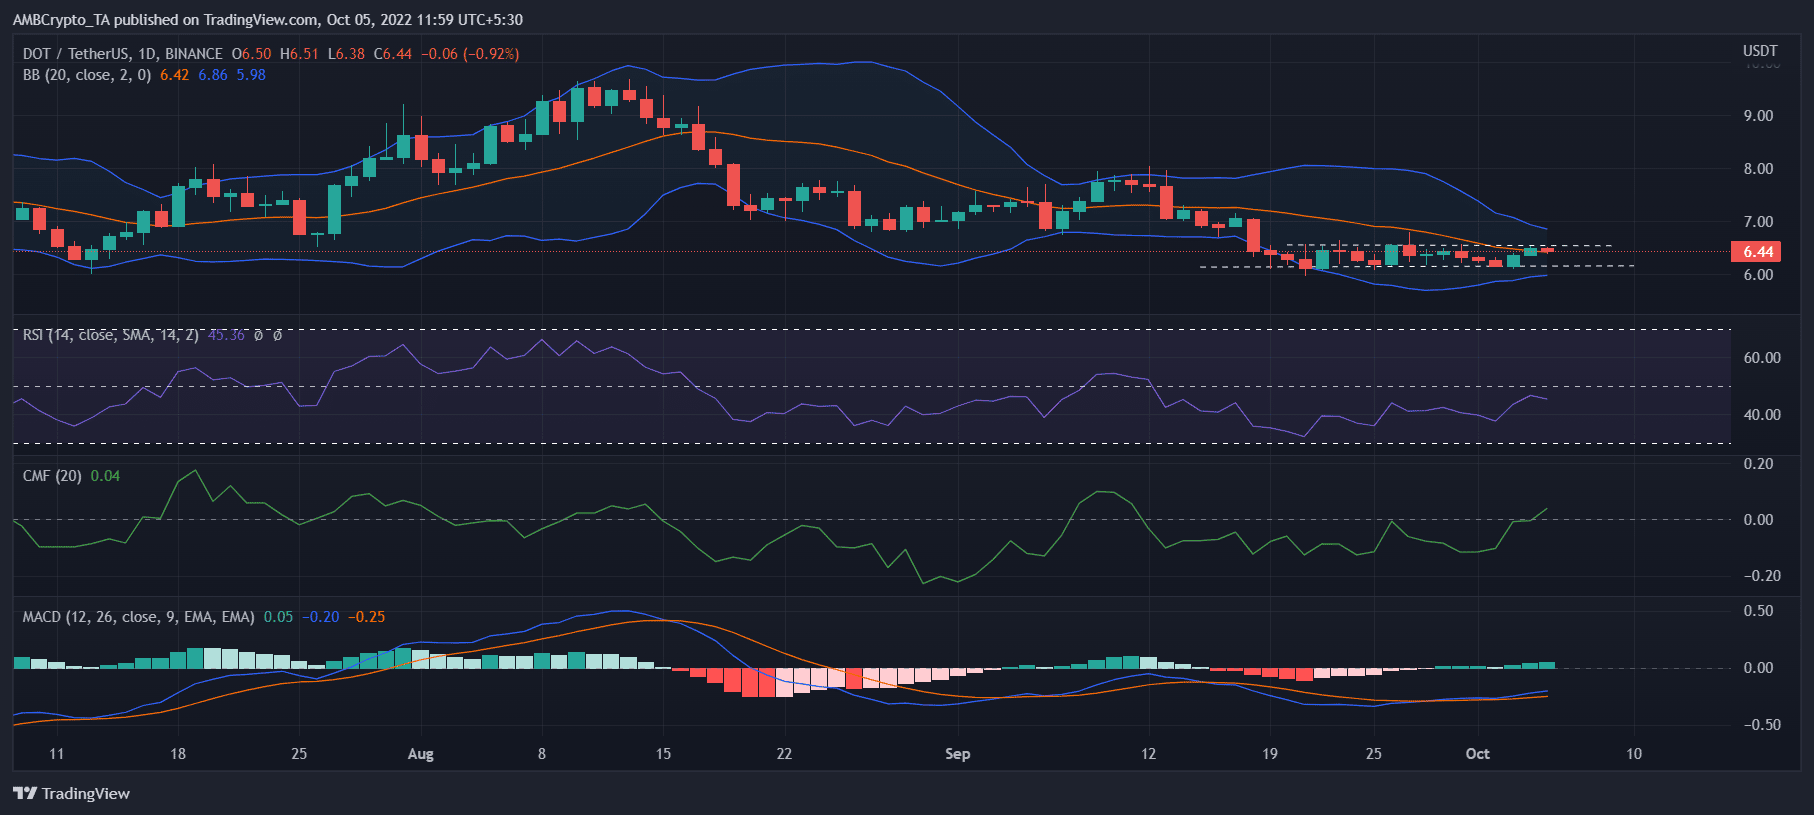
First and foremost, DOT showed strong support and resistance at the $6.16 and $6.55 marks, for nearly two weeks.
Interestingly, DOT’s Chaikin Money Flow (CMF) was on a slight uptrend from the neutral position, which might help the token break above its near-term resistance.
The Moving Average Convergence Divergence (MACD) also displayed a slight bullish crossover below the zero line. Thereby, giving investors hope for better days to come.
However, the Relative Strength Index (RSI), at press time, rested below the neutral mark. Moreover, the Bollinger Band (BB) indicated that DOT’s price was about to enter a crunched zone, further minimizing the chances of a northbound breakout in the short term.


![Lido DAO [LDO]](https://ambcrypto.com/wp-content/uploads/2025/08/Lido-DAO-DAO-400x240.webp)