Polkadot: How traders can leverage this pattern’s breakout to time entries

Disclaimer: The findings of the following analysis are the sole opinions of the writer and should not be considered investment advice.
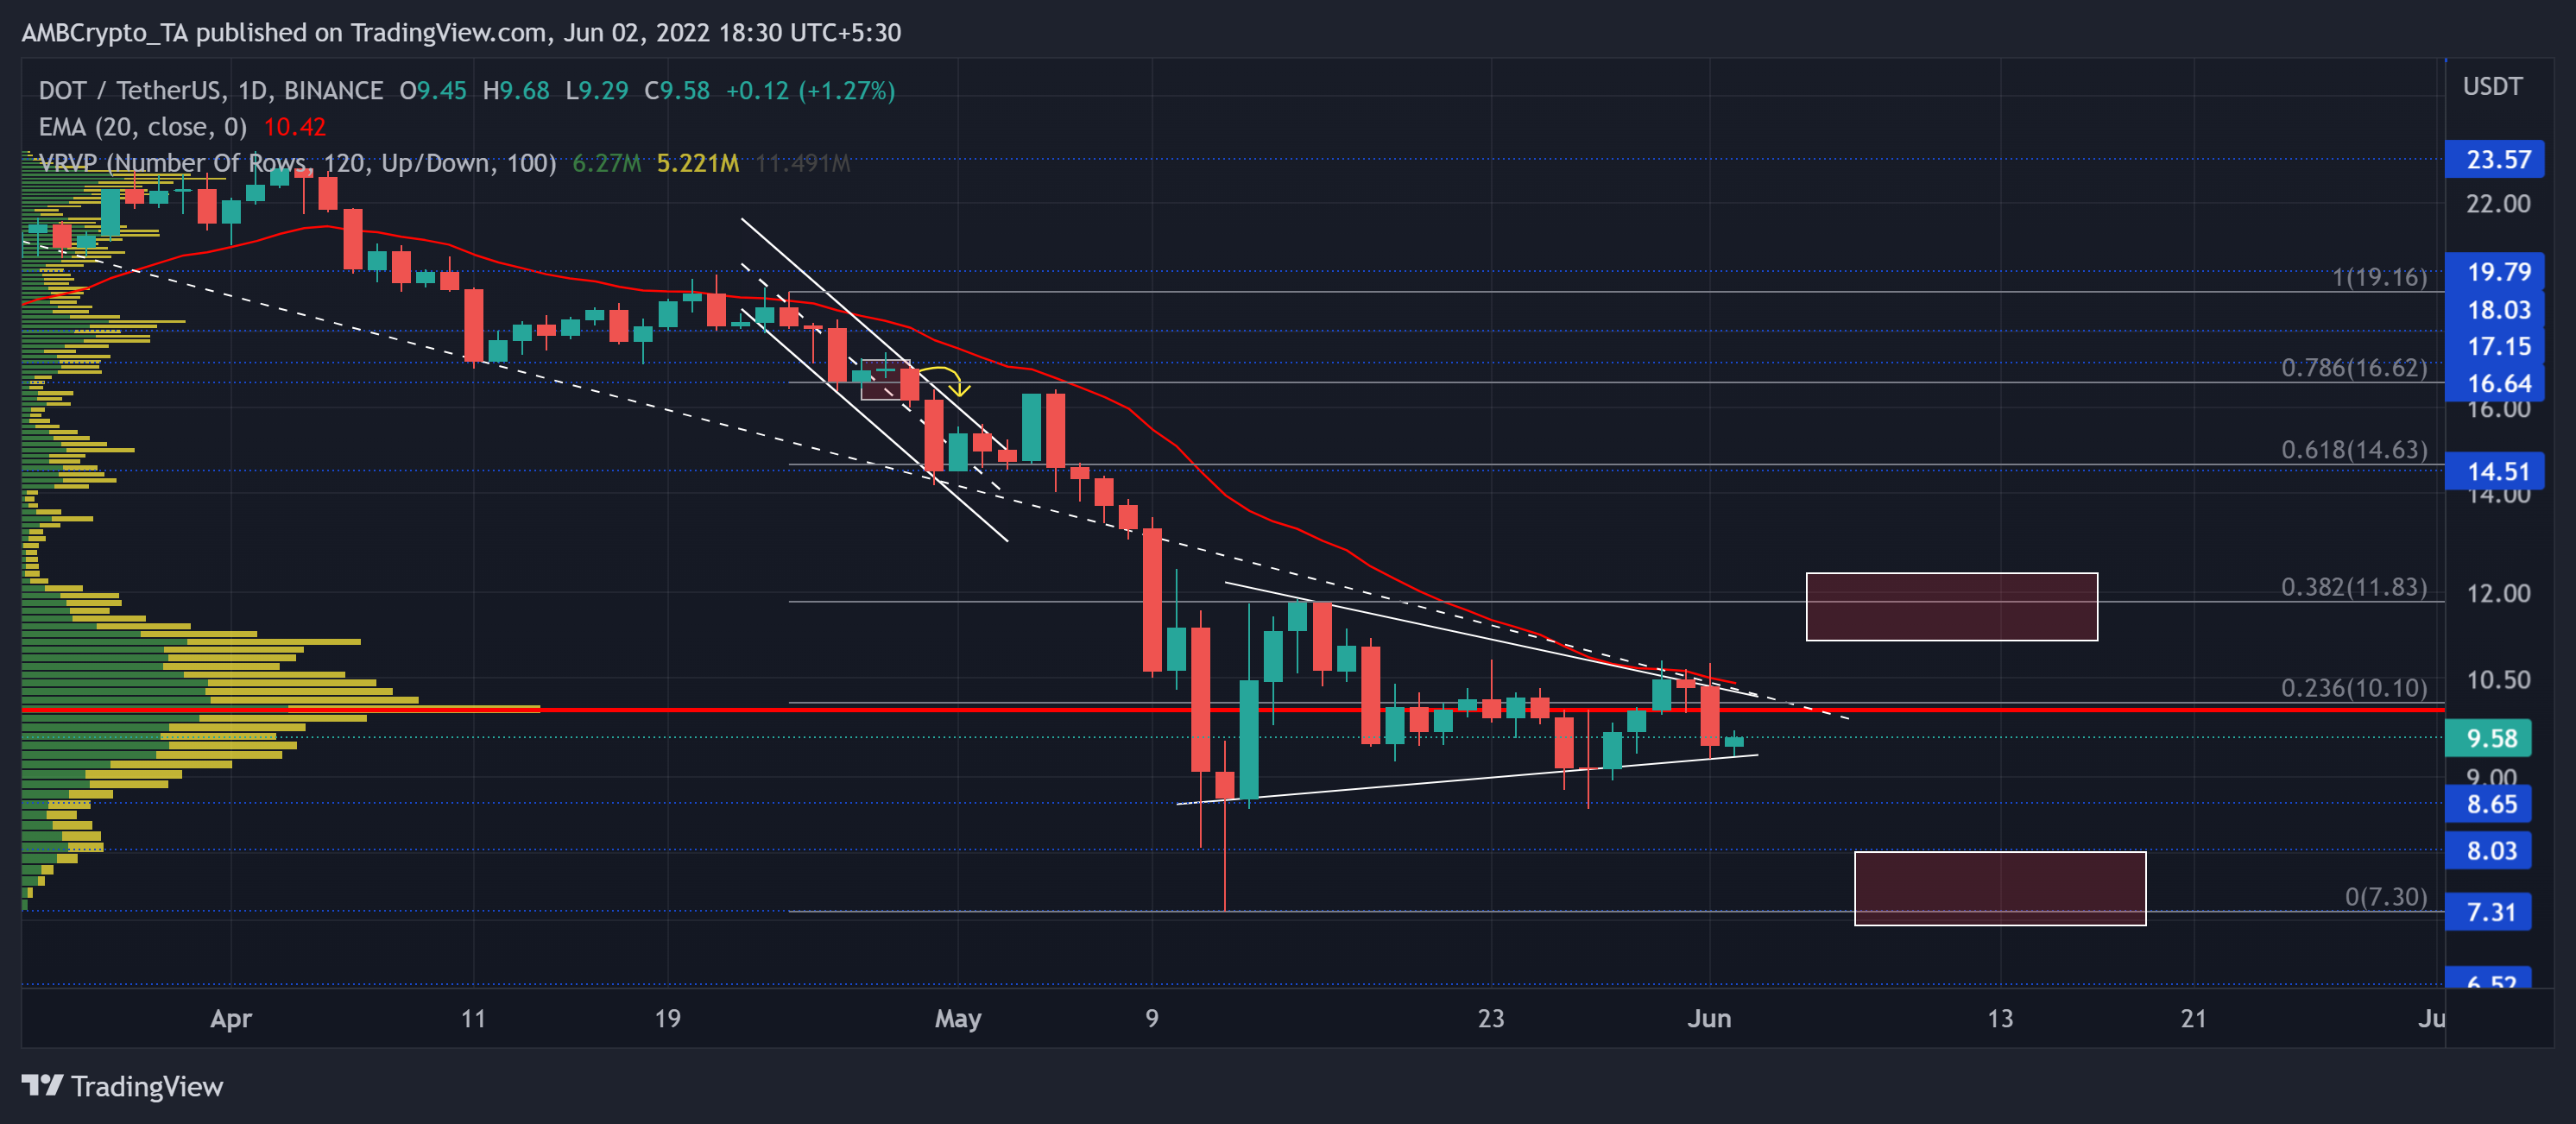
The last two months marked a visible bear show as they reiterated their vigor amidst the wider market sell-offs. On its way south, the 38.2% and the 23.6% Fibonacci levels have stood sturdy by depriving the bulls of a trend-altering rally.
The current price structure is an ideal bearish setup whilst the price action tightens between the bearish pennant pattern.
Any reversals from the 23.6% level would expose DOT to a potential downside in the coming sessions. At press time, DOT traded at $9.58, down by 7.84% in the last 24 hours.
DOT Daily Chart
Gauging the current Bitcoin sentiment, which only worsened over the last 24 hours, it could be profitable to have a conservative opinion on the market movements.
The recent retracements pulled DOT toward its 16-month low on 12 May after a 55% weekly decline (5-12 May). Since then, the gradual improvements on its troughs saw a negation by the bearish peaks. Thus, forming a bearish pennant on the daily timeframe.
With a relatively steep flagpole preceding the pennant, the sellers seemed determined to continue their streak of lower peaks. Also, during the pennant formation, the volumes were on a declining trend. More often than not, bearish pennants are more effective during such a declining trend.
With a confluence of the 23.6% level, the 20 EMA (red), and the two-month trendline resistance (white, dashed), DOT could aim to retest the $8.6-support. Any fall below this mark would provide further shorting opportunities in the $7-$8 range.
Should the broader sentiment improve, a bearish invalidation can lead to relatively short-lived gains until the 38.2% level.
Rationale
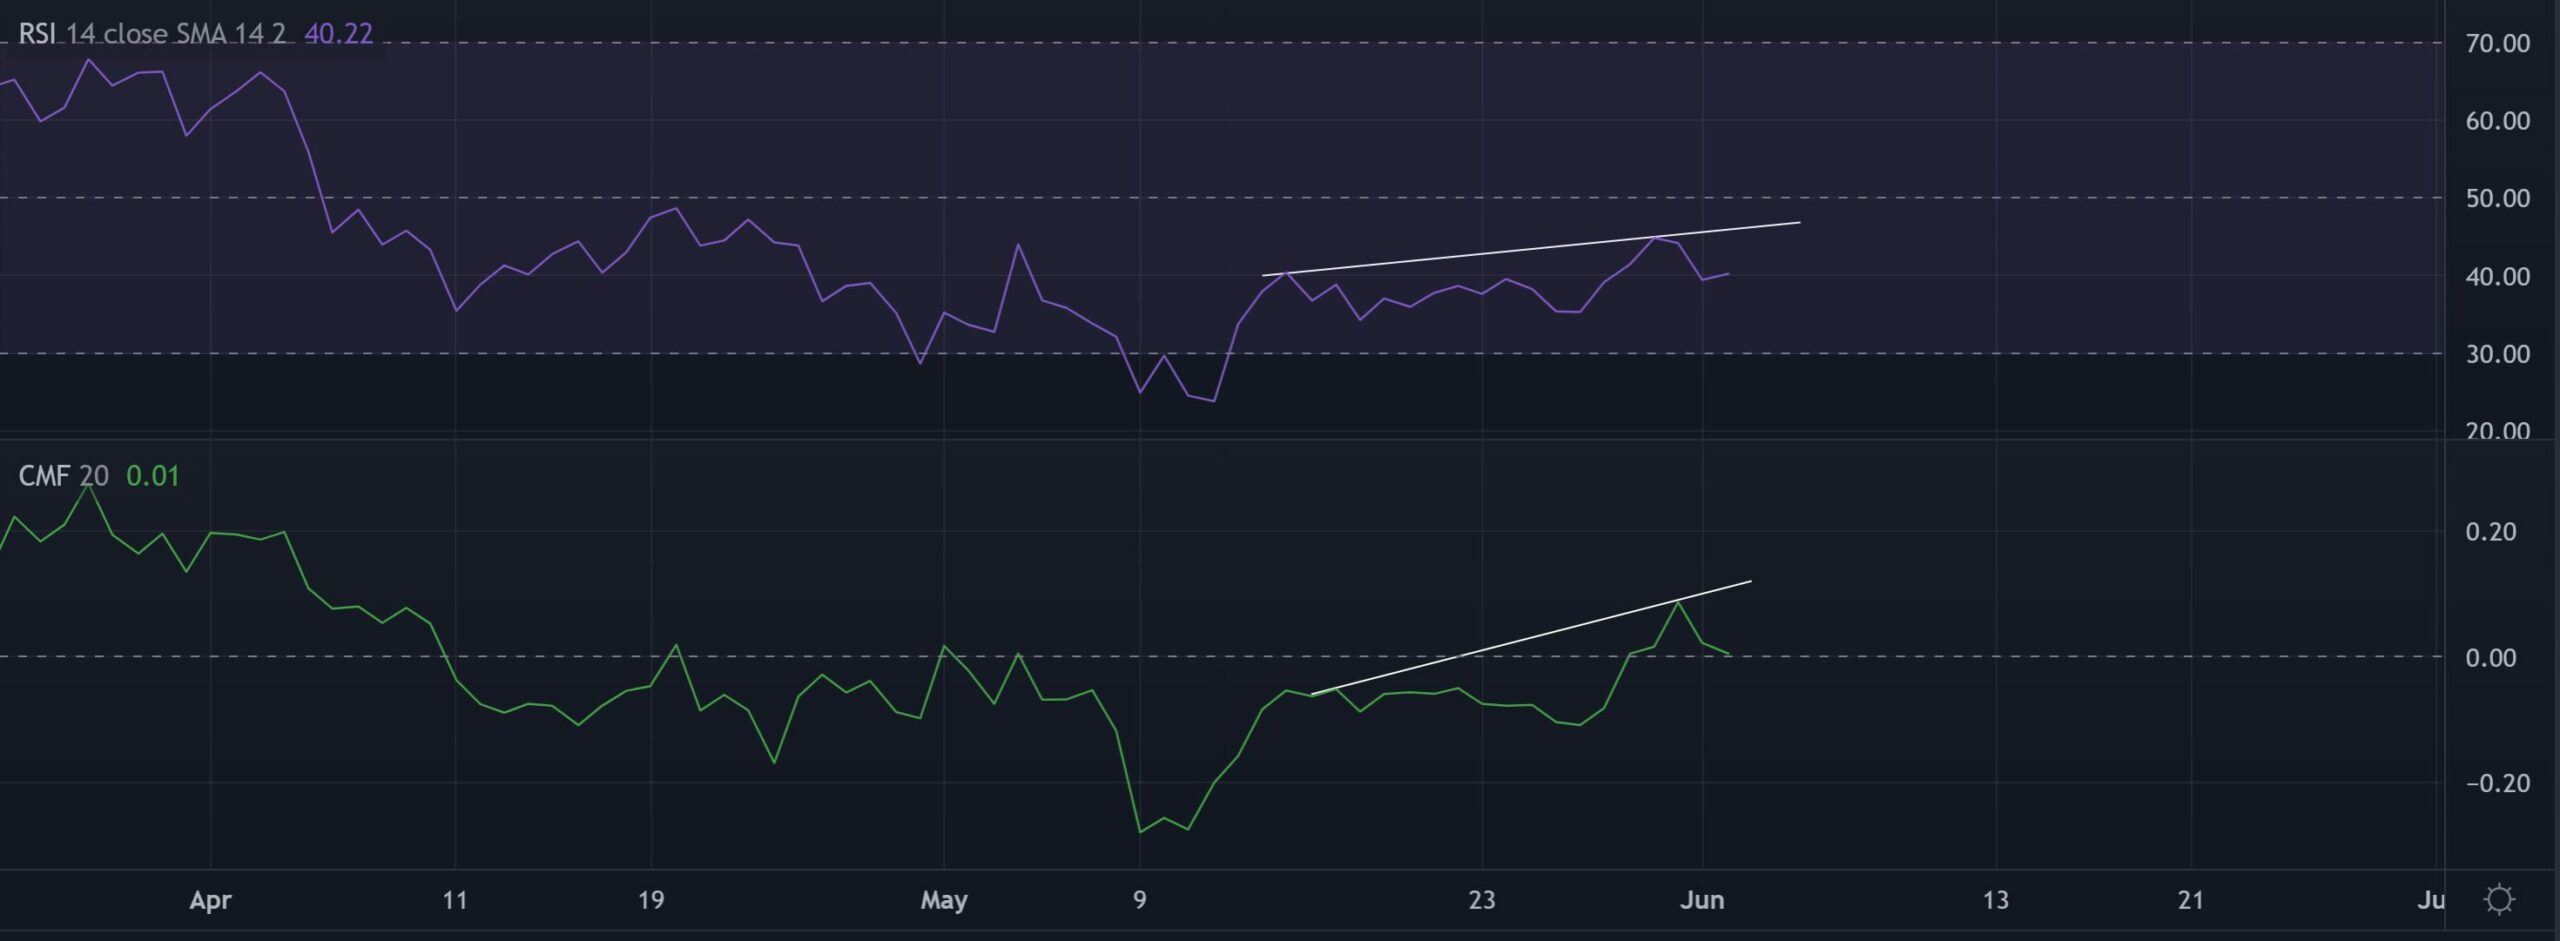
The RSI’s recent trajectory entailed a gradual growth. But its higher peaks have bearishly diverged with the price action. Thus, reinforcing the bearish edge in the near term. To invalidate this, the bulls needed to find a close beyond the index’s trendline resistance.
Similarly, the CMF joined hands with RSI to reiterate the divergence. Any close below the zero-mark would affirm the bearish narrative painted above.
Conclusion
Looking at the bearish pennant setup approaching the confluence of three hurdles, DOT could face a near-term setback.
A close below the pennant would expose the alt for a test of the $8.6-support followed by the $7.3-zone. Should the bulls find renewed buying pressure, a short-term rally could see restrictions at the 38.2% level.
Finally, an overall market sentiment analysis becomes vital to complement the technical factors to make a profitable move.


