Polkadot, IOTA, Dogecoin Price Analysis: 25 March


The bearish scenario across the market was reflected by Polkadot as it broke down from a bullish chart pattern. IOTA was forced to retrace all gains from a recent surge, while Dogecoin continued to fall after briefly testing the $0.062-level.
Polkadot [DOT]
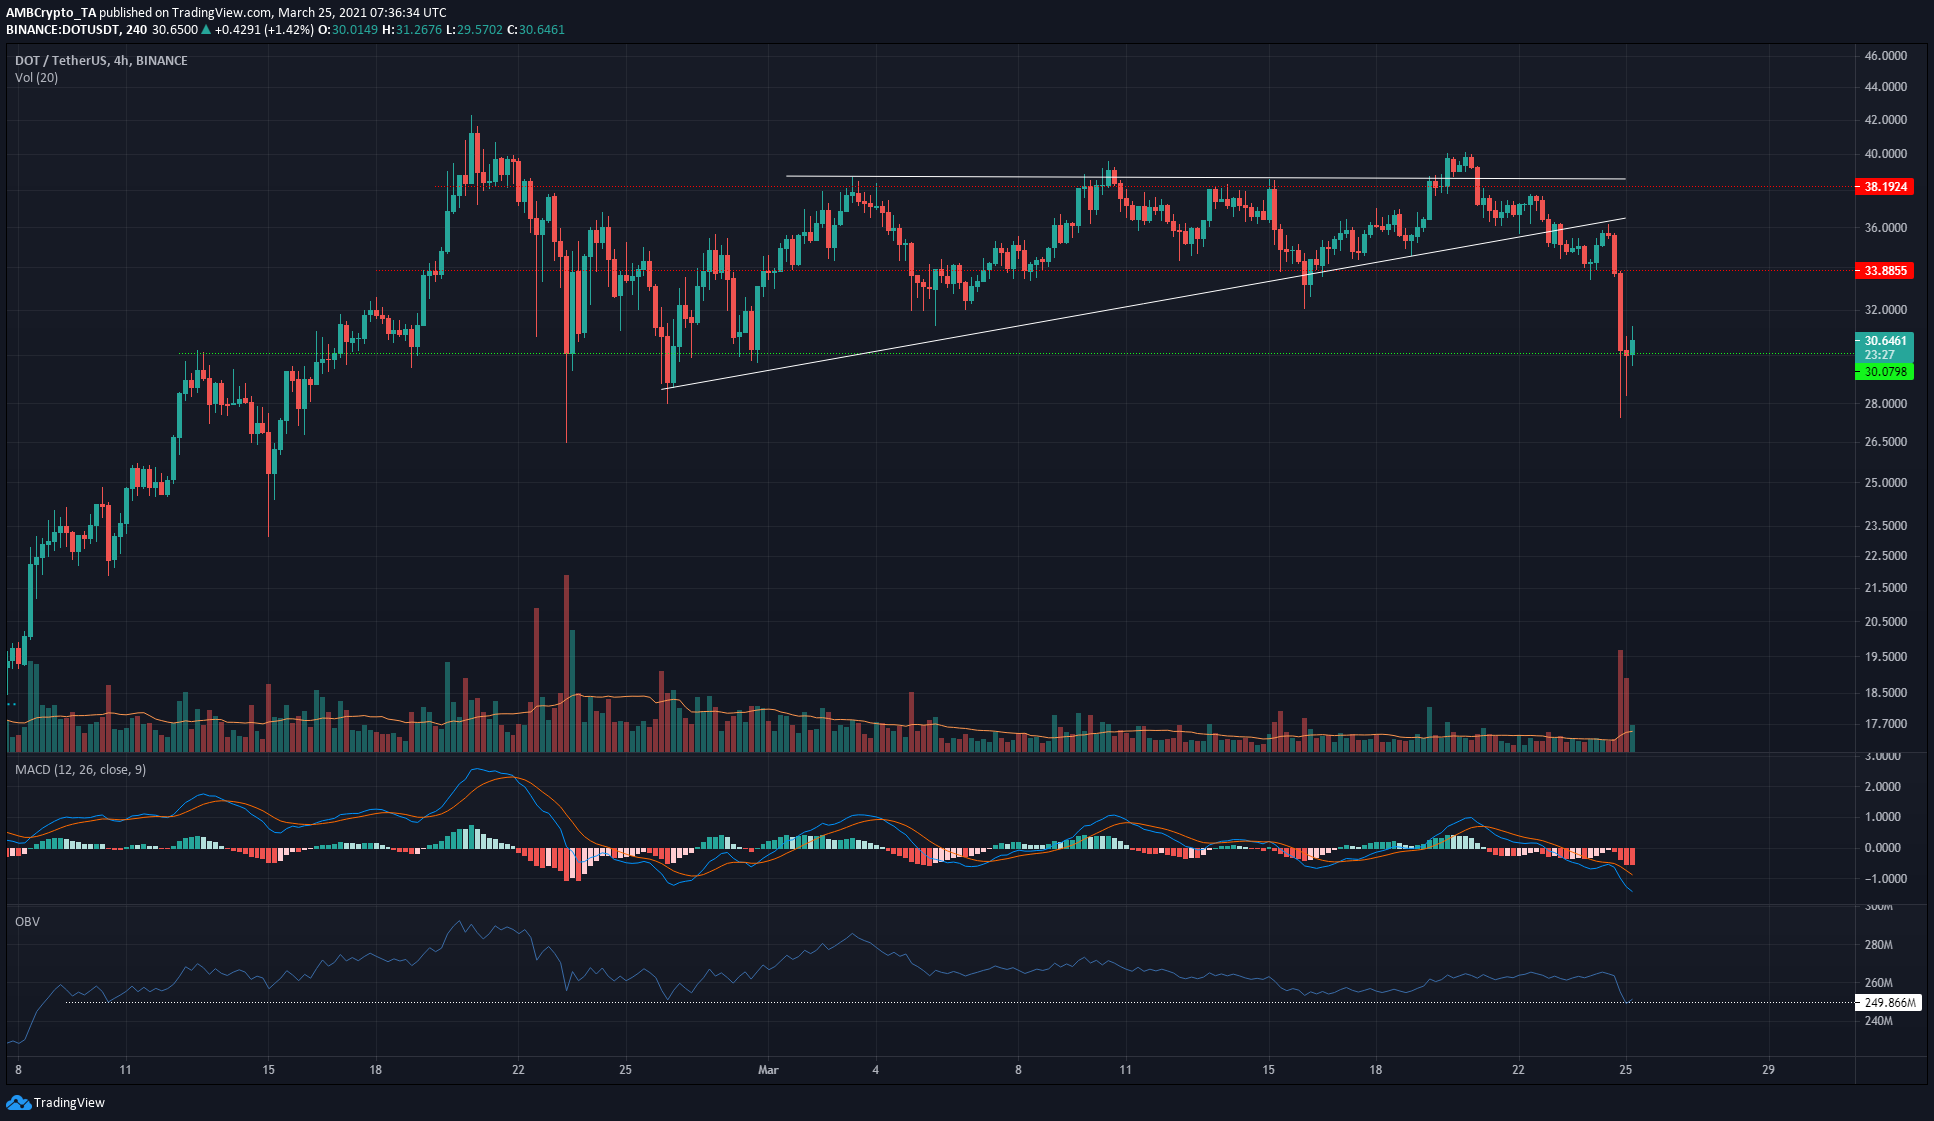
Polkadot formed an ascending triangle chart pattern. This pattern generally sees a northbound breakout, but in this case, DOT dropped under the ascending trendline and was forced to retrace all the way back to $30, with the MACD showing strong bearish momentum even as DOT bounced weakly off the $30-support level.
This represented a 22% drop from the resistance around the $38-zone. Further drops can’t be ruled out, but DOT was placed at an important support level.
Since surging past $21, the OBV had formed a floor that each subsequent drop hadn’t dropped under. If the OBV goes lower, it will be a strong indication that sellers are in control. The month of March has already highlighted the strength of the market’s sellers, and the market’s bulls would need to defend the $28-$30 demand region in the coming days.
IOTA
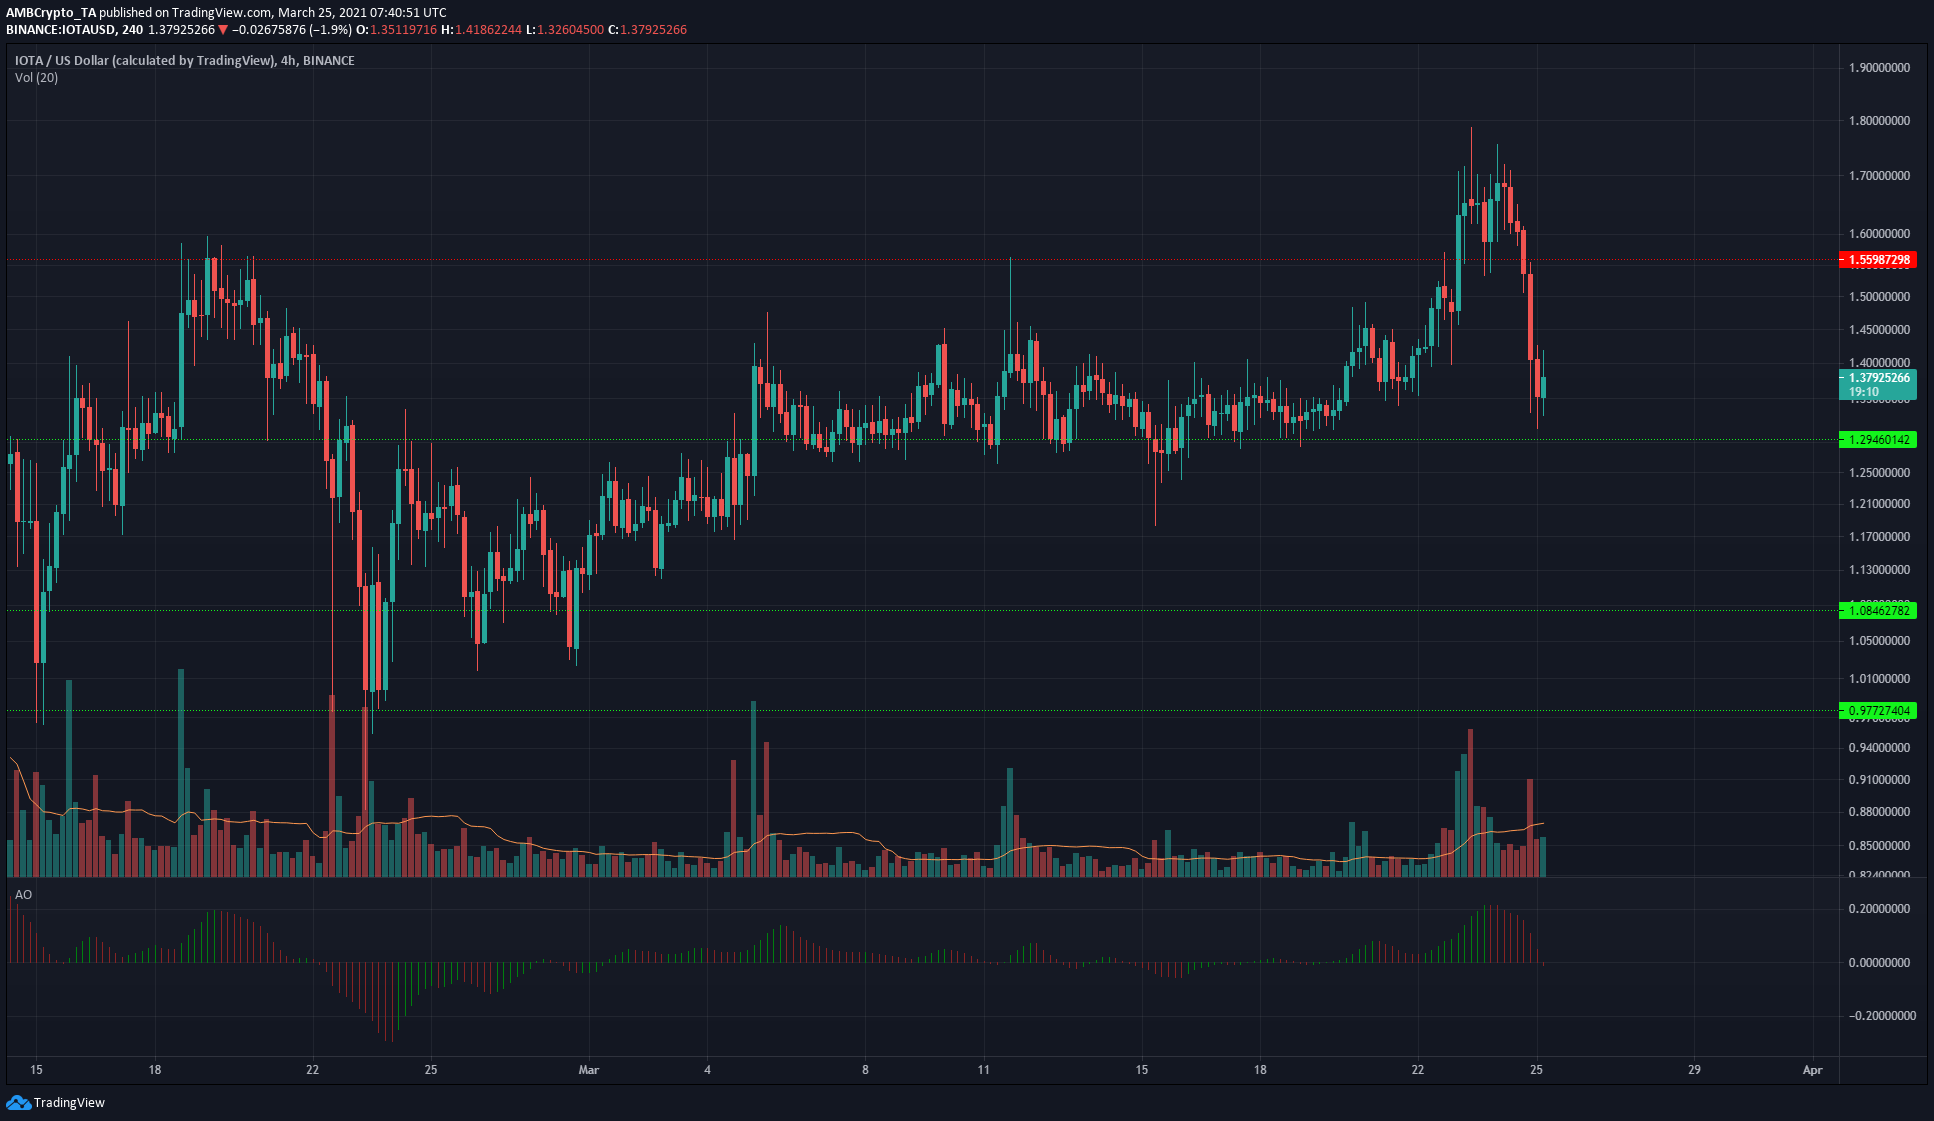
For a period of two weeks, IOTA was consolidating above the $1.29-level of support. The past week saw IOTA surge to $1.7, and just as it tested $1.55 to confirm it as support, selling pressure accelerated to drive IOTA back to the $1.3-area.
The Awesome Oscillator approached the zero line and could confirm a crossover under the same in the coming hours as the most recent trading session was not yet closed, at the time of writing. More consolidation around $1.29 can be expected.
Dogecoin [DOGE]
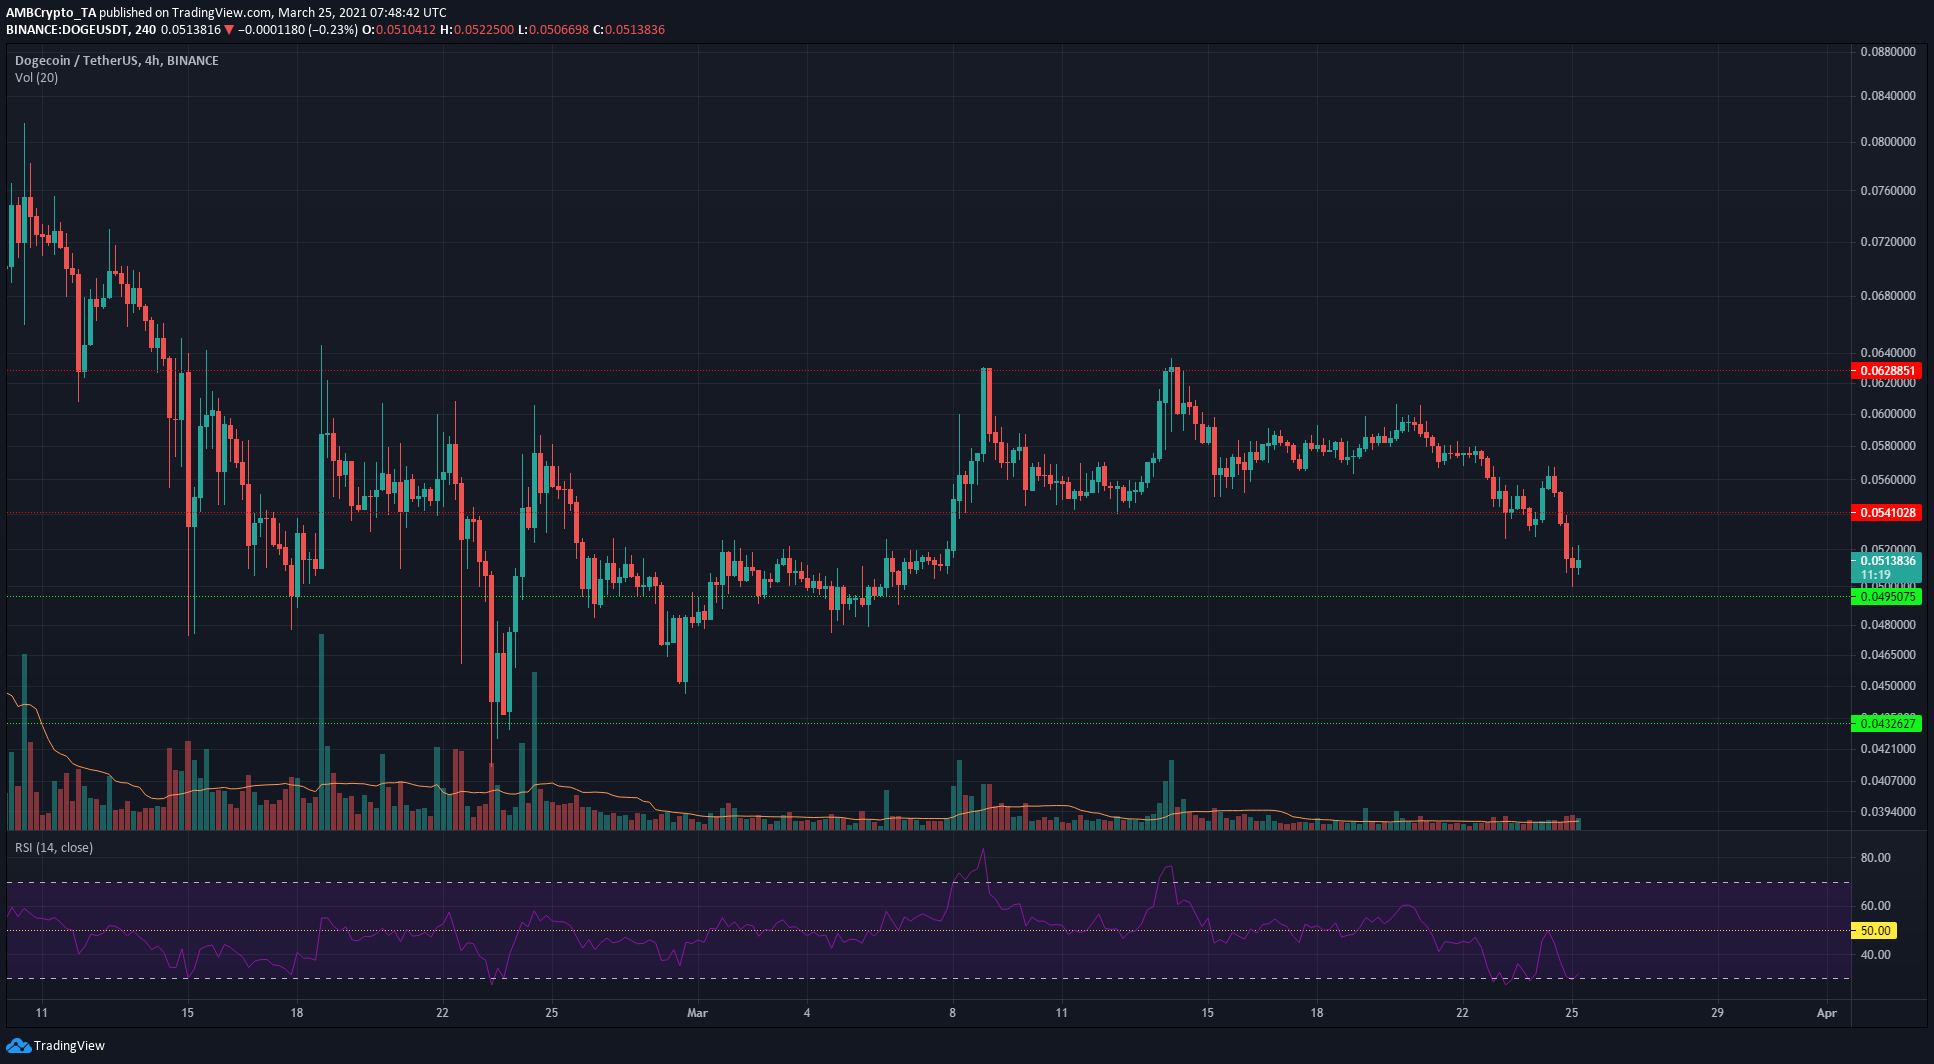
DOGE formed a double top at the $0.062-level after flipping the $0.049 and $0.054-levels from resistance to support. However, the previous downtrend could assert itself once more as DOGE sank towards $0.049 again.
The RSI formed higher lows in the past couple of days even as the price formed lower lows. This could see DOGE bounce to $0.054, a 6% hike from $0.051, before another drop. The RSI indicated a downtrend and shorting opportunities can arise at $0.054.