Polkadot, NEAR, Fantom Price Analysis: 01 May

With Bitcoin rediscovering a way to its $37,000-base after seven weeks, the global market cap crumbled down toward the $1.8T-mark.
Needless to say that Polkadot, NEAR, and Fantom took a plunge on their charts over the last few days. On the flip side, the technicals of these altcoins could now aim to see a gradual recovery as they rise from the oversold territory.
Polkadot (DOT)
Considering an over three-month time span, DOT has been holding its grounds at the $14.4-level. In doing so, it has found a compression range with a ceiling at the $23.1-mark.
Taking sight of the short-term price movements, the recent bearish phase from its April highs led the alt to lose more than 40.5% of its value. As a result, the altcoin tumbled to its two-month low on 1 May near the $14.4 floor. DOT’s historical tendencies could steer the alt to mark an upswing. The southbound 20 EMA (red), in this case, could pose hurdles in buying recuperation.
At press time, DOT traded at $14.99. The RSI’s week-long downward slide pulled the index to match its 14-week low. While resurging from the ashes of the oversold area, a close above its trendline resistance could open doorways for further recovery.
Near Protocol (NEAR)
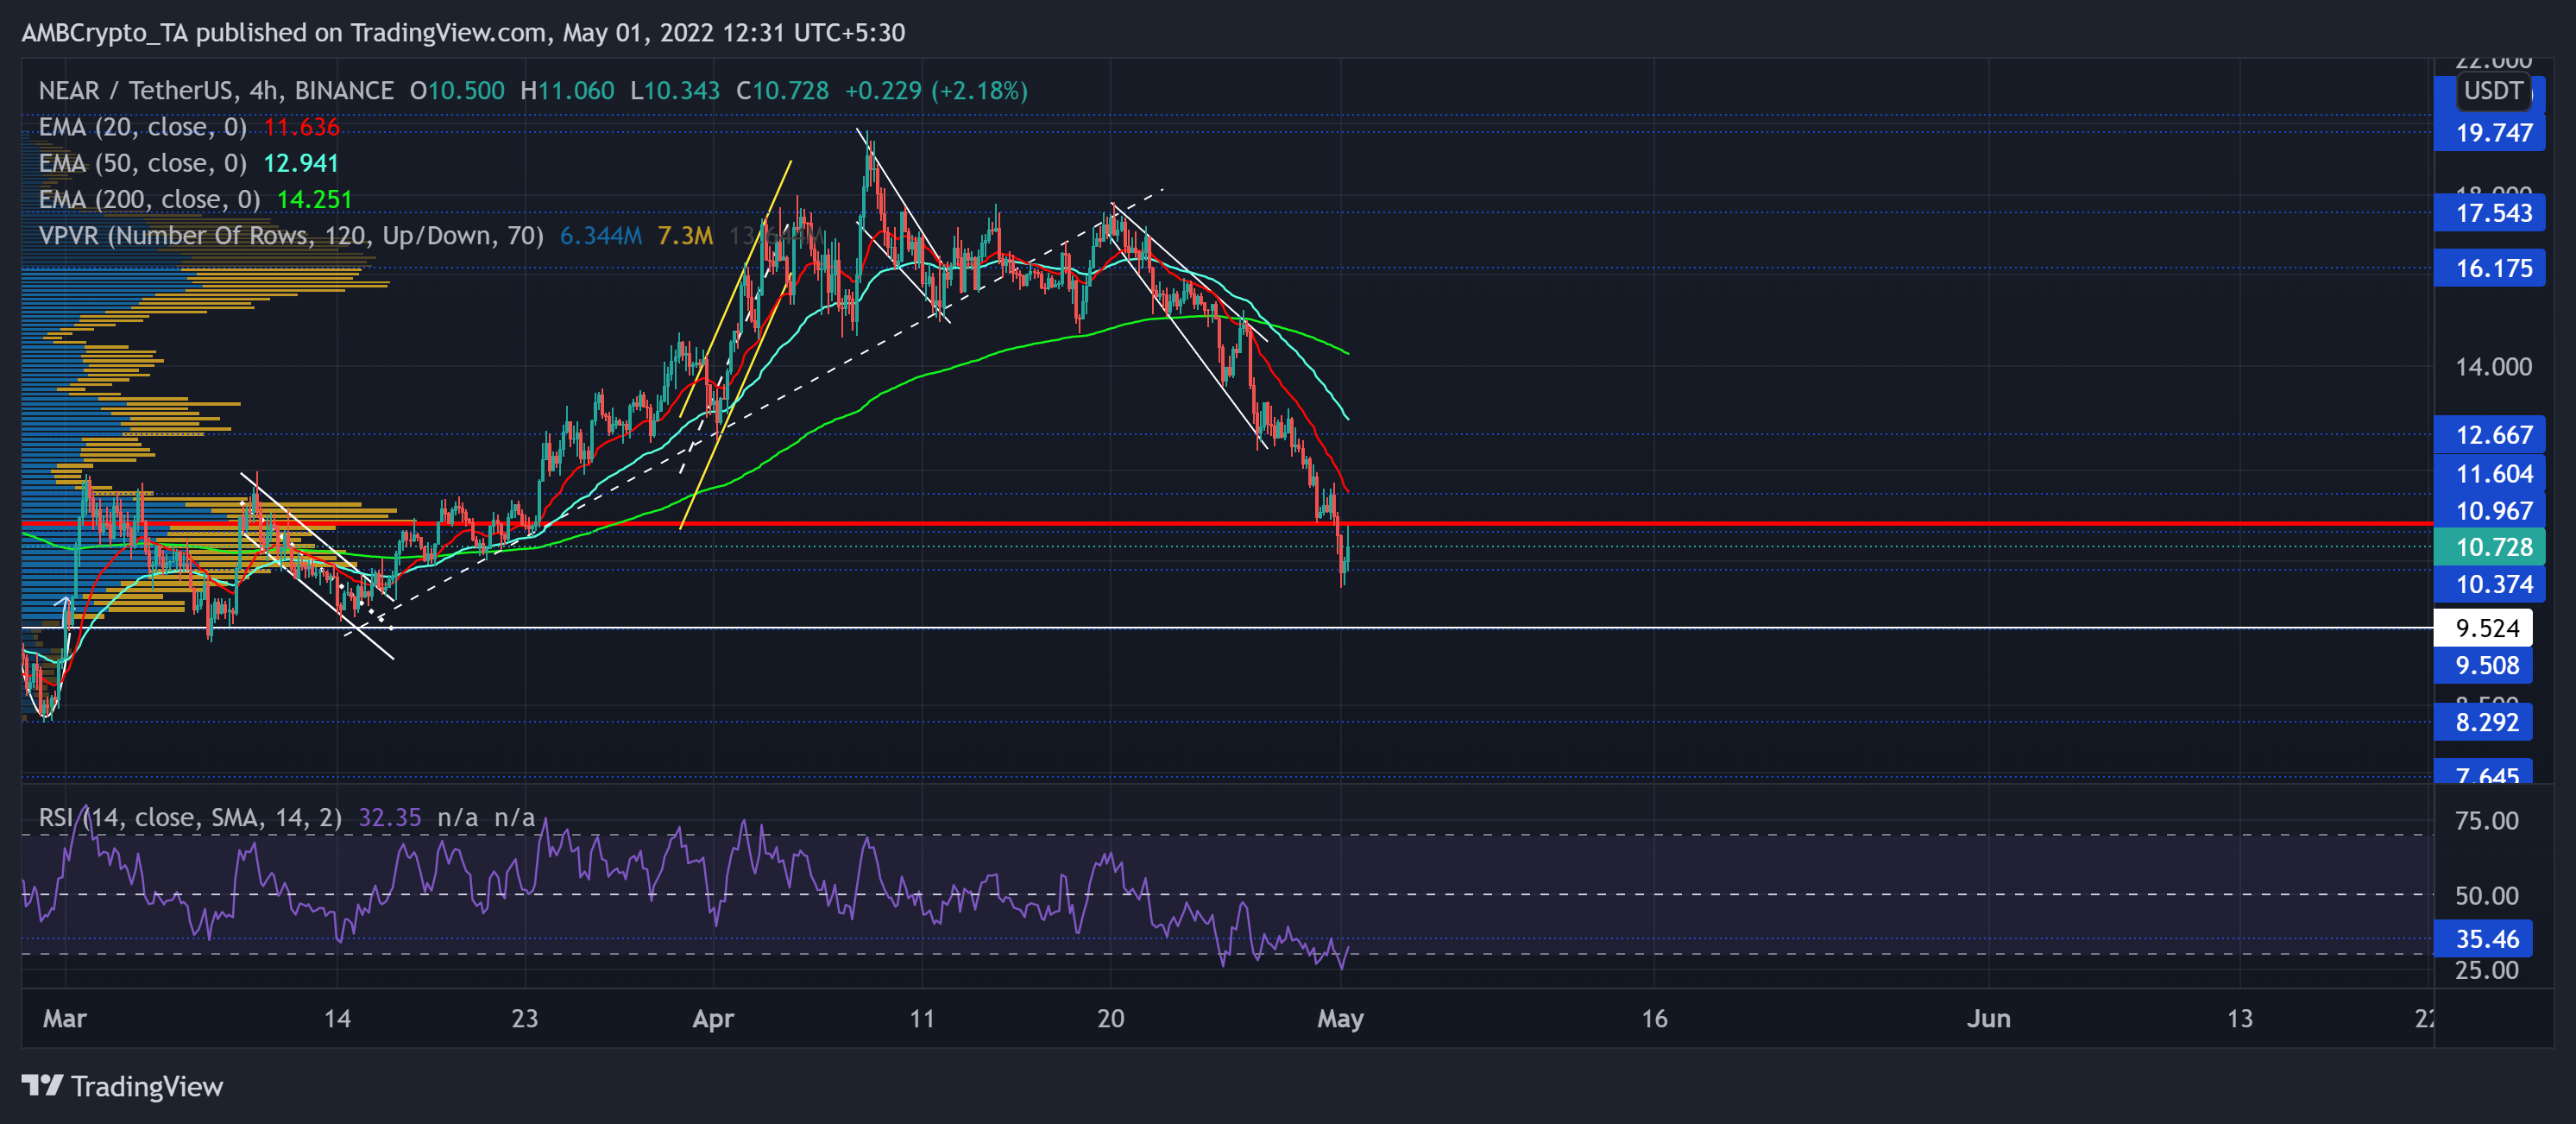
While the long-term narrative for NEAR is certainly not favoring the bulls, the buyers have refrained bears from finding new grounds in the last few months.
But with the sellers keeping a regular check on the alt’s peaks, NEAR lost nearly half its value from its multi-week April highs. With the 20 EMA (red) and 50 EMA (cyan) falling below the 200 EMA (green), the buyers found it challenging to uphold the Point of Control (horizontal red line) level at $11.
At press time, NEAR was trading at $10.728. Resonating with its peer alts, NEAR’s RSI saw slight improvements after drifting in the oversold region. From this moment forth, a close above the 35-mark would position the alt for a stronger comeback.
Fantom (FTM)
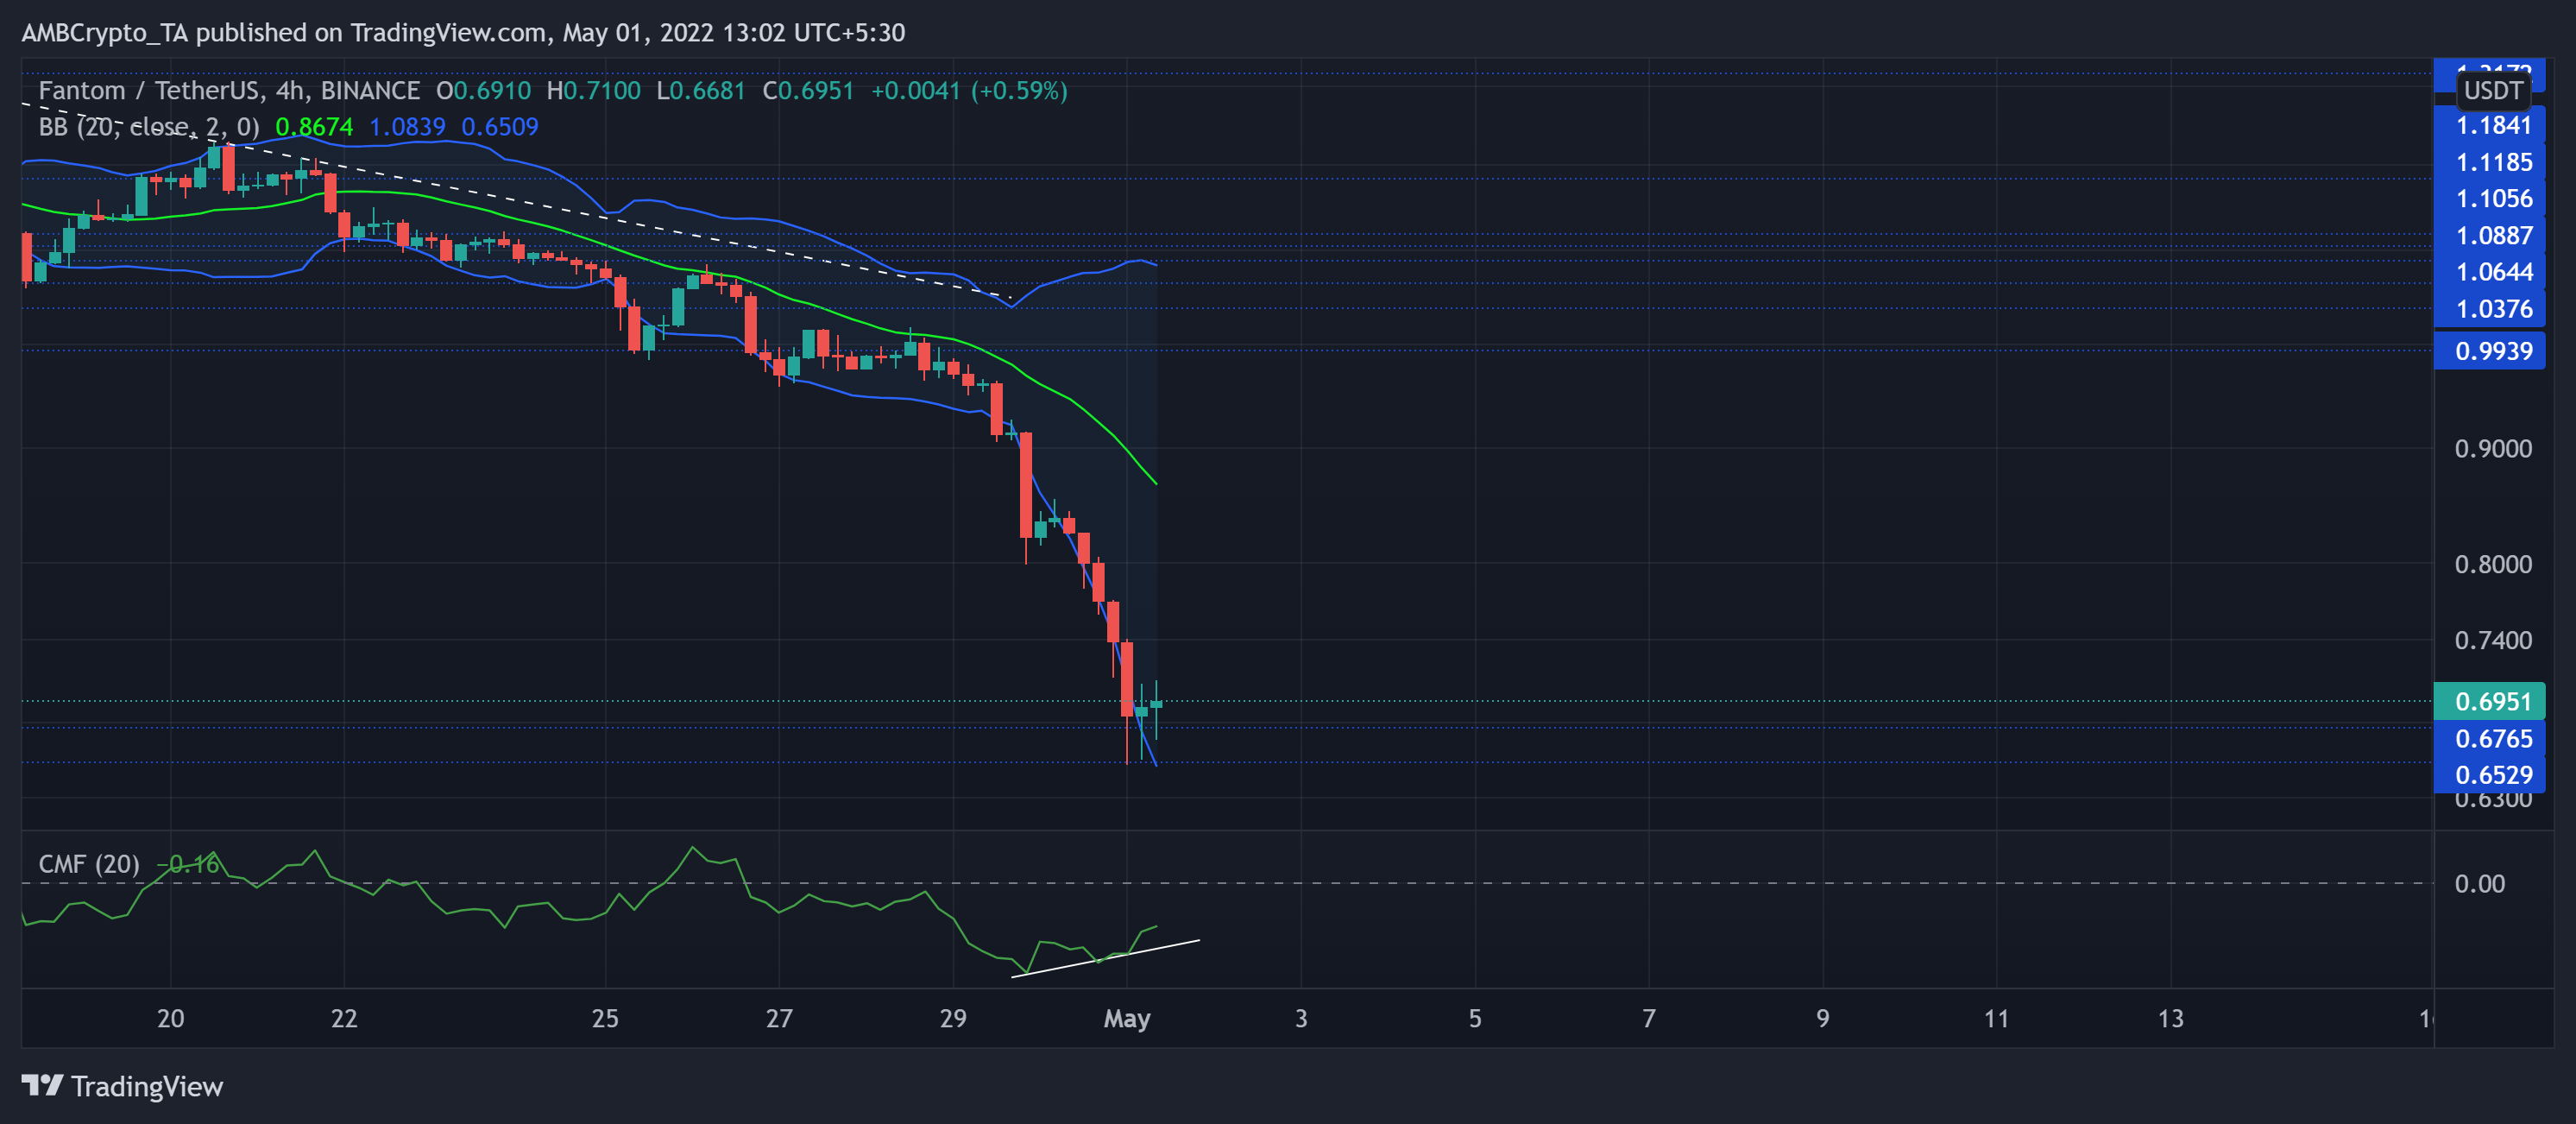
Contrary to NEAR, FTM bears have successfully punctured through vital points to find fresher grounds to rest on. Since reversing from the long-term $3.3-resistance, the sellers have denied any trend-altering privilege to the bulls.
The digital currency lost nearly 80.5% of its value (from 17 January) and hit its eight-month low on 1 May. The latest sell-off propelled a series of bearish engulfing candlesticks that kept testing the lower band of the Bollinger Bands.
At press time, FTM was trading at $0.6951. Without a surprise, the money volumes had taken a plunge, as reflected in the bearishness of the CMF. But over the last two days, the oscillator bullishly diverged with price while keeping the bullish comeback hopes alive.


