
- Polkadot’s price declined marginally in the last 24 hours.
- A few of the metrics hinted at a price rise soon.
While several cryptos registered promising gains over the last seven days, Polkadot [DOT] somewhat moved sideways. But there was more to the story, as this just might be the calm before a storm. Let’s have a look at what’s happening with Polkadot.
Polkadot’s possible move
CoinMarketCap’s data revealed that Polkadot’s price dropped marginally over the last 24 hours. At the time of writing, DOT was trading at $6.21 with a market capitalization of over $8.9 billion, making it the 14th largest crypto.
The negative price action also had an impact on the crypto’s social metrics. AMBCrypto’s analysis of Santiment’s data revealed that DOT’s social volume dropped over the last week.
On top of that, DOT’s weighted sentiment also dropped sharply. This clearly meant that bearish sentiment around the token was dominant in the market.
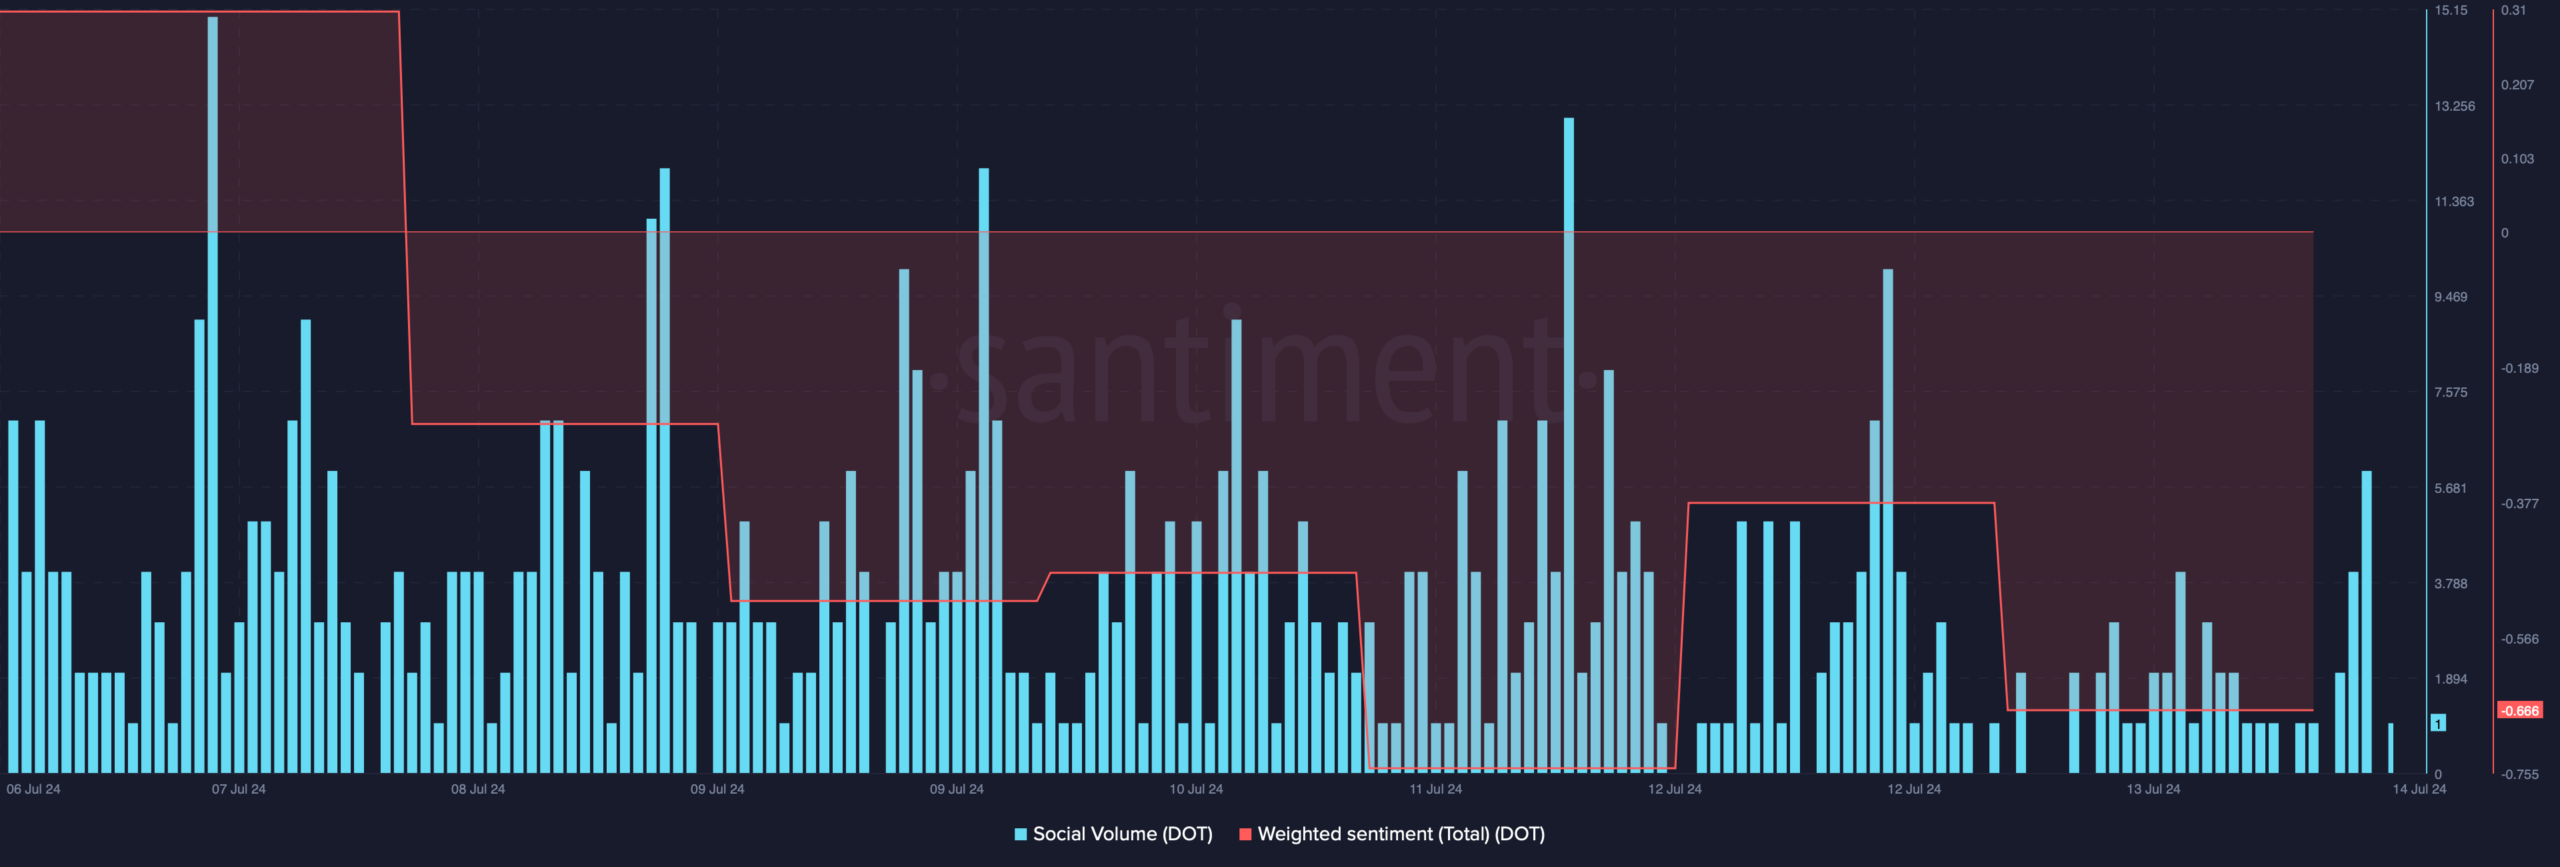
Source: Santiment
However, Polkadot has a trick up its sleeves that might soon result in DOT doubling its price.
World Of Charts, a popular crypto analyst, recently posted a tweet revealing a bullish falling wedge pattern on the crypto’s price chart.
The pattern emerged in March, and since then, the token’s price has been consolidating inside the pattern. At press time, it was on the verge of a breakout.
If that happens, then investors might soon witness DOT’s price increase by more than 84%. In fact, the possible bull rally might as well push the token’s price towards $12 in the coming weeks.

Source: X
Is a DOT rally around the corner?
Since there was a chance of a bullish breakout, AMBCrypto then checked Polkadot’s on-chain data to better understand what to expect from the token.
AMBCcrypto’s look at Coinglass’ data revealed that DOT’s open interest dropped along with its price. Generally, a decline in open interest hints that the chances of the on-going price trend changing are high.
On top of that, DOT’s long/short ratio increased, suggesting that there were more long positions in the market. This meant that bullish sentiment was increasing around DOT.

Source: Coinglass
The technical indicator MACD displayed a bullish crossover. However, the rest of the indicators were bearish. Both the Relative Strength Index (RSI) and Chaikin Money Flow (CMF) registered slight downticks, suggesting that the bearish price action might continue in the coming days.
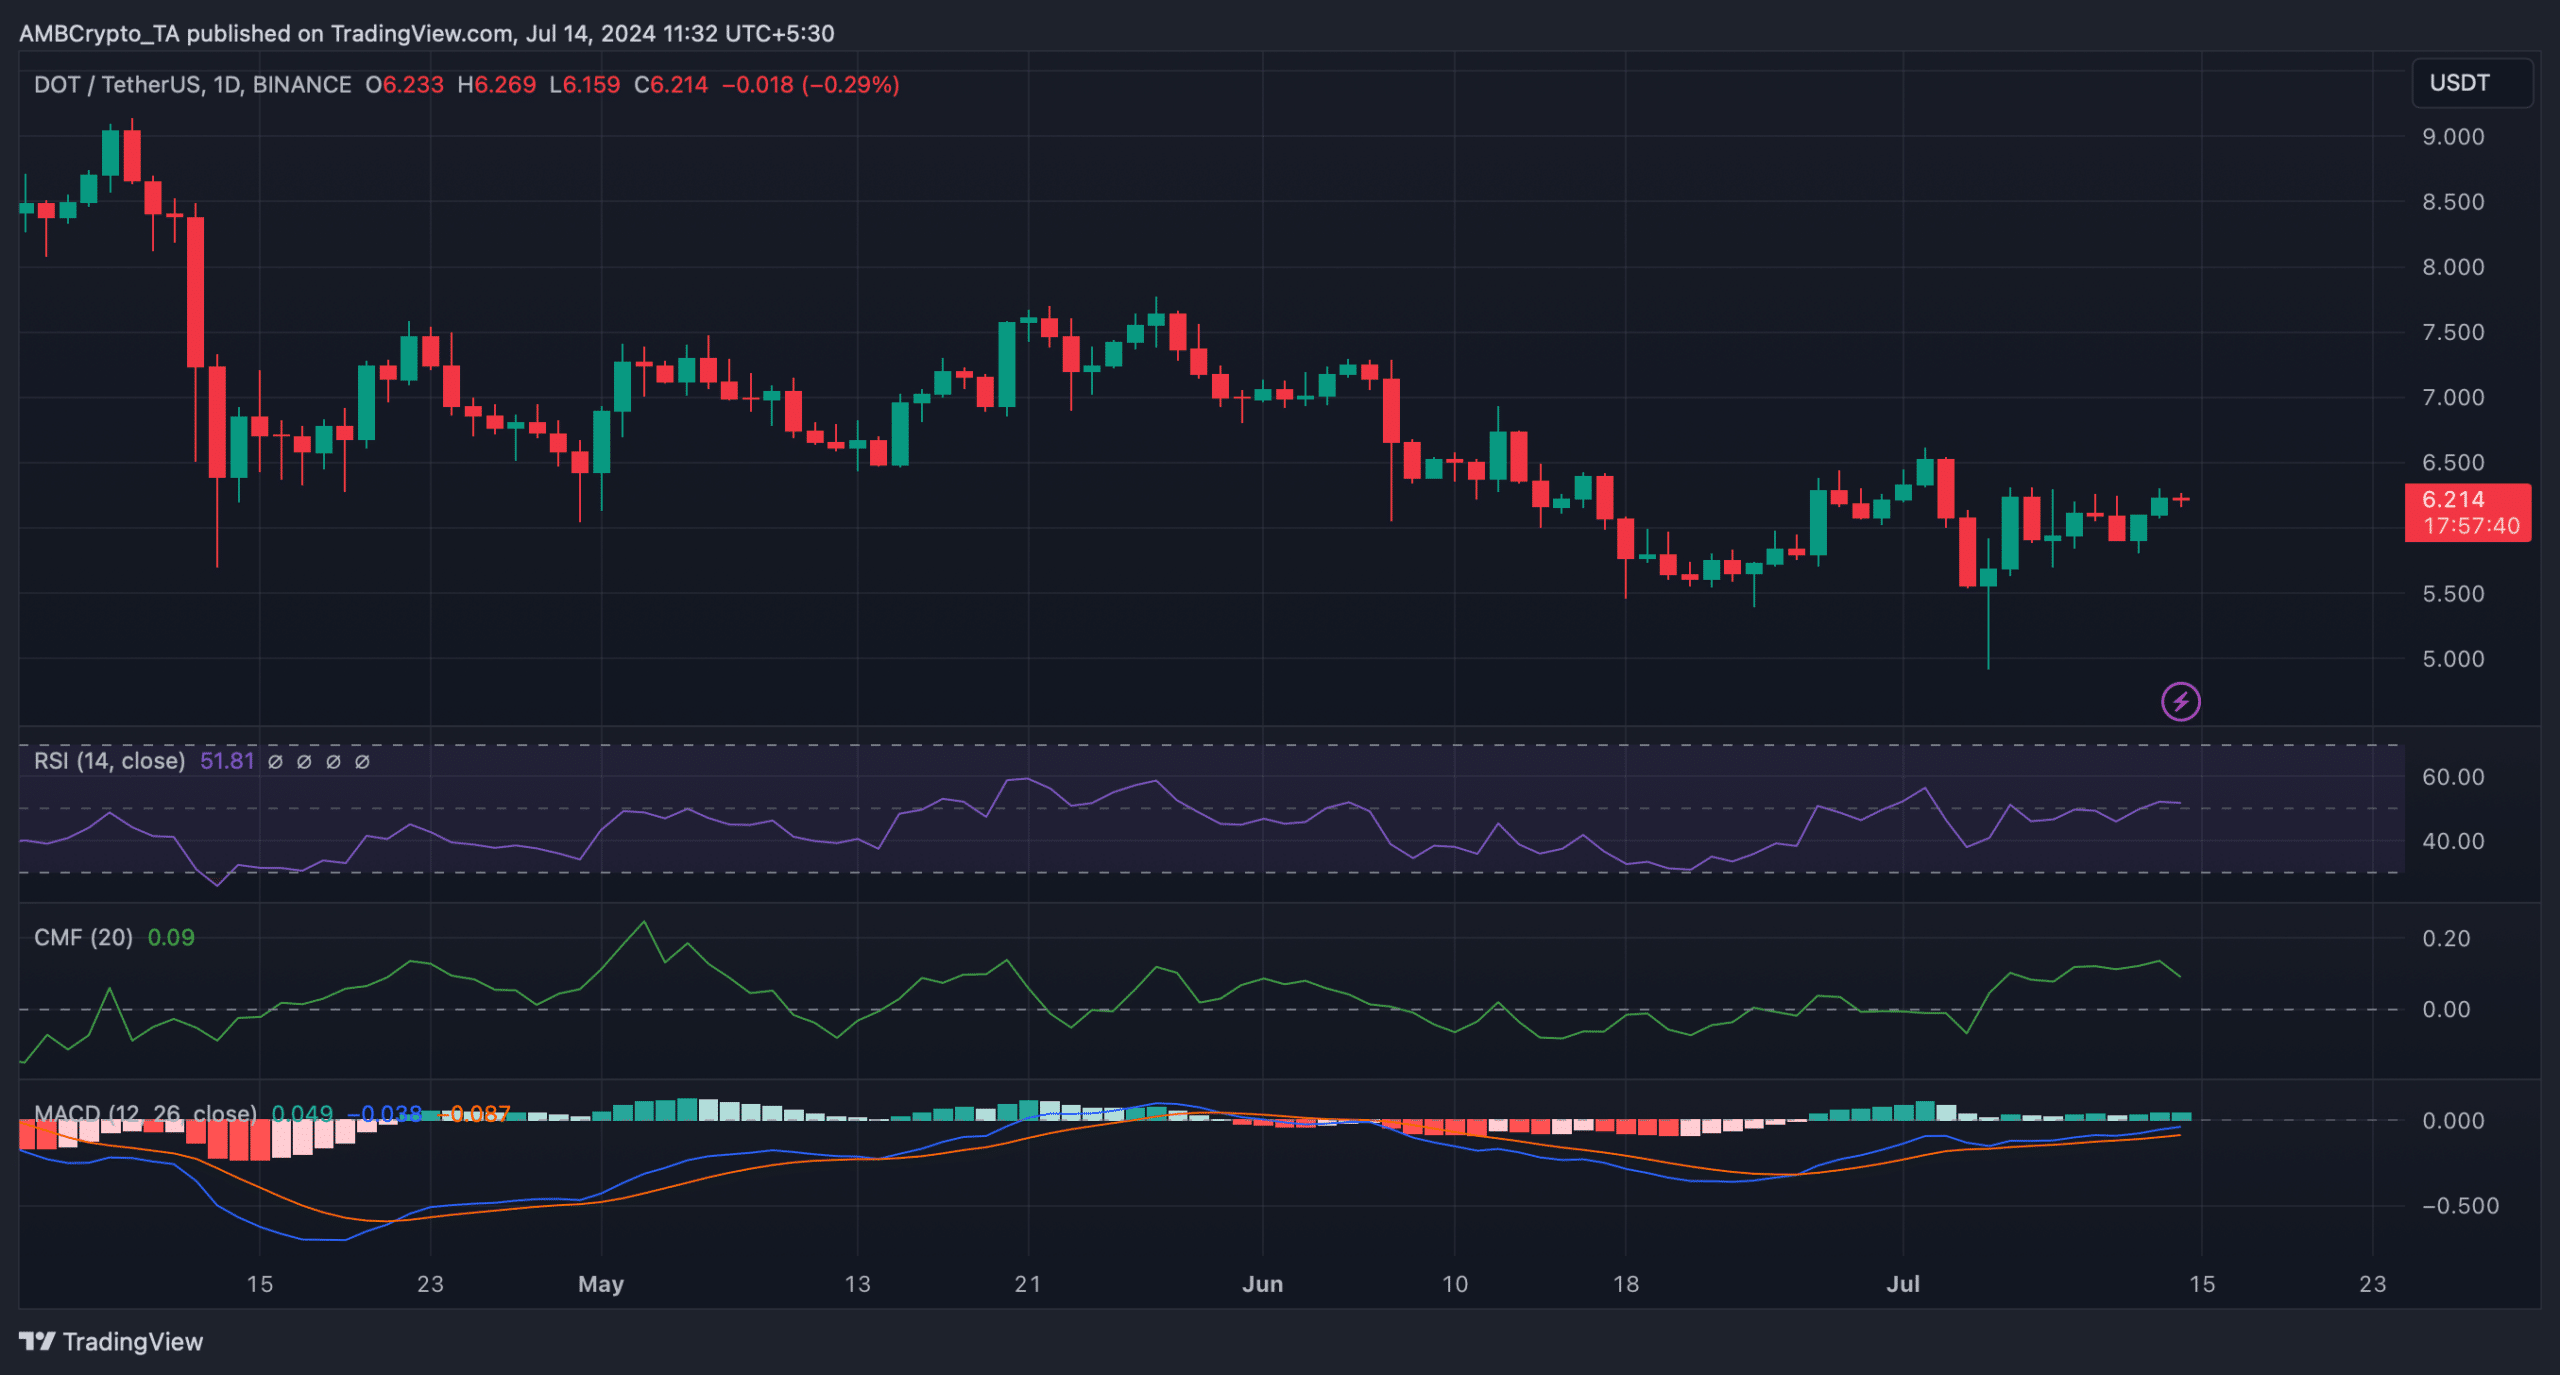
Source: TradingView
Read Polkadot [DOT] Price Prediction 2024-2025
In the short term, if the bears takeover, then investors might witness DOT drop to $5.7 in the coming days.
Nonetheless, if DOT has to turn bullish, then it must first go above its resistance near $6.3, as liquidation would rise sharply at that mark.

Source: Hyblock Capital


![Will Ethena [ENA] start 2025 with a 50% drop to $4.5? Assessing...](https://ambcrypto.com/wp-content/uploads/2025/01/ena-400x240.webp)