


Altcoins, including Polkadot, seem to be doing well and the reason for this is bitcoin’s new ATH. While at the moment DOT’s price may be benefiting from bitcoin’s surge, however, if bitcoin crashes, DOT’s dip may be more serious than that of BTC. Hence, it is advised to take profits and not try to catch the top.
At press time, DOT looks bullish, but as explained it solely because of BTC and this surge is quite likely to be extremely temporary. Hence, this article takes a look at the much-needed short-term price action of Polkadot.
Polkadot 4-hour chart

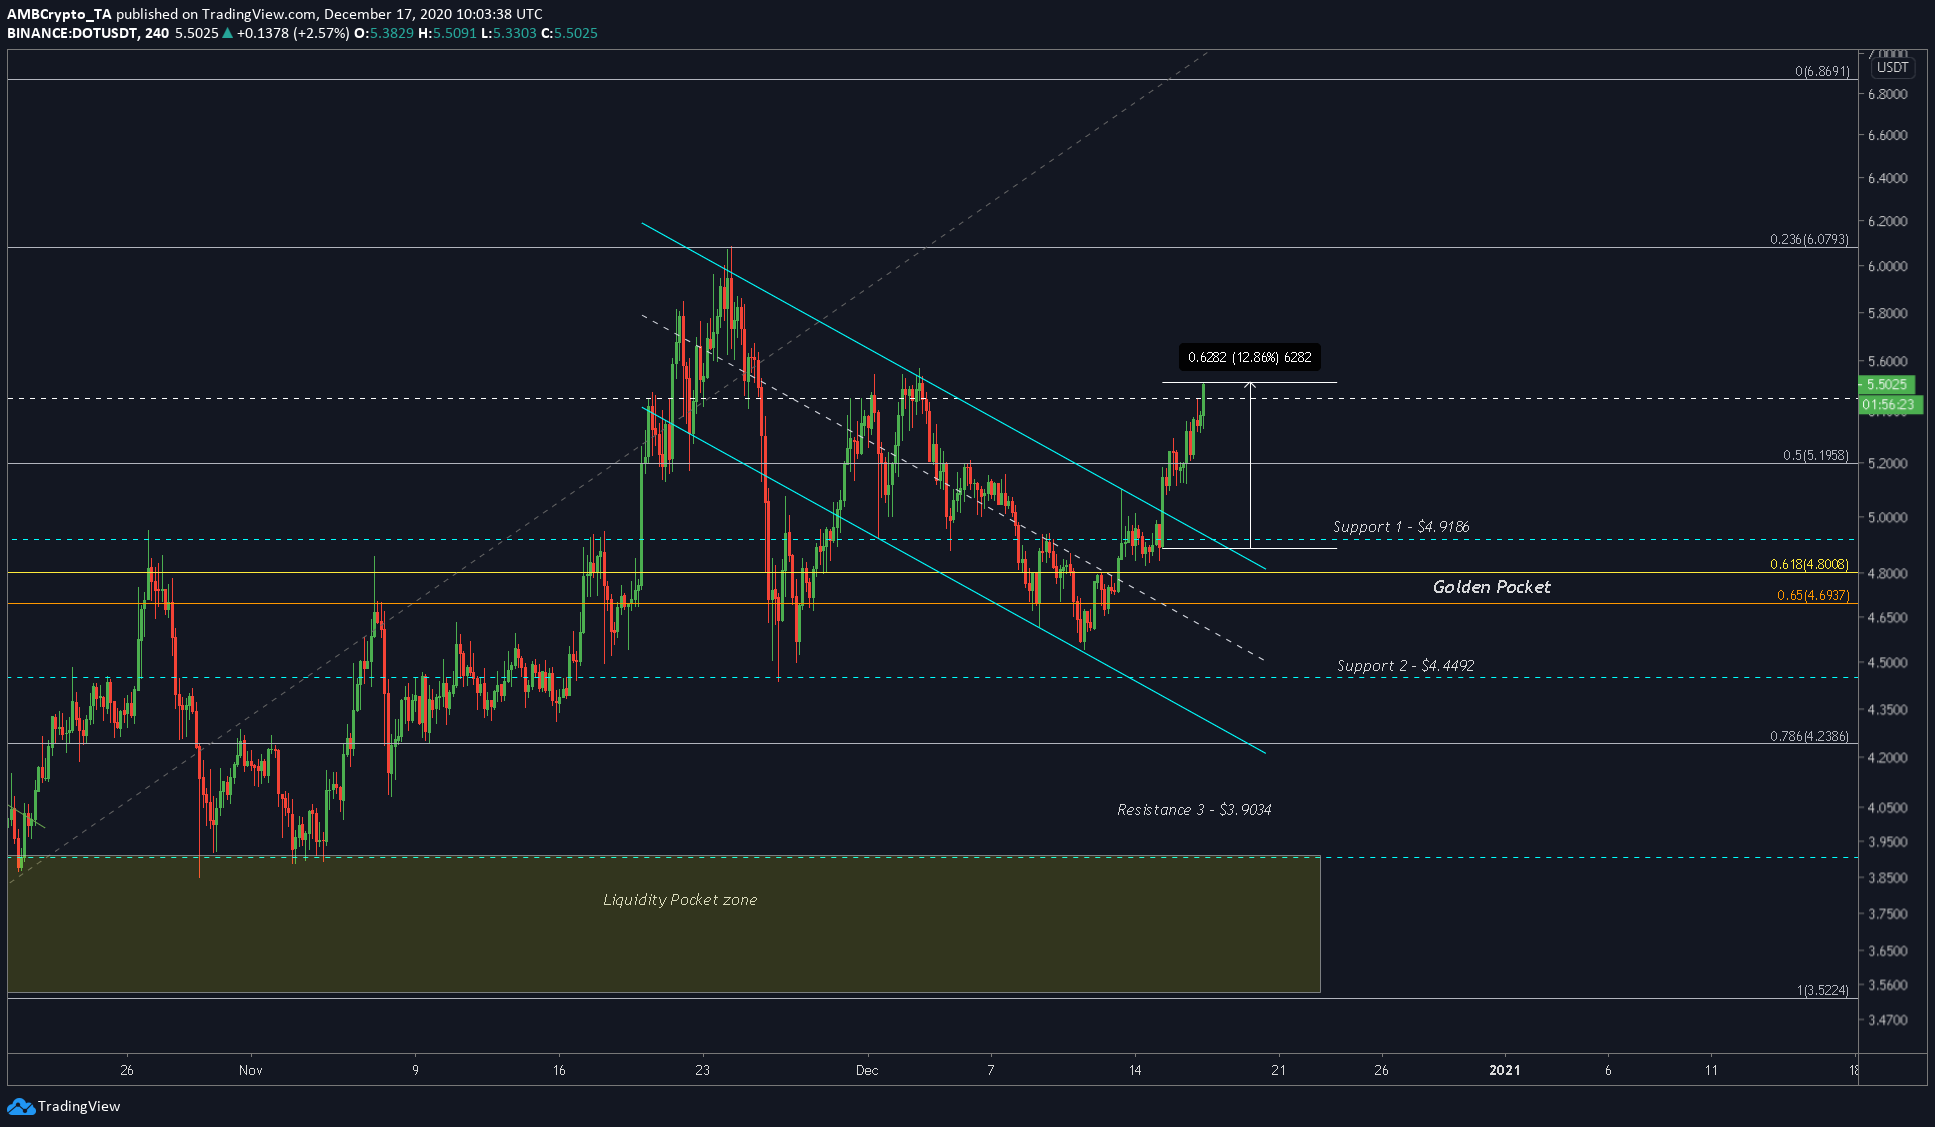
Before getting into the actual chart, let’s take a look at the previous chart, to understand what has happened since the last prediction. The price seems to have broken out of the channel and has surged by 12% as predicted. This surge has broken the resistance at $5.198 and is trying to hit the next level at $6.0739. However, this seems both likely and unlikely at the same time considering how volatile the market is. Hence, even if this target is achieved it might be for a brief period of time.
Now, let’s take a look at how we can adjust our levels and what to expect.

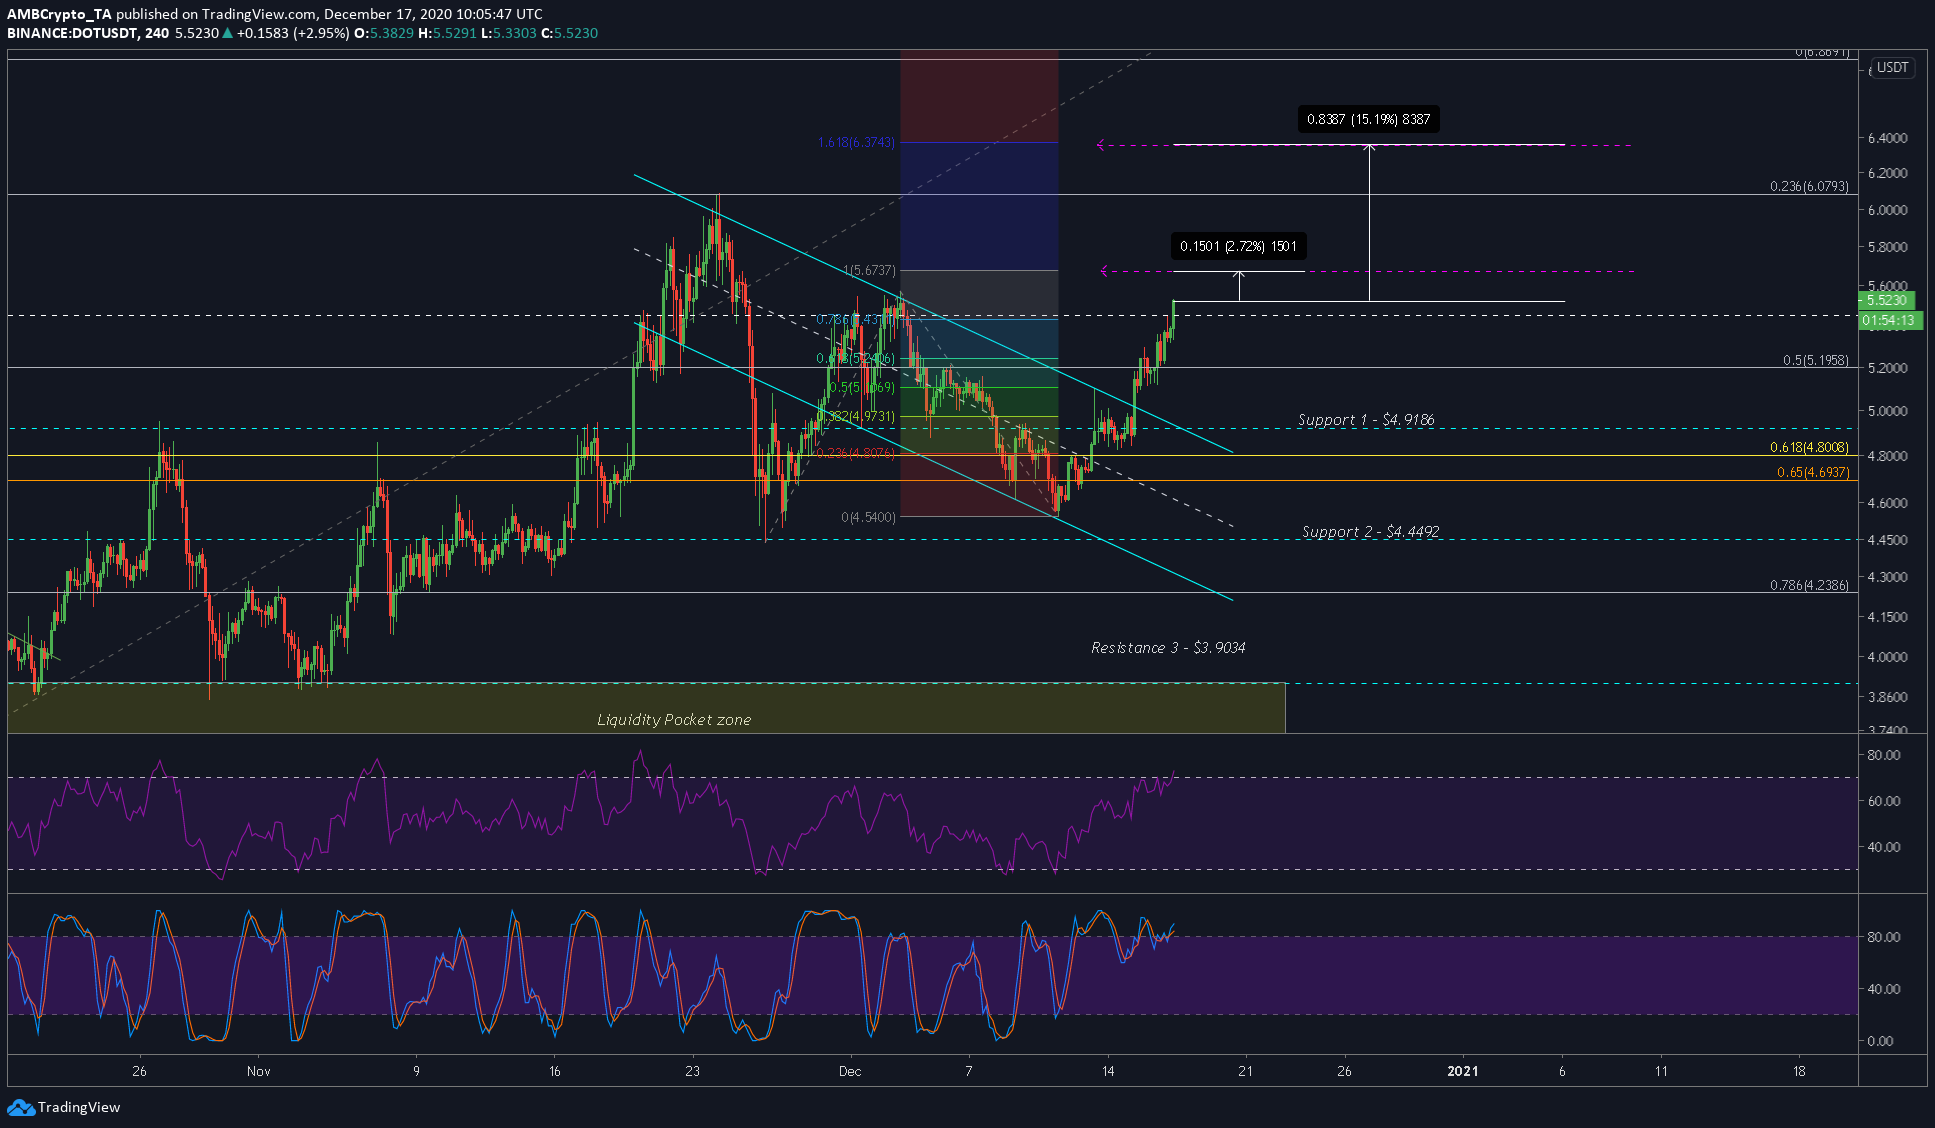
The above chart shows two targets, the first at 2.72% away from the current price and the other 15% away [$6.37]. These targets are a result of the trend-based Fibonacci tool, which takes into account the previous trend to predict the next top/bottom.
This tool indicates important target levels as mentioned above. However, should this bullishness run dry, then the price will head lower; in such a case, the targets include $5.198, $5.1, and $4.97.
However, there is a strong chance for DOT to bounce off the larger Fibonacci’s 0.5 level at $5.198. Any dip lower than this will pose a serious threat to profits.