Polkadot Price Analysis: 18 January

Disclaimer: The findings of the following analysis are the sole opinions of the writer and should not be taken as investment advice
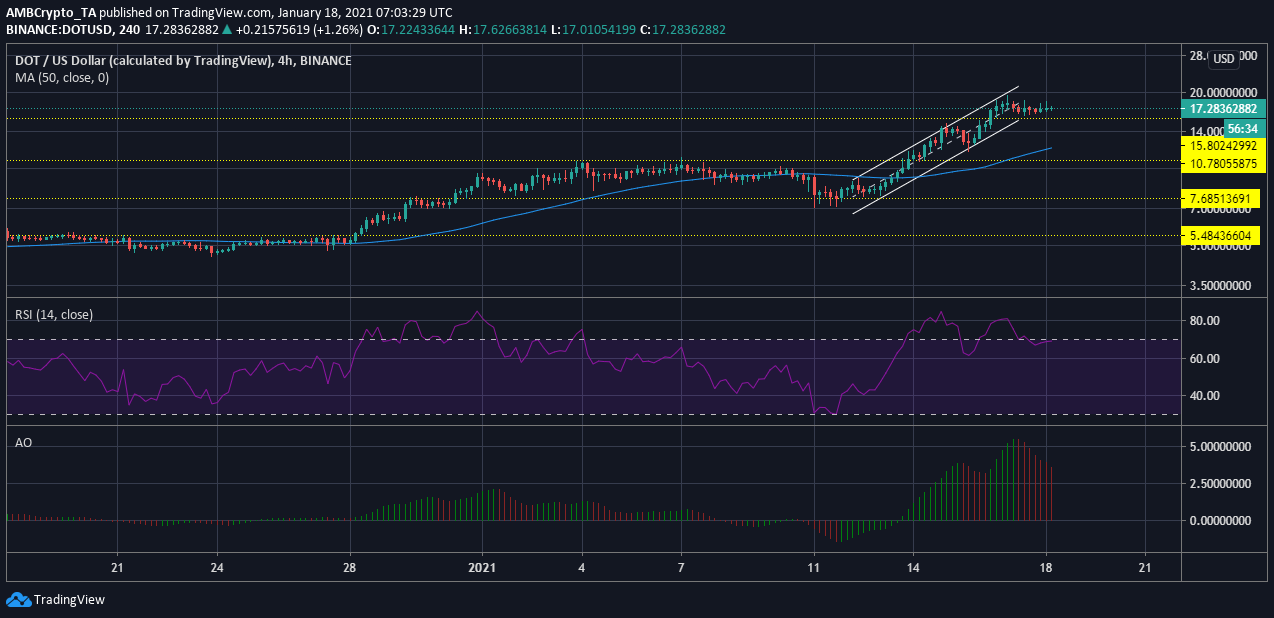
Polkadot’s price recently hit an all-time high of $19.47 and ever since then it has continued to hold on to this level. At the time of writing the value of DOT was $17.71, as it formed support at $15.80. Given the bullishness in Polkadot’s and Bitcoin’s market, the price may continue to waver at the current level.
Polkadot 4-hour chart

Source: DOTUSD on TradingView
The above chart of Polkadot saw the price accelerate from nearly $7 to $19. This appreciation of DOT surpassed various levels of resistance and soon overturned the bearish trend in the market. However, the price has now begun to signal a period of consolidation.
Given the current phase, the DOT market may remain at the current price level, despite the selling pressure maintained in the market.
Reasoning
The 50 moving average has reflected the bullishness of the DOT market. However, the moving average was closing in on the price due to the selling pressure. Meanwhile, the Relative Strength Index was noting that even though DOT had been overbought, it dropped under 70 as traders realized their profits, but the indicator has not sunk to equilibrium and has been moving close to the overbought zone.
The Awesome Oscillator has shown a gradual rise in momentum in the market as the asset’s value increased. Although it saw small retracements, the DOT market was re-ignited with buyers’ momentum. At the time of writing, the AO indicated the momentum was reducing but still dictated by the bullish market trend.
Conclusion
The DOT market, like the Bitcoin market, has been witnessing a period of consolidation. There is no signal of a drastic price swing in the market as the price has been holding on strong to the current level. However, a switch in the BTC market can also spark changes in the altcoin market.


