


Polkadot price was showing good buying pressure even though it hit a new ATH at $19.5. The price consolidated for almost 3 days before it proceeded to surge a whopping 18.86% in a single 4-hour candle. However, this surge was put to a halt as Bitcoin began falling on the charts. As a result, Polkadot’s price now sits at $16.5 after dropping 14.76% in under 8 hours. Its price needs to breach a crucial resistance level to stay bullish, else, the bears will push DOT to $14.9 or lower.
Polkadot 4-hour chart
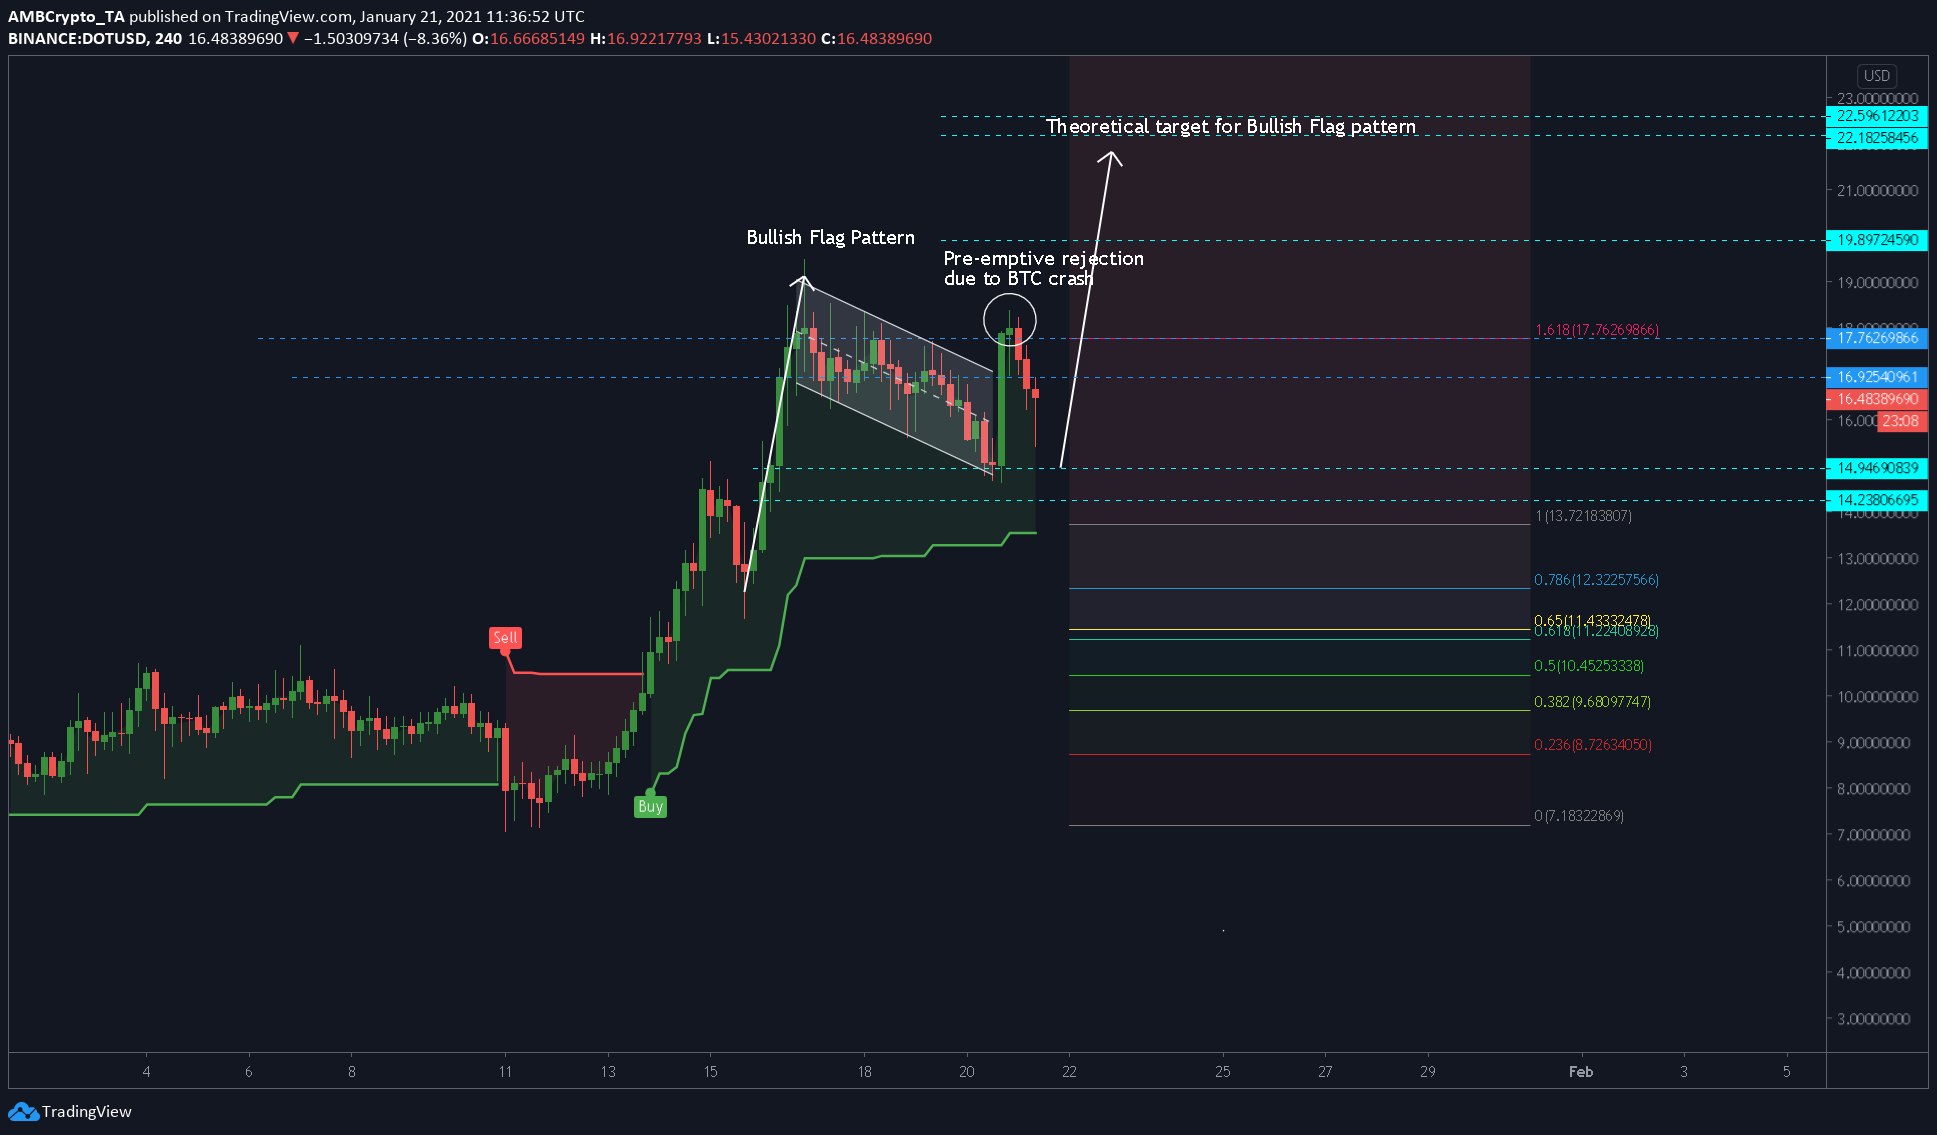
The price broke out of the bullish flag and was nothing but strong as DOT saw an 18% surge in 4 hours. However, the price seemed to have hit a ceiling at $17.76 on January 20, a level that also prevented the price from heading higher the first time around on January 16. Not only is this price a good resistance level but it is also the 1.618 Fibonacci level.
As crucial as this level seems, the price needs to climb above the $16.9 level first and then worry about breaching the $17.76 level. A failure to conquer the $16.9 level would give sellers the opportunity to push the price lower.
Although the SuperTrend indicator shows a buy signal, the top might be in for altcoins, at least as long as BTC is dropping. If Bitcoin continues to drop, we can expect DOT and other altcoins to drop. In this case, DOT might test immediate support at $14.9; massive selling pressure at this level could push the price lower to $14.23, which is a 14% drop from where the price currently stands.
Conclusion
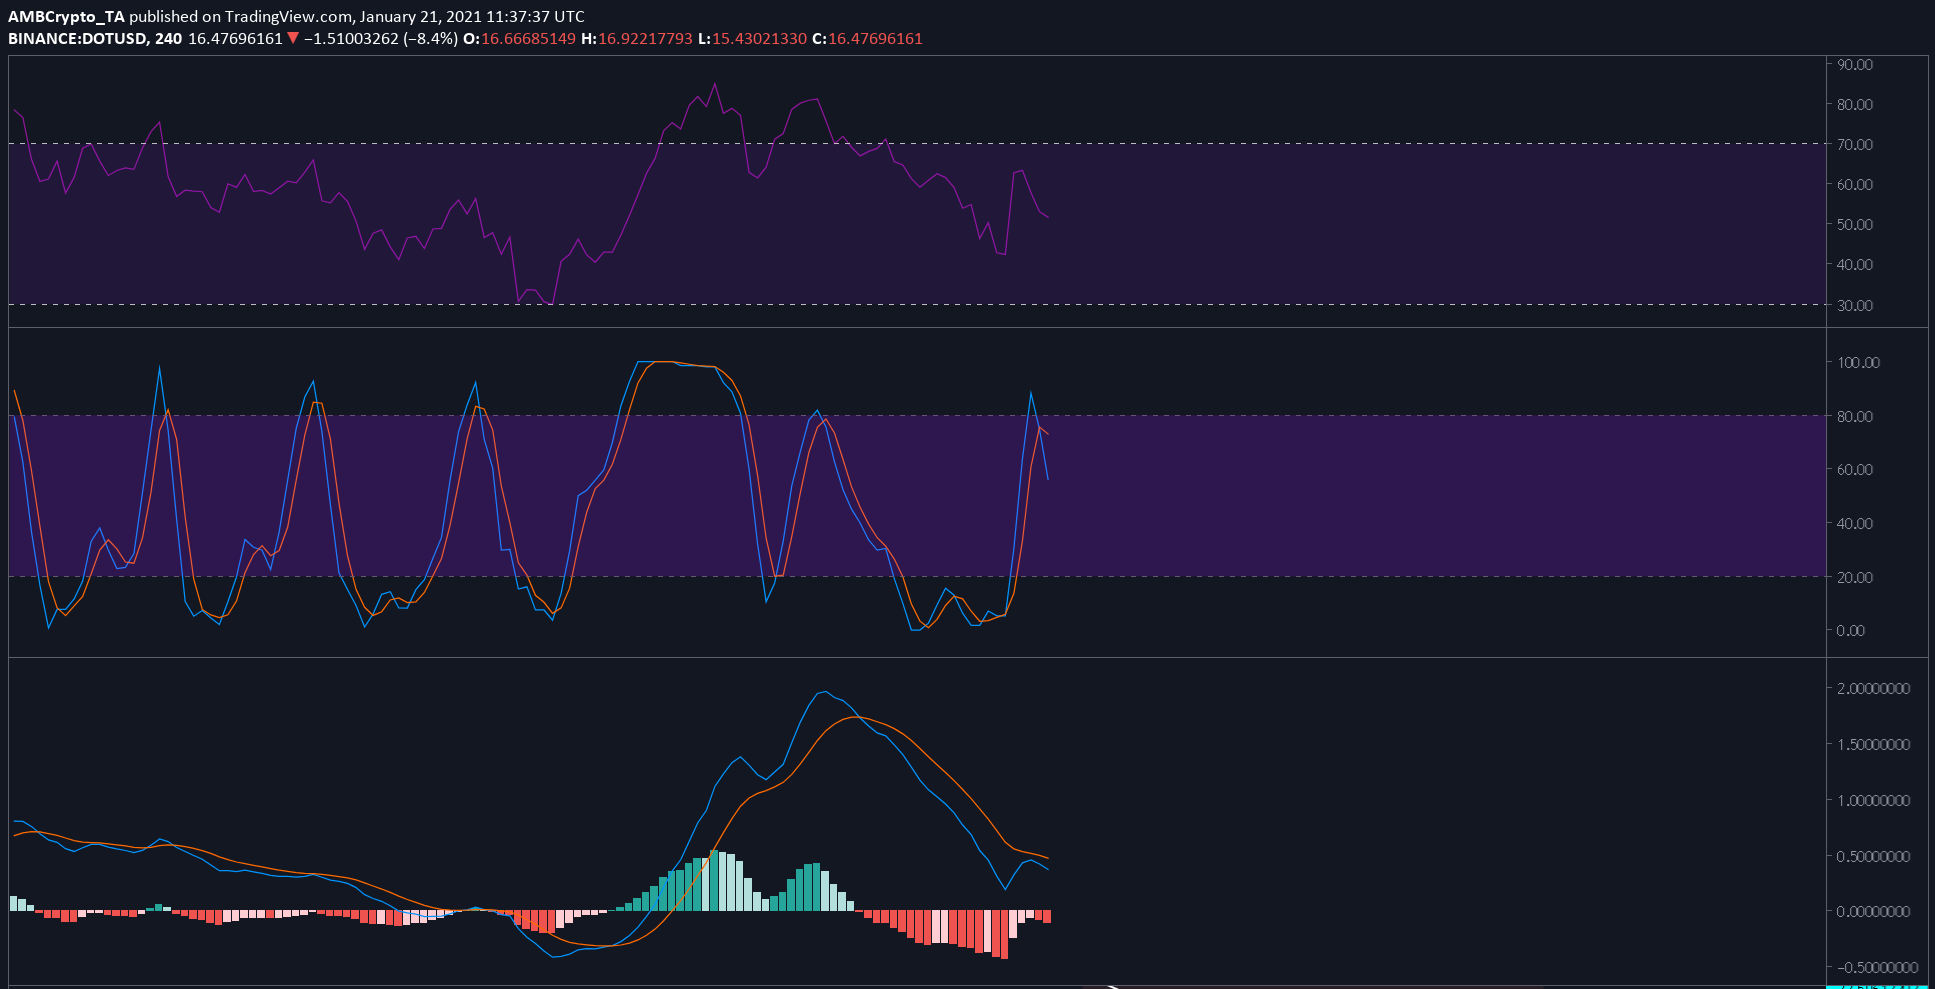
The RSI, Stochastic RSI, and the MACD indicator all show the failure of potential bullish signals displayed. However, due to the recent drop, the indicators have turned bearish.
Polkadot needs to climb above the $16.9 level to continue its trend higher and perhaps retest its ATH. However, a failure to do the same could push the price down subsequent support levels $14.9 and $14.23.