Polkadot price prediction shows 5% dip, but it’s not all bad news!
Price analysis showed that DOT could be forming a short-term bottom. Yet, the $4.22 level might be broken, at least briefly.

- Polkadot could see a slightly deeper price drop before recovery.
- The higher timeframe momentum was shifting bearishly as prices retested a support level.
Polkadot [DOT] achieved a bullish market structure break on Saturday, the 24th of August, but has retraced the move entirely. It was trading just above the $4.22 support level that it had retested two weeks ago.
A recent report noted that the $4 region was a psychological support zone. Will Polkadot prices fall to $4 before a recovery, or should traders expect a bounce from $4.22?
Should traders be bearish or bullish?
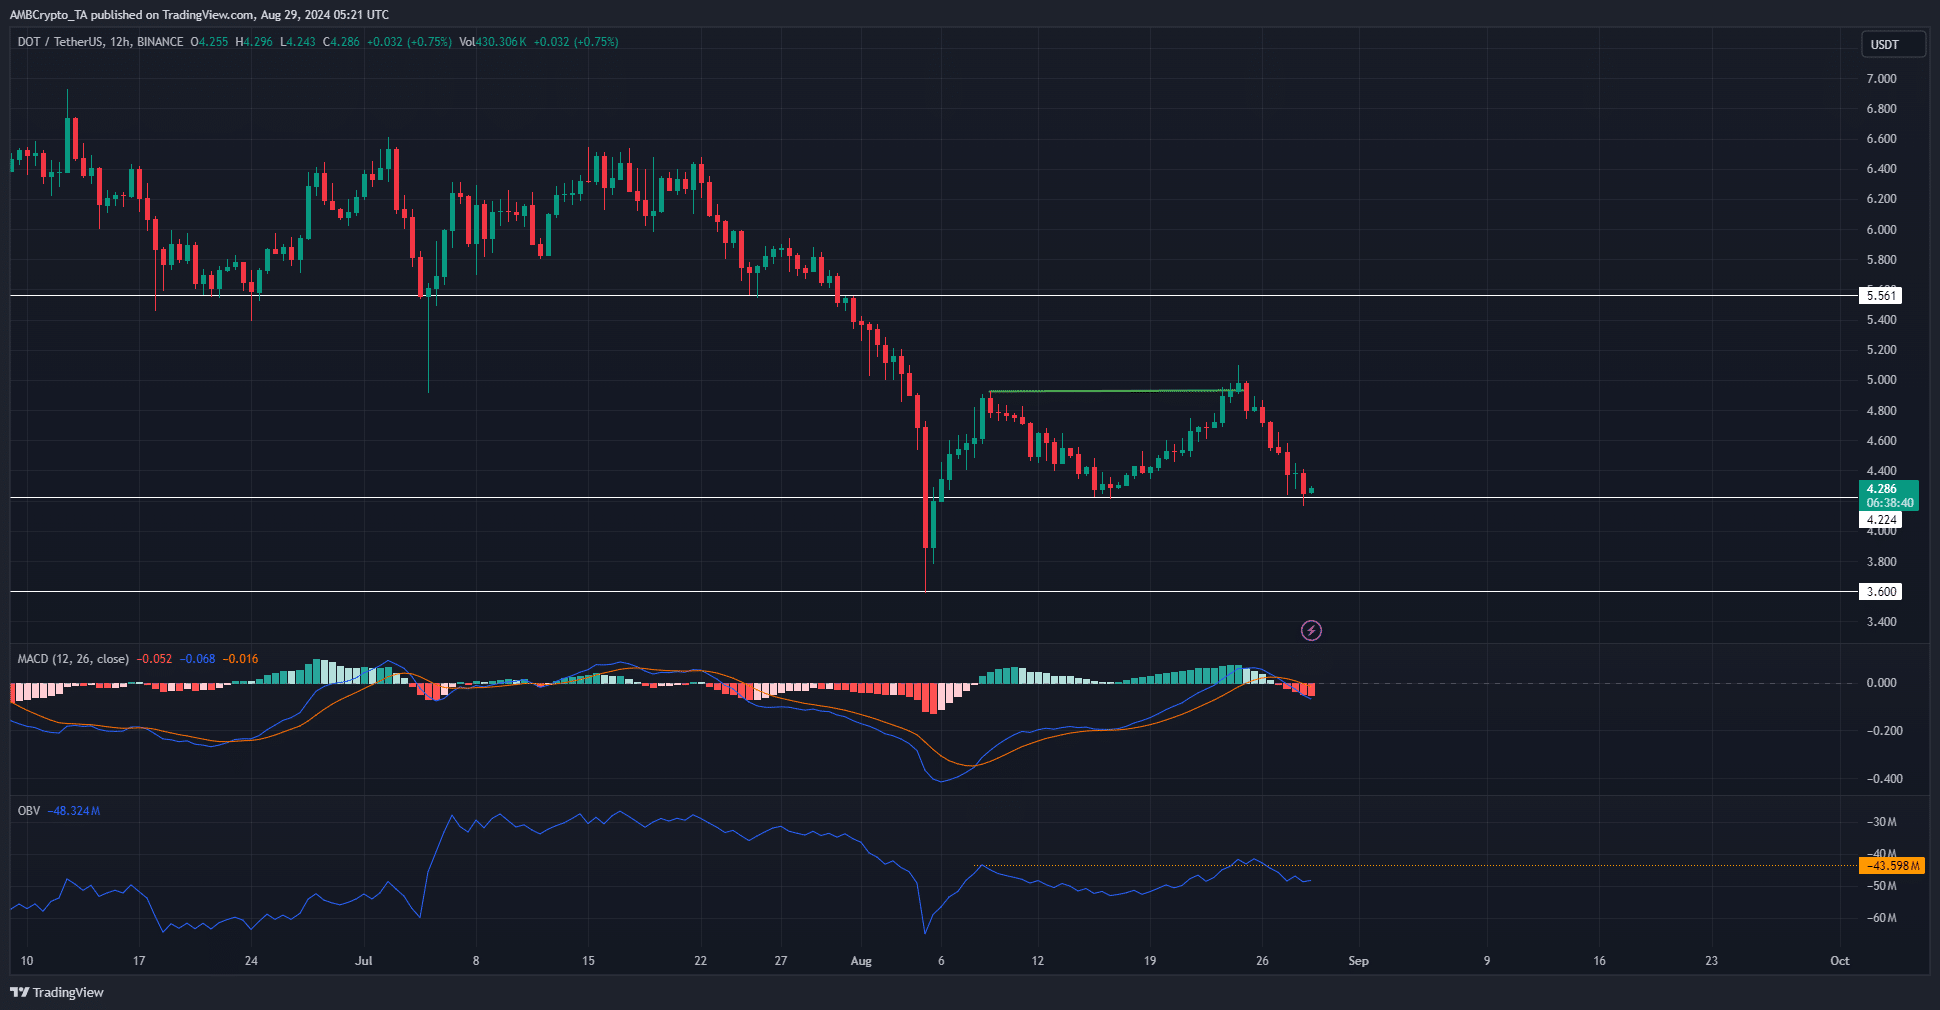
The market structure on the daily chart was bullish. The $4.22 level has served as support in the past two weeks and is likely to do so again, which could see DOT boosted to the local highs at $5. This could lead to a range formation.
Yet, the technical indicators showed some bearishness on the 12-hour timeframe. The MACD formed a bearish crossover to signal momentum was shifting, and the OBV saw a rejection near the highs from earlier this month.
However, the OBV did not sink too deep, meaning that traders need not expect a move toward $3.6 next.
A revisit to this level might be required before recovery
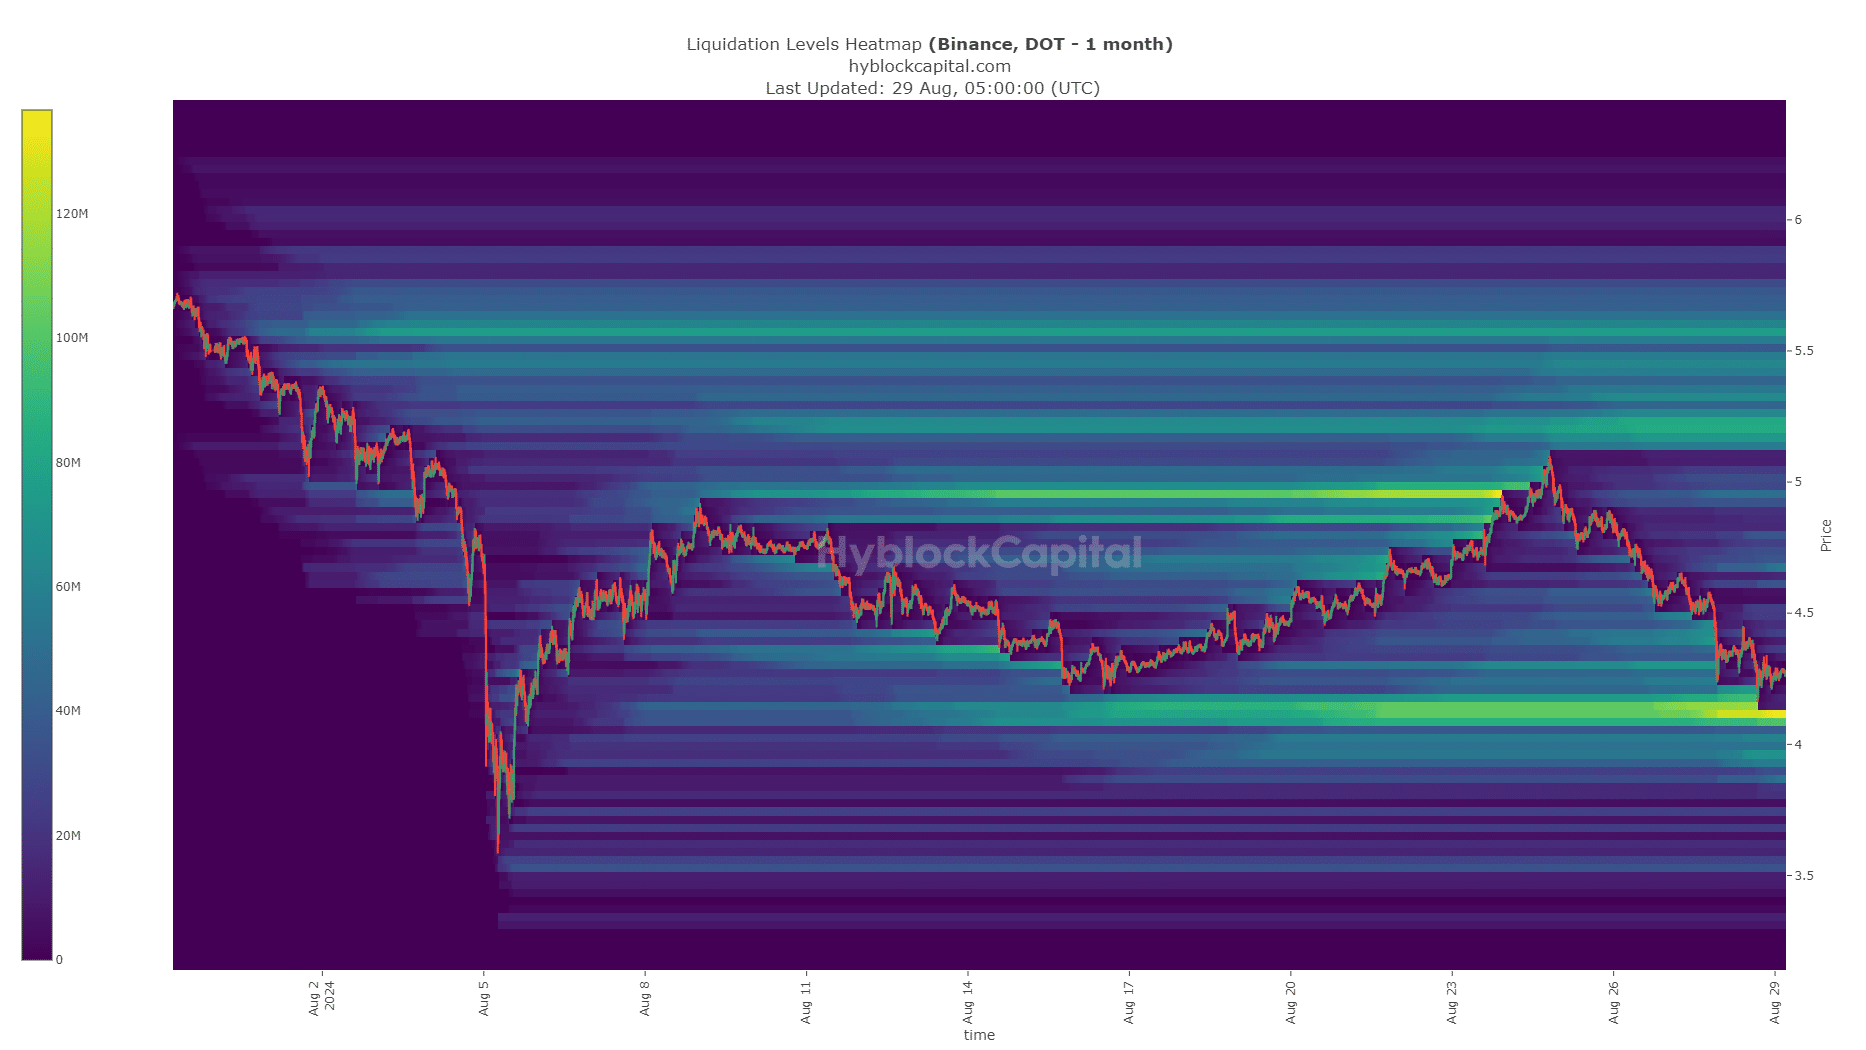
The price analysis showed that DOT could be forming a short-term bottom. Yet, the $4.22 level might be broken, at least briefly, according to AMBCrypto’s analysis of the liquidation heatmap.
Read Polkadot’s [DOT] Price Prediction 2024-25
There was a dense cluster of liquidation levels at $4.11 that could attract prices to it before a reversal.
Therefore, swing traders can look for buying opportunities at $4.05-$4.11 targeting a reversal to $5.17, the next liquidity pool to the north.
Disclaimer: The information presented does not constitute financial, investment, trading, or other types of advice and is solely the writer’s opinion