Polkadot price surges 19% in a week – THIS urges caution for swing traders
A 150% increase in daily network activity has sparked interest in DOT.



Since Monday, the 31st of August, Polkadot [DOT] has rallied 18.9%. The altcoin was once again testing the psychological $1 resistance level, a level it last traded above back in June.
It was reported that the daily network activity spiked by 150%. A large part of this activity was driven within the Polkadot Products Devnet environment.
The activity spike was a positive for the network, but it might not result in a sustainable price trend for the token. In August, news that Grayscale would not be proceeding with its proposed Polkadot ETF product caused negative sentiment around the altcoin.
Polkadot price trends have been bearish throughout 2026
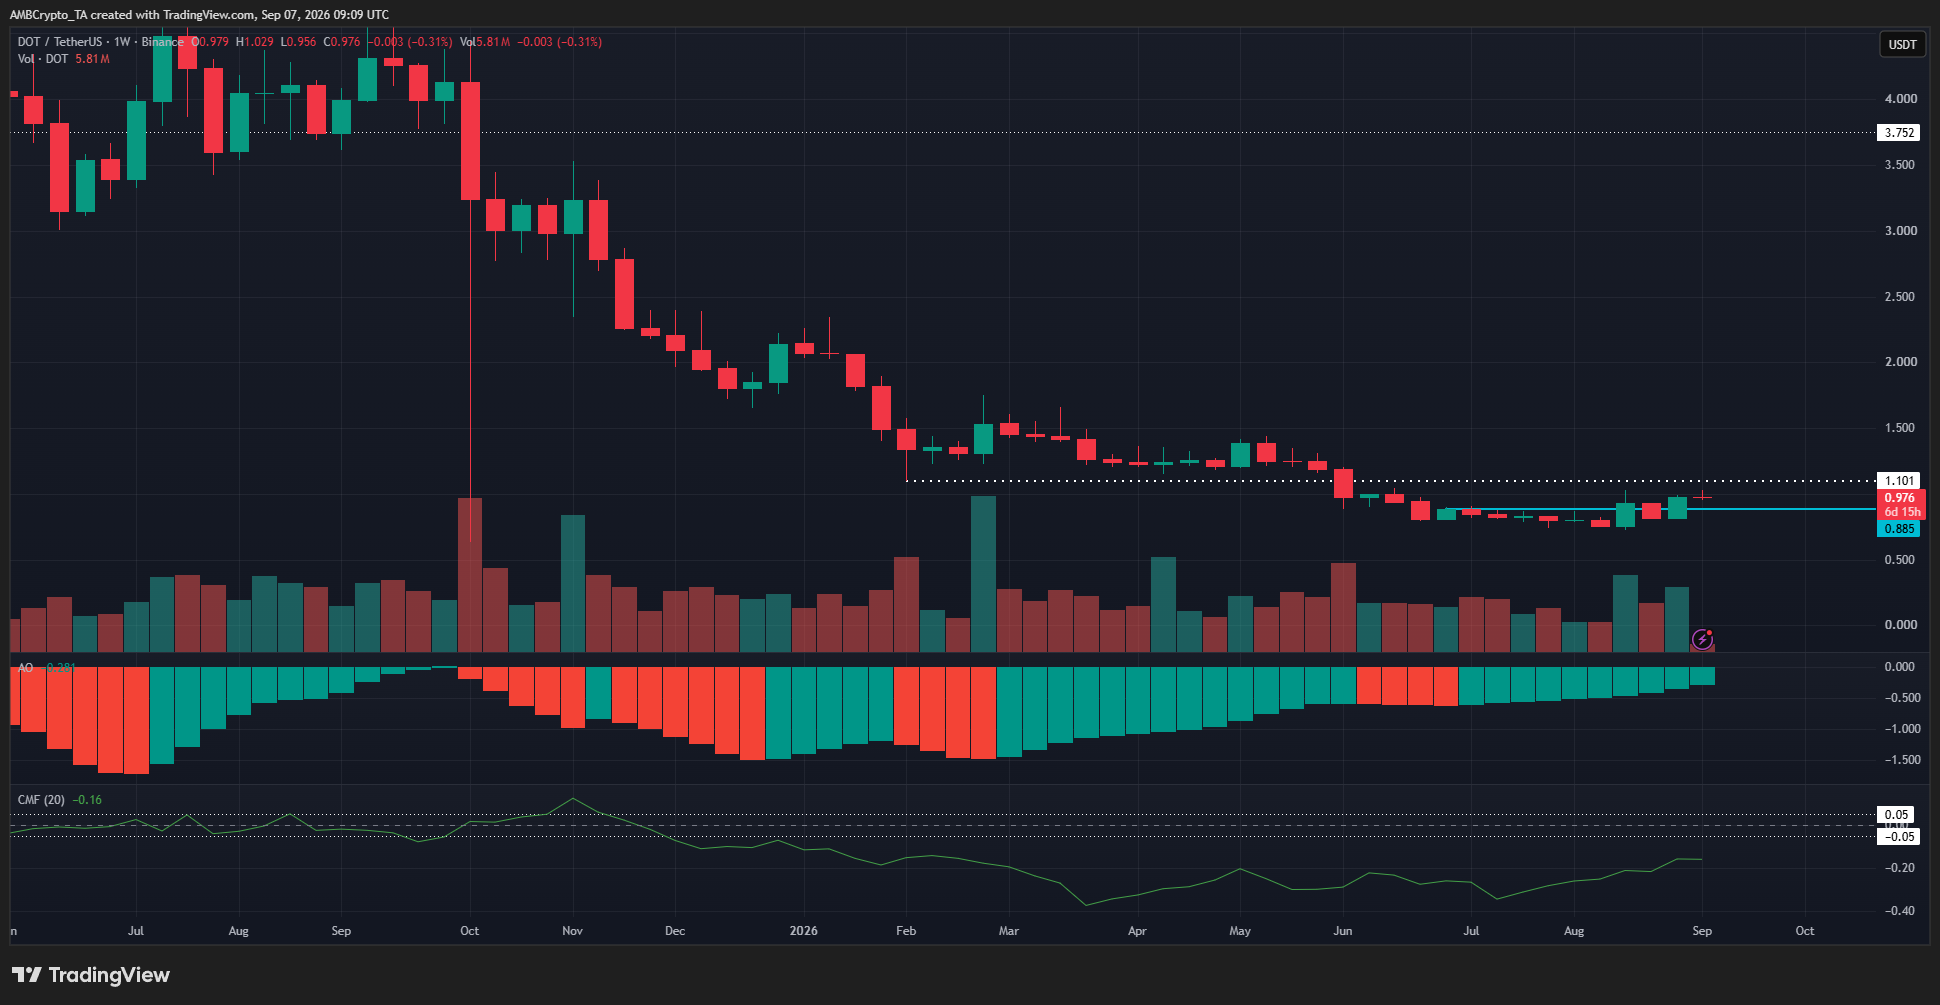
There has been a noticeable Polkadot price move higher since mid-August, but long-term investors must remember that the price move came within a broader downtrend.
The weekly chart showed that DOT has been in a downtrend since June 2025, when it first slipped below the $3.75 long-term support. The latest price bounce needs to close a weekly session above $1.38 to show that the weekly structure was changing.
The $1 supply zone stood in the way of the bulls looking to make this happen. Despite the recent price uptick, the CMF showed that long-term capital flows remained firmly dominated by the sellers, with a reading of -0.16 at the time of writing and consistently low values throughout the year.
Traders’ call to action – Take profits
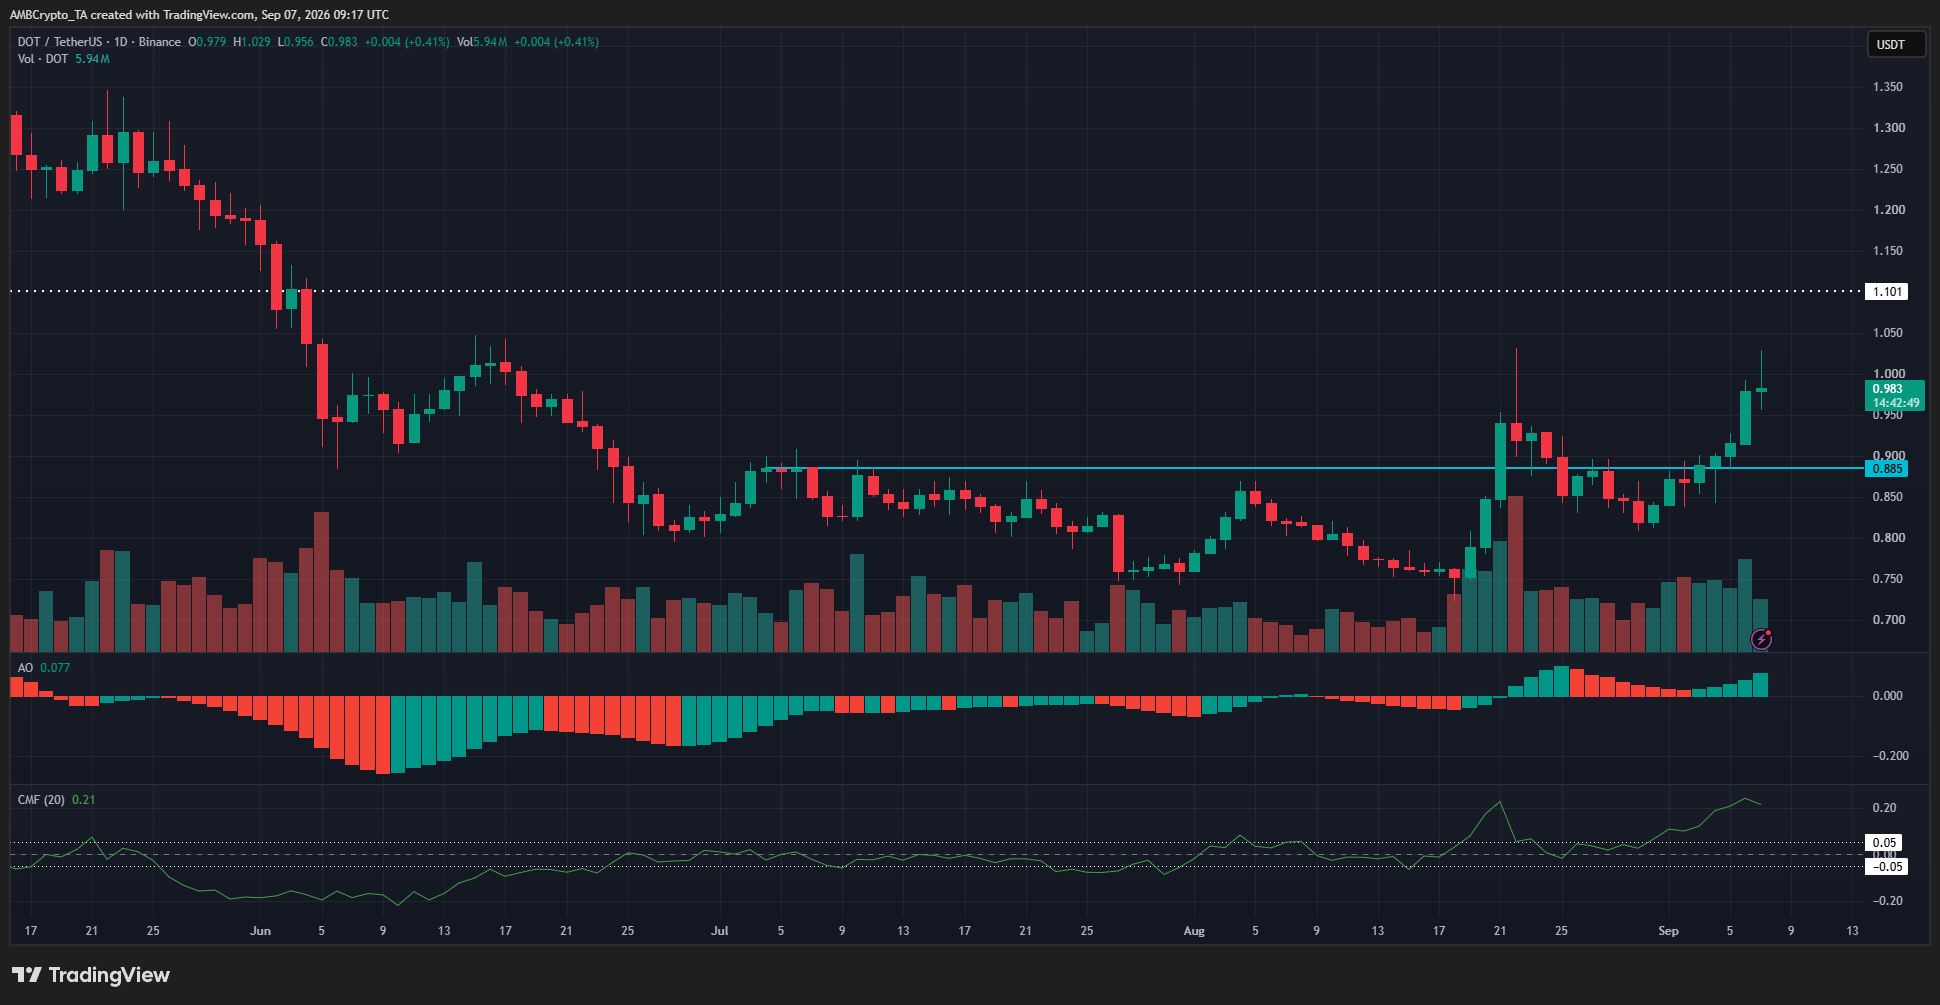
While the weekly trend was bearish, the 1-day timeframe signaled a bullish shift. The downtrend’s lower high at $0.88 (cyan) has been breached. The Awesome Oscillator indicated that upward momentum was strong.
The CMF’s reading of +0.21 also highlighted sizeable buying pressure.
Yet, DOT is in a long-term downtrend, and the $1 and $1.38 resistance zones remain standing. Until they are breached, holders and swing traders can use this rally to take profits and stay sidelined to wait for a true recovery.
Final Summary
- A 150% increase in daily network activity, alongside a renewed challenge of the $1 resistance zone, has sparked interest in DOT.
- The altcoin is trading within a long-term downtrend, and its rally could be capped by the $1.0 and $1.40 overhead supply zones.